email: fcomeron@eso.org 22institutetext: I. Physikalische Institut, Universität Köln, D-50937 Köln, Germany 33institutetext: OASU/Observatoire de Bordeaux, Université de Bordeaux I, F-33270 Floirac Cedex, France
email: schneider@obs.u-bordeaux1.fr 44institutetext: OAMP, 2 place LeVerrier, F-13004 Marseille, France
email: delphine.russeil@oamp.fr
Star formation in RCW 108: triggered or spontaneous? ††thanks: Based on observations obtained at the European Southern Observatory using the ESO New Technology Telescope (NTT) (programs 61.D-0447, 64.L-0049, and 71.C-0429), the ESO-MPI 2.2m telescope (program 62.I-0454), the ESO 3.6m telescope (program 69.C-0522(A)) and the Swedish-ESO Submillimeter Telescope (program 61.C-0243), on La Silla, Chile.
We present visible, near infrared, and mm-wave observations of RCW 108, a molecular cloud complex in the Ara OB1 association that is being eroded by the energetic radiation of two O-type stars in the nearby cluster NGC 6193. The western part of the RCW108 molecular cloud, for which we derive a mass of M⊙, contains an embedded compact HII region, IRAS 16362-4845, ionized by an aggregate of early-type stars for which we estimate a mass of M⊙. The spectral type of the earliest star is O9, as confirmed by the visible spectrum of the compact HII region. We notice a lack of stars later than A0 in the aggregate, at least having the moderate reddenings that are common among its B-type stars, and we speculate that this might be a consequence of the extreme youth of the aggregate. We also note the existence of a dense ionized clump ( cm-3) appearing near the main ionizing star of the compact HII region. We examine the distribution of stars displaying infrared excesses projected across the molecular cloud. While many of them are located in the densest ( cm-3) area of the molecular cloud near the position of IRAS 16362-4845, we also find a group concentrating towards the edge of the cloud that faces NGC 6193, as well as some other stars beyond the edge of the molecular cloud. The intense ionizing radiation field by the O stars in NGC 6193 is a clear candidate trigger of star formation in the molecular cloud, and we suggest that the existence and arrangement of stars in this region of the molecular cloud supports a scenario in which their formation may be a consequence of this. However, infrared excess stars are also present in some areas of the opposite side of the cloud, where no obvious candidate external trigger is identified. The existence of such tracers of recent star formation scattered across the more massive molecular cloud associated with IRAS 16362-4845, and the low star formation efficiency that we derive, indicate that it is in a state to still form stars. This is in contrast to the less massive cloud ( M⊙) close to NGC 6193, which seems to be more evolved and mostly already recycled into stars, and whose internal kinematics show hints of having been perturbed by the presence of the massive stars formed out of it.SM: HII regions – ISM: individual object: RCW 108 – ISM: clouds – ISM: infrared
Key Words.:
I1 Introduction
RCW~108 (Rodgers et al. rodgers60 (1960)) is an extended HII region belonging to the Ara~OB1 association (Herbst & Havlen herbst77 (1977), Kaltcheva & Georgiev kaltcheva92 (1992)), highlighting one of the few remaining places of Ara OB1 where star formation is still active (Yamaguchi et al. yamaguchi99 (1999)). The existence and arrangement of objects and structures usually associated to massive star formation (early-type stars, molecular clouds with dense cores, embedded pre-main sequence stars, and ionized gas) makes it an interesting target for the study of the interplay between the interstellar gas and dust and newly formed stars. Its distance of approximately 1.3 kpc (see Arnal et al. (arnal03 (2003)) for a brief discussion; this is also the value that we adopt in the present paper) allows a study at good spatial resolution (1′ equals 0.4 pc). The HII region, NGC~6188, is actually the bright rim of a molecular cloud containing several star formation sites. The eastern edge of this cloud is being eroded by the ionizing radiation of the nearby O-type stars HD~150135 and HD~150136 in the open cluster NGC~6193. Embedded in this cloud lies a compact HII region (Shaver & Goss shaver70 (1970)) coincident with the source IRAS~16362-4845. This region is easily noticed in visible images of the area, but it is most prominent at near infrared wavelengths at which the diffuse bright-rimmed HII region is hardly seen. The study of the ionizing stars of the compact HII region is especially interesting in the context of recent ideas on the determinant role that Trapezium-like clusters may play on the birth of high mass stars (e.g. Bonnell et al. bonnell01 (2001), Bonnell & Bate bonnell02 (2002)).
A pioneering study of IRAS 16362-4845 was published by Straw et al. (straw87 (1987)), who presented infrared imaging observations ranging from the band (1.25 m) up to 100 m, as well as low resolution infrared spectroscopy of two selected sources and of the ionized nebula. Although that work established some of the main characteristics of the compact HII region and its associated stellar population, its depth and spatial resolution are rather modest by the standards of current instrumentation on medium-sized telescopes. Moreover, only IRAS 16362-4845 and its immediate vicinity are considered in Straw et al. (straw87 (1987)). A recent study based on radio recombination line, radio continuum, molecular line, mid-infrared (MSX), and near-infrared (2MASS) observations of a region comparable to the one discussed in the present paper has been published by Urquhart et al. (urquhart04 (2004)). Finally, low angular resolution molecular observations of RCW 108 in the 13CO J=10 line (Yamaguchi et al. yamaguchi99 (1999)) and the 12CO J=10 line (Arnal et al. arnal03 (2003)) provide useful complementary information on the larger scale distribution of lower density gas in the region and the existence of other star forming sites in Ara OB1.
This paper presents new visible and near infrared imaging and low resolution spectroscopy of IRAS 16362-4845 and its surroundings, aiming at complementing and updating the analysis of Straw et al. (straw87 (1987)) and at extending it to a broader area of the molecular cloud. We also present maps in the lines of 12CO J=21 and 13CO J=10 centered on IRAS 16362-4845 covering most of the area included in our near infrared images, and south of the emerged cluster NGC 6193. Additional interferometric observations of the H emission throughout much of the region centered on IRAS 16362-4845 are shown and discussed. Our imaging and molecular-line observations thus cover the densest areas of the molecular clouds, whereas the low resolution spectroscopy focuses on the compact HII region and its embedded stellar component.
2 Observations
2.1 Near infrared imaging
A near infrared mosaic in the (1.25 m), (1.65 m), and (2.2 m) bands, covering an area of on the sky, was obtained on the night of 22/23 February 2000 using the SofI infrared spectrograph and array camera at the ESO New Technology (NTT) telescope. The central area containing IRAS 16362-4845 was imaged at a greater depth by means of stack of 15 frames in each filter, each one containing 6 individual exposures of 2 sec coadded on the detector, obtained with small telescope offsets in between. The peripheral area was imaged by pointing the telescope at 32 regularly spaced positions defining the sides of a square centered on IRAS 16362-4845, each frame being in turn the result of 6 individual exposures of 2 seconds coadded on the detector. The spacing between consecutive pointings in the peripheral area was 1’, i.e., 1/5 of the field of view of the camera. Each sky position was thus imaged by five different pointings, except near the borders of the square pattern. After flat fielding and dark subtraction, the sky frame was constructed by median averaging the stack of the periphery frames (which were found to be virtually devoid of nebulosity) with clipping of the upper half of the pixel values. This sky frame was then subtracted from each individual pointing in both the periphery and the central area. All the -band images were then registered to construct the mosaic, using the positions of stars common to consecutive images as references to compensate for the telescope offsets. The mosaics in the other two filters were constructed by individually registering each of their component frames with the -band mosaic, in order to avoid slight relative scale distortions between filters due to accumulation of small errors in the registering process.
Sources were detected in our frames using DAOFIND (Stetson stetson87 (1987)). Relatively isolated unsaturated images of bright stars were used to determine an approximate PSF needed for the identification of point sources. Due to the crowdedness of the field outside the areas of densest nebulosity and to our interest in point sources only, photometry on the resulting mosaic was performed by defining an undersized aperture at the position of each detected star, measuring the flux inside it, and then adding the rest of the flux in the PSF as given by the fit of a circularly symmetric radial profile to each stellar image. This procedure allowed both to remove the contamination to the photometry to other stars located on the wings of the PSF, and to adjust to the mildly variable image quality across the field of view.
2.2 Visible spectroscopy
Spectroscopy was carried out on the night of 1/2 April 2003 using EMMI, the visible imager and spectrograph at the NTT. We chose a grism yielding a coverage of the interval at a resolution of with the 1”0-wide slit that we used. The slit was placed on the line joining the brightest star seen projected on IRAS 16362-4845 in visible-light images and the faint, very red star 4”0 to its Southwest that becomes the brightest one in the near infrared band111These are respectively denominated Star 8 and Star 12 in our discussion of the stellar aggregate associated to IRAS 16362-4845 in Section 3.4. The effective slit length, 8’0, provided us with a cut across the compact HII region but also included a bright segment of the rim nebula. We obtained 3 separate spectra of 10 minutes of exposure time each on the same telescope position, and then coadded the resulting frames. Spectra of the two stars were extracted using the APALL task on IRAF, defining sections adjacent to the traces of the stars for the subtraction of the sky and nebular emission together. Spectra of the nebula at selected points were extracted as well by interactively defining the apertures on the frames and defining an appropriate sky aperture in a suitable area (see discussion in Section 3.5). Relative flux calibration was performed using the spectrum of LTT 4364 (Hamuy et al. hamuy92 (1992)) as a reference. Wavelength calibration was carried out by extracting the spectrum of a ThAr lamp obtained with the same instrumental setup at the same aperture positions.
2.3 Near infrared spectroscopy
Near infrared simultaneous low resolution spectroscopy in the and bands was obtained using SofI in spectroscopy mode on the night of 2/3 April 2003. The grating used covered the 1.5 m - 2.4 m interval at a resolution with our 1”0 slit. In this case the slit was placed on the line joining the brightest near infrared source and another source 3”5 to its Southwest that is similarly bright in the infrared but redder in color, thus being undetected in our visible images222These are respectively denominated Star 12 and Star 16 in our discussion of the stellar aggregate associated to IRAS 16362-4845 in Section 3.4. Four individual spectra of 50 sec exposure each were obtained by slightly offsetting the telescope between exposures along the direction of the slit. Spectra were then extracted using a procedure analogous to that followed for the visible spectra. Cancelation of telluric features in the extracted spectra was achieved by observing the G3V star HIP 81746 immediately after the observation of RCW 108 at a very similar airmass, and relative flux calibration was carried out by assuming that the overall shape of the spectrum of HIP 81746 is well approximated by a black body at a temperature of 5700 K over the 1.5 m - 2.4 m interval. Wavelength calibration in the infrared was performed by using the airglow OH emission lines as a reference (Oliva & Origlia oliva92 (1992)).
2.4 Additional imaging observations
Besides the imaging and spectroscopy described in the previous Sections, we obtained some additional visible imaging that is helpful in illustrating the overall, large scale morphology of RCW 108 as well as the more detailed structure of the IRAS 16362-4845 HII region. For this purpose, a H image of the area was obtained using the Wide Field Imager (WFI) at the ESO-MPI 2.2m telescope on La Silla on the night of 26/27 March 1999. The image was obtained by combining four individual pointings of the telescope with offsets of approximately 2’ in order to cover the gaps between the individual CCD chips composing the WFI detector array. The exposure time of each individual frame was 300 sec. Additional short exposures through the and filters were also obtained, allowing their combination into a color image that has been widely reproduced elsewhere (see e.g. Collins Petersen collins01 (2001)).
We also obtained images of a smaller, field centered on IRAS 16362-4845 using the SUSI2 visible imager on the NTT on the night of 26/27 August 1998. Since the SUSI2 detector is also composed of two chips separated by a gap we divided the exposures into three pointings separated by small telescope offsets, allowing the reconstruction of a continuous image of the field with the gaps filled. The total exposure time in each filter is 9 minutes.
2.5 Millimeter CO observations
Observations of 12CO J=21 at 230.538 GHz and 13CO J=10 at 110.201 GHz were carried out using the SEST during September 1998 towards IRAS 16362-4845 (an area of was mapped) and south of the cluster NGC 6193 (). We refer hereafter to the molecular gas detected at those positions as the western and the eastern clouds, respectively. The map centers were =, = and =, = respectively. A pointing grid of 22 arcsec was adopted, similar to the beamsize at 230 GHz (23′′) and half-beamsize at 110 GHz (45′′). The velocity resolution of all data is 0.11 km s-1 and the velocity coverage is 32 to 7 km s-1 for the eastern cloud (around NGC 6193) and 36 to 13 km s-1 for the western cloud (around IRAS 16362-4845). The average system temperature throughout the observations was 210 K for 12CO J=21 and 140 K for 13CO J=10 . The calibration was done using the standard chopper-wheel method. The resulting atmosphere-corrected antenna temperatures were converted to main-beam brightness temperatures using the values for main-beam efficiencies quoted in the SEST Handbook (0.5 for 230 GHz and 0.70 for 110 GHz). The telescope pointing and subreflector focusing were checked regularly, we estimate the pointing accuracy to be better than 5 arcsec and adopt the standard SEST value of 10% for the uncertainty in the antenna temperature scale. The average r.m.s. main beam brightness temperature noise per channel is 0.5 K for 12CO J=21 and 0.2 K for 13CO J=10 .
2.6 Interferometric H observations
The H interferometric observations were made with the CIGALE instrument on the 3.6m telescope (La Silla) in April 2002. The data cubes were obtained with a spatial resolution of 0.4′′ for 4 fields centered on the compact HII region. The size of each field is 4.5 arcmin. The Fabry-Perot interferometer used has an interference order 1938 (at H wavelength) providing a spectral sampling of 3.2 km s-1 and a free spectral range of 155 km s-1. The interference filter used is centered at 6562 Å with a FWHM of 11 Å. The velocity and line width accuracy is estimated to be 0.7 km s-1. A complete description of the instrument, including data acquisition and reduction techniques has been given in le Coarer et al. (lecoarer92 (1992)). The H profiles are decomposed with the H geocoronal night-sky line (modeled by a purely instrumental profile) and a nebular line (modeled by an instrumental profile convolved with a gaussian). An automatic procedure has been used to perform the fit. Each field contains 512512 pixels, but in order to increase the Signal-to-Noise ratio (S/N) we extracted and analysed profiles from areas of 6.56.5′′ size. A rough flux calibration was performed by observing the planetary nebulae NGC 2899 and adopting fluxes given by Perinotto and Corradi (peri98 (1998)).
3 Results
3.1 Morphology of the distribution of gas
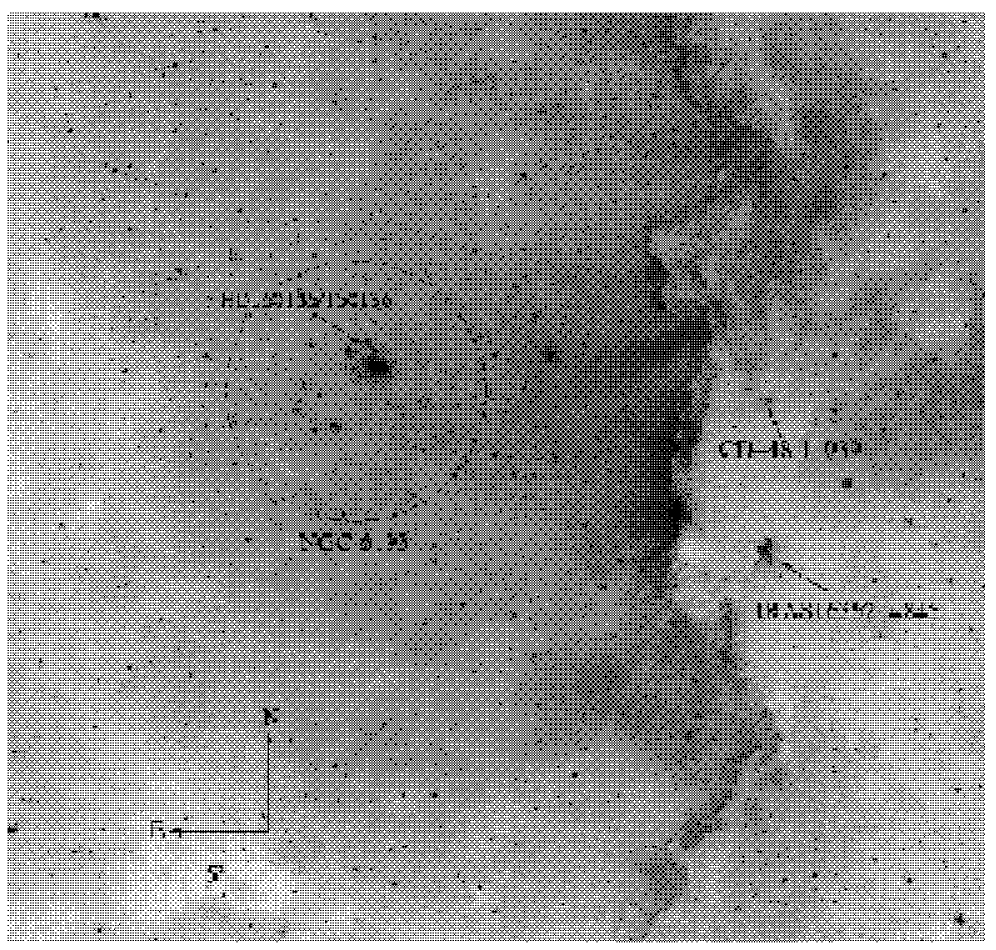
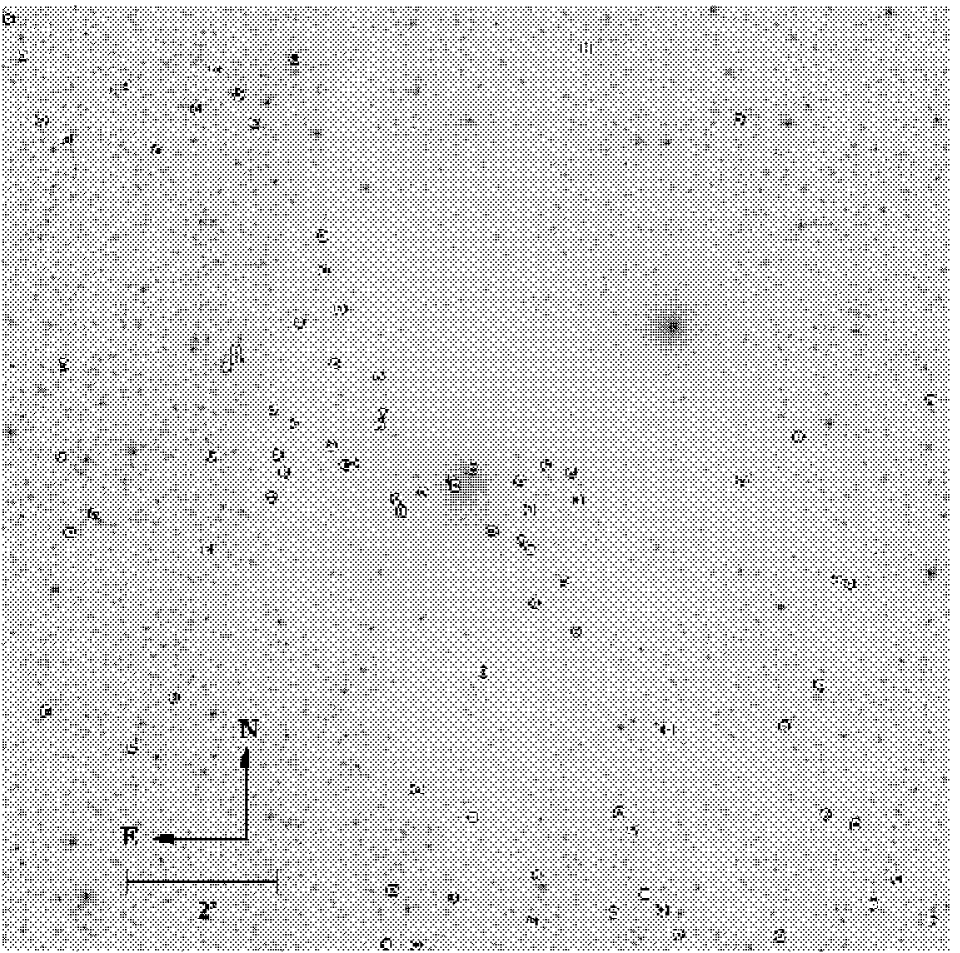
The overall distribution of ionized and molecular gas over the RCW 108 area and its surroundings is well illustrated by the negative wide-field H image presented in Figure 1. The cluster NGC 6193 occupies the central/eastern side of the field and is dominated by the close pair of O stars HD 150135/150136. Glow in H – visible as dark patches – is present over most of the field, mostly arising from gas on the background of NGC 6193, as well as probably from gas left over from the formation of the cluster indicated by a peak in molecular line emission seen in the same direction as its brightest stars (see Section 3.2). A simple inspection of the starcount density in the area to the East of the rim nebula indicates that the extinction on the background is low in the Northern half and higher towards the Southeast.
The arrangement of illuminated and shadowed areas in the rim nebula suggests that most of the interface between the molecular cloud and the ionization front eroding it is seen roughly edge-on. The pattern of bright nebulosities and shadows dramatically reveals the intricate three-dimensional structure, as well as the existence of regions with widely varying densities. The column density of the gas near the Northern and Southern edges of the rim nebula is low, as seen from the only slight decrease of stellar density in its direction, as compared to the more opaque clouds located near the center of the image. Small, high density cores are visible as dark patches projected against a brighter background all over the nebula, and some of them appear on areas where the erosion front has traveled past them, leaving them isolated from the bulk of the molecular gas to the West.
The most conspicuous star forming site of RCW 108, IRAS 16362-4845, roughly coincides with the thickest part of the molecular cloud, as shown by both starcounts and molecular-line maps (Section 3.2; see also Figure 3). North of it one finds the reflection nebula surrounding the B3V star CD-48~11039 (Herbst herbst75 (1975)). No other star forming sites are obvious in either visible or infrared images, although we will discuss evidence for other lower-mass star forming sites spread across RCW 108 in Section 3.6.
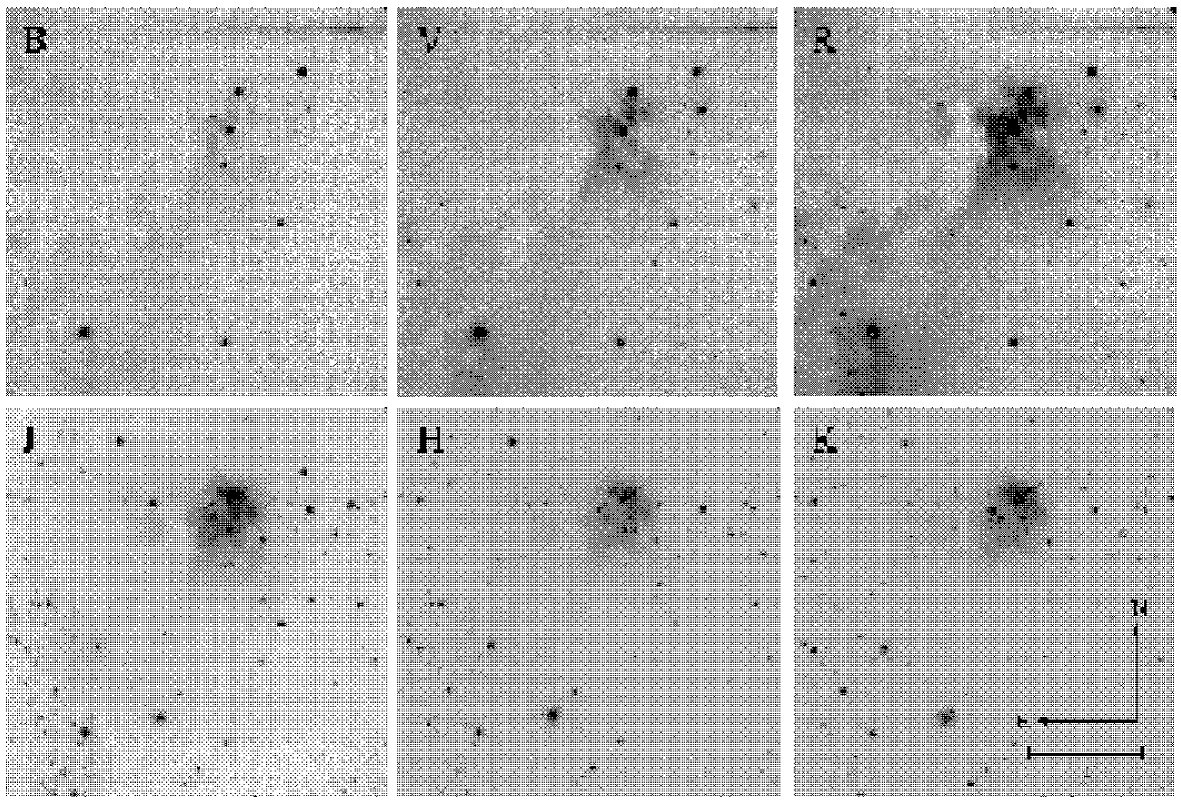
A comparison of visible and near infrared images of IRAS 16362-4845 and its surroundings, shown in Figure 2, provides useful information on the structure of the compact HII region. In the visible, the brightest patch of nebulosity lies at the position of three bright and only lightly reddened stars evenly spaced roughly in the North-South direction. The peak of visible H emission is displaced to the South of the nominal IRAS position, where the visible H emission is comparatively faint. This indicates that the core of the compact HII region is heavily reddened, and thus that the northernmost of the three bright visible stars is not its ionizing star, as already noted by Straw et al. (straw87 (1987)).
Broad-band visible images in and show reflection nebulosity to the Southeast of the zone of most intense H emission. This might be caused by a relatively unimpeded line of sight from that vantage point to the stars ionizing the HII region. However, we believe it more likely that the source of illumination is actually an anonymous star located to the Southeast, at , . Although this star does not show any distinctive signs of belonging to the association from the data at hand, indirect evidence comes from a very red source lying 28” to its Northeast, which seems to be still embedded in the remnants of the core from which it formed. This core casts a shadow on the surrounding nebula that points directly away from the star noted above.
The relatively unobscured view into the nebula provided by the infrared images shows important differences with the visible-light picture. The -band image, which mainly traces the emission in Br (2.166 m) and HeI (2.058 m), is now clearly peaked at the position of the IRAS source, where a tight cluster of reddened stars (Section 3.4) is seen, and extends eastwards in the general direction of NGC 6193. This eastward extension is totally blocked from view in visible images by an opaque layer of dust that in some small areas is thick enough to block the background emission even in the band.
To summarize, the overall structure of IRAS 16362-4845 hinted by the visible and infrared images is that of an embedded compact HII region. The foreground extinction decreases towards the South, where the peak of the visible emission is, but the HII region itself presents an extension towards the East that lies behind a thicker layer of obscuring dust. At the adopted distance of 1300 pc the size of the compact core is pc (), surrounded by a fainter halo of pc () in diameter, and the eastward extension reaches up to pc () from the center of the core. In the following section, we present the results of our molecular line mapping which support the scenario described above.
3.2 Molecular line maps
3.2.1 Overview
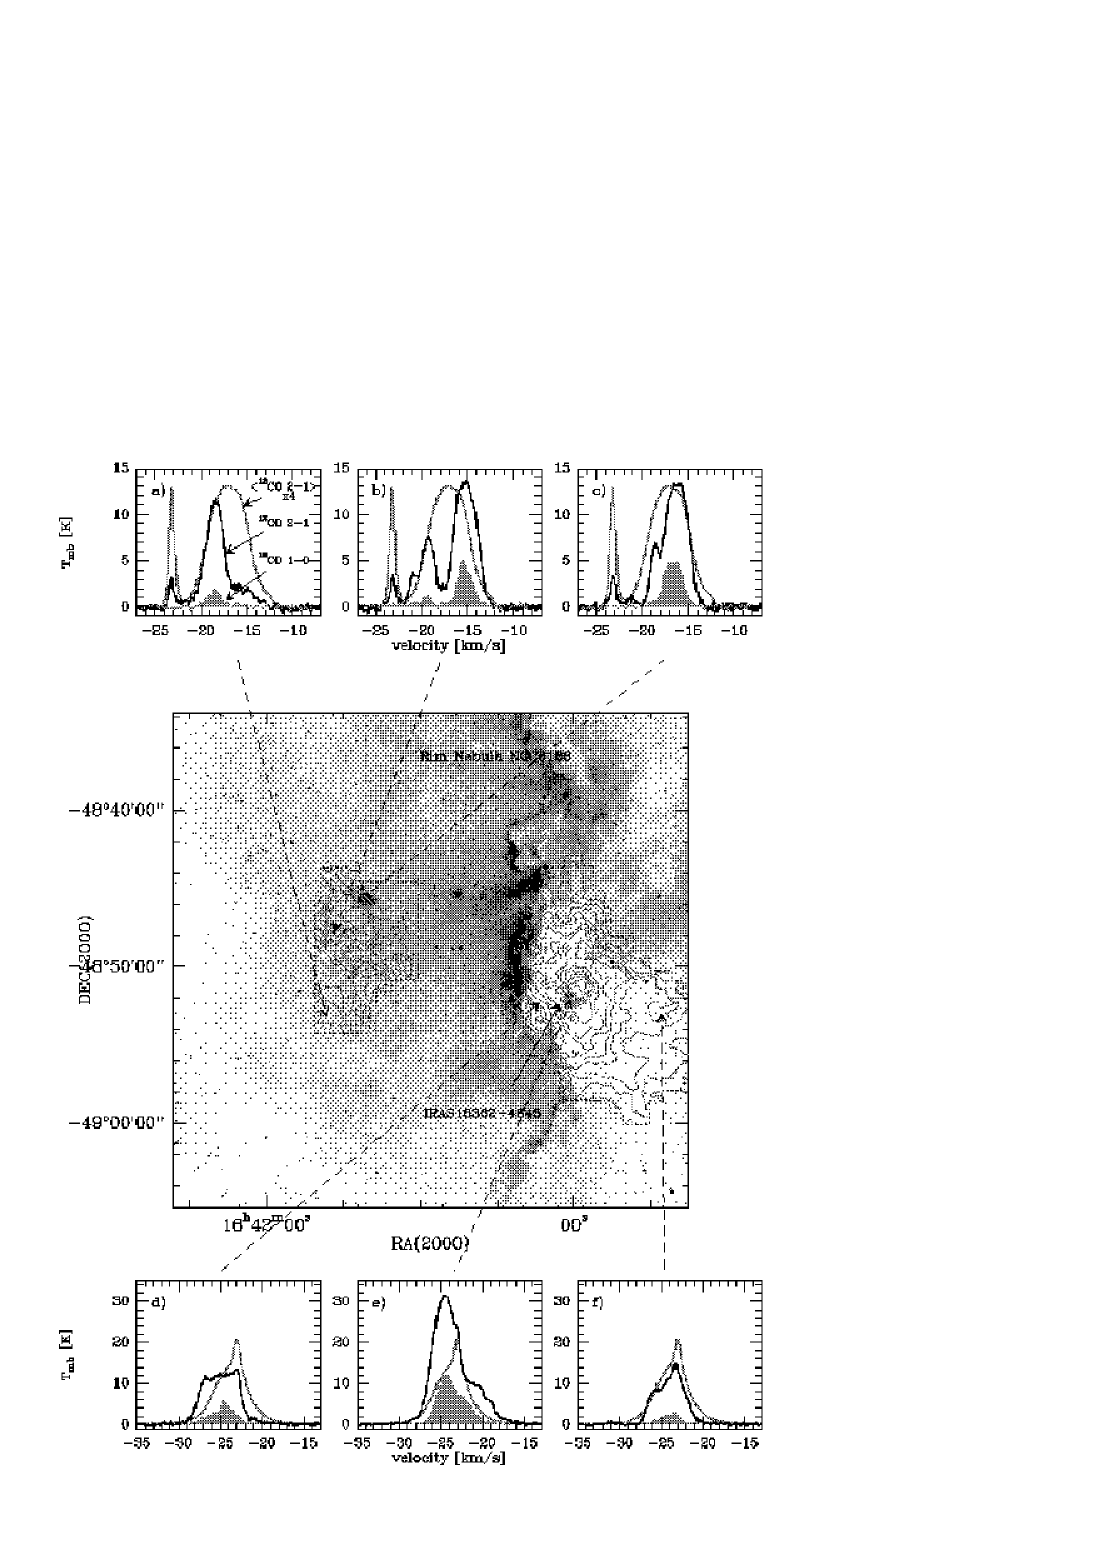
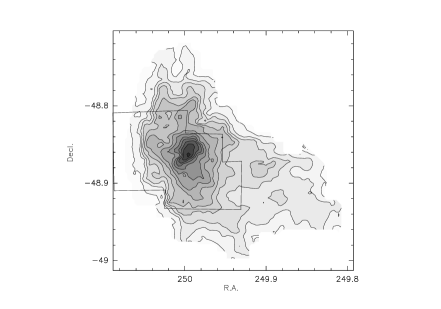
We focussed on mapping the environment of IRAS 16362-4845 and NGC 6193 in the 12CO J=21 and 13CO J=10 lines. The normally optically thin 13CO J=10 line is used to determine the column density and mass of the molecular clouds (Sec. 3.2.3) while the 12CO J=21 line provides an overview of the general small scale (23′′) distribution of molecular gas even on a low intensity level. Figure 3 (center) presents an overlay of 12CO J=21 emission on the optical image where the eastern and western molecular clouds apparently associated with IRAS 16362-4845 and NGC 6193 are outlined by contours of CO emission. The western cloud corresponds very well to a region of high extinction (white areas in the H image) which is not the case for the eastern cloud fragment. There, regions of high extinction are more diffuse and less clearly defined.
Arnal et al. (arnal03 (2003)) mapped a 2.753∘ region around RCW 108 at 8.′7 resolution in 12CO 10 and revealed a network of molecular clouds at velocities between 50 and +6 km s-1. However, by using the galactic rotation curve they conclude that only CO emission between 27 and 15 km s-1 is related to the Ara OB1 association. This velocity range matches to our maps and indeed, we observe a very close correspondence between the western cloud and features related to Ara OB1 (the rim nebula NGC 6188 and IRAS 16362-4845): the interface between HII region and western molecular cloud is impressively outlined by a sharp gradient of molecular line emission and follows closely the optical features. This indicates also that we see this region edge-on as already concluded from the H image alone (Section 3.1). Another prominent feature of the western cloud is the marked peak of 12CO J=21 emission close to the position of IRAS 16362-4845. The ionized gas of this compact HII region is seen as a dark patch slightly shifted south-east from the main CO peak. Considering the distortion of the CO contour lines in this area, a close interaction between ionized and molecular gas is likely, i.e. erosion of molecular clumps by streaming ionized gas.
In contrast to this rather evident correspondence between ionized and molecular gas, the molecular emission close to the pair of O stars HD 150135/150136 does not show a clear morphology which is related to these stars. It shows a globular structure with a region of high column density pointing away from the stars in south-east direction. Lower density material without directed structure is present in the south and southwest. This cloud was mapped at 2′ angular resolution by Phillips et al. (phillips86 (1986)) and they concluded that it represents a wind-swept globule probably shaped by NGC 6193, i.e. HD 150135/150136. In our velocity integrated map, this scenario is not so clear and we will come back to this point in the next section where channel maps are discussed.
A first impression of the complex velocity structure of the molecular clouds is given by the 12CO J=21 and 13CO J=10 spectra displayed in Fig. 3. The upper panels from the NGC 6193 region show that there are several velocity components which are present at all positions but vary in intensity. The most distinct feature is a single line at 23 km s-1 whereas the other lines between 21 and 12 km s-1 partly overlap. However, there is a clear velocity gradient across the cloud, visible as a line shift compared with the the average 12CO J=21 spectrum (in grey) from 19 km -1 (a) to 15 km s-1 (c). Since 12CO J=21 and 13CO J=10 show the same line profile, effects like self-absorption can be excluded in first order.
The lower panels represent three positions from the western cloud where the line profiles are less variable. The 12CO J=21 spectrum from the interface region (d) displays a flat-top profile (while the 13CO J=10 line looks like a blending of several gaussian components), probably indicating self-absorption effects at all velocities. In contrast, the 12CO J=21 spectrum from a quiescent cloud region (f) and the average profile show a decline in intensity only between 30 and 24 km s-1. The 13CO J=10 spectrum from the peak position of IRAS 16362-4845 (e) shows that at least two Gaussian lines – though blended – at –22 and –24 km s-1 can be identified. We find at this position most intense 12CO J=21 brightness temperatures of 30 K. Interestingly, the 12CO J=21 spectrum even indicates additional emission in the form of a non-gaussian broad wing between –21 and –17 km s-1 which is not present in the other spectra. Since this emission feature is not well spatially focused (see Fig. 5) and only very weak wing emission on the blue side of the spectrum (between –27 and –29 km s-1) is found, we assume that it is probably not due to the outflow emission of a YSO. As we will see in the channel maps (Fig. 5), the –21 and –17 km s-1 emission feature is only found at the position of IRAS 16362-4845 and - even more prominent - northwest of this source. It may represent a second component of the molecular cloud showing a close interaction with the HII region: we possibly observe swept-up molecular material, arising from clumps eroded by ionizing gas from the compact HII region. Since the peak of 12CO J=21 and 13CO J=10 emission is not found at the position of IRAS 16362-4845, the double-peak 12CO J=21 emission features can probably not exclusively be explained by a symmetric expanding shell where the compact HII region created a cavity. This scenario is suggested by Urquhart et al. (urquhart04 (2004)) for explaining their CO observations at the position of IRAS source. A more complicated geometry with an embedded compact HII region and a dense molecular clump at the north-western border of the cavity is probably more likely.
| (1) | (2) | (3) | (4) | (5) | (6) | (7) | (8) | (9) | (10) | (11) |
| T(13CO) | T(12CO) | v | Tex | N(13CO) | N(H2) | Mass | n(H2) | r | ||
| [K] | [K] | [km s-1] | [K] | [1017 cm-2] | [1021 cm-2] | [M⊙] | [103 cm-3] | [pc] | ||
| IRAS 16362-4845 | ||||||||||
| Core | 12.2 | 30.1 | –24.5 | 35.5 | 0.47 | 1.5 | 70 | 187 | 90.0 | 0.12 |
| Whole cloud | 2.0 | 10.0 | –24.5 | 15.0 | 0.19 | 0.8 | 39 | 8000 | 3.9 | 1.62 |
| Cloud Ea | 6.3b | –23.4 | 9.5 | 3900 | 4.4 | 3.56 | ||||
| Cloud 78c | 6.7 | –22.5 | 0.52 | 25 | 4700 | 1.4 | ||||
| NGC 6193 | ||||||||||
| Whole cloud | 2.0 | 8.6 | –16.5 | 13.6 | 0.22 | 0.4 | 18 | 660 | 4.5 | 0.66 |
| Cloud Oa | 2.4b | –17.5 | 5.6 | 540 | 0.09 | 5.7 |
3.2.2 Channel Maps
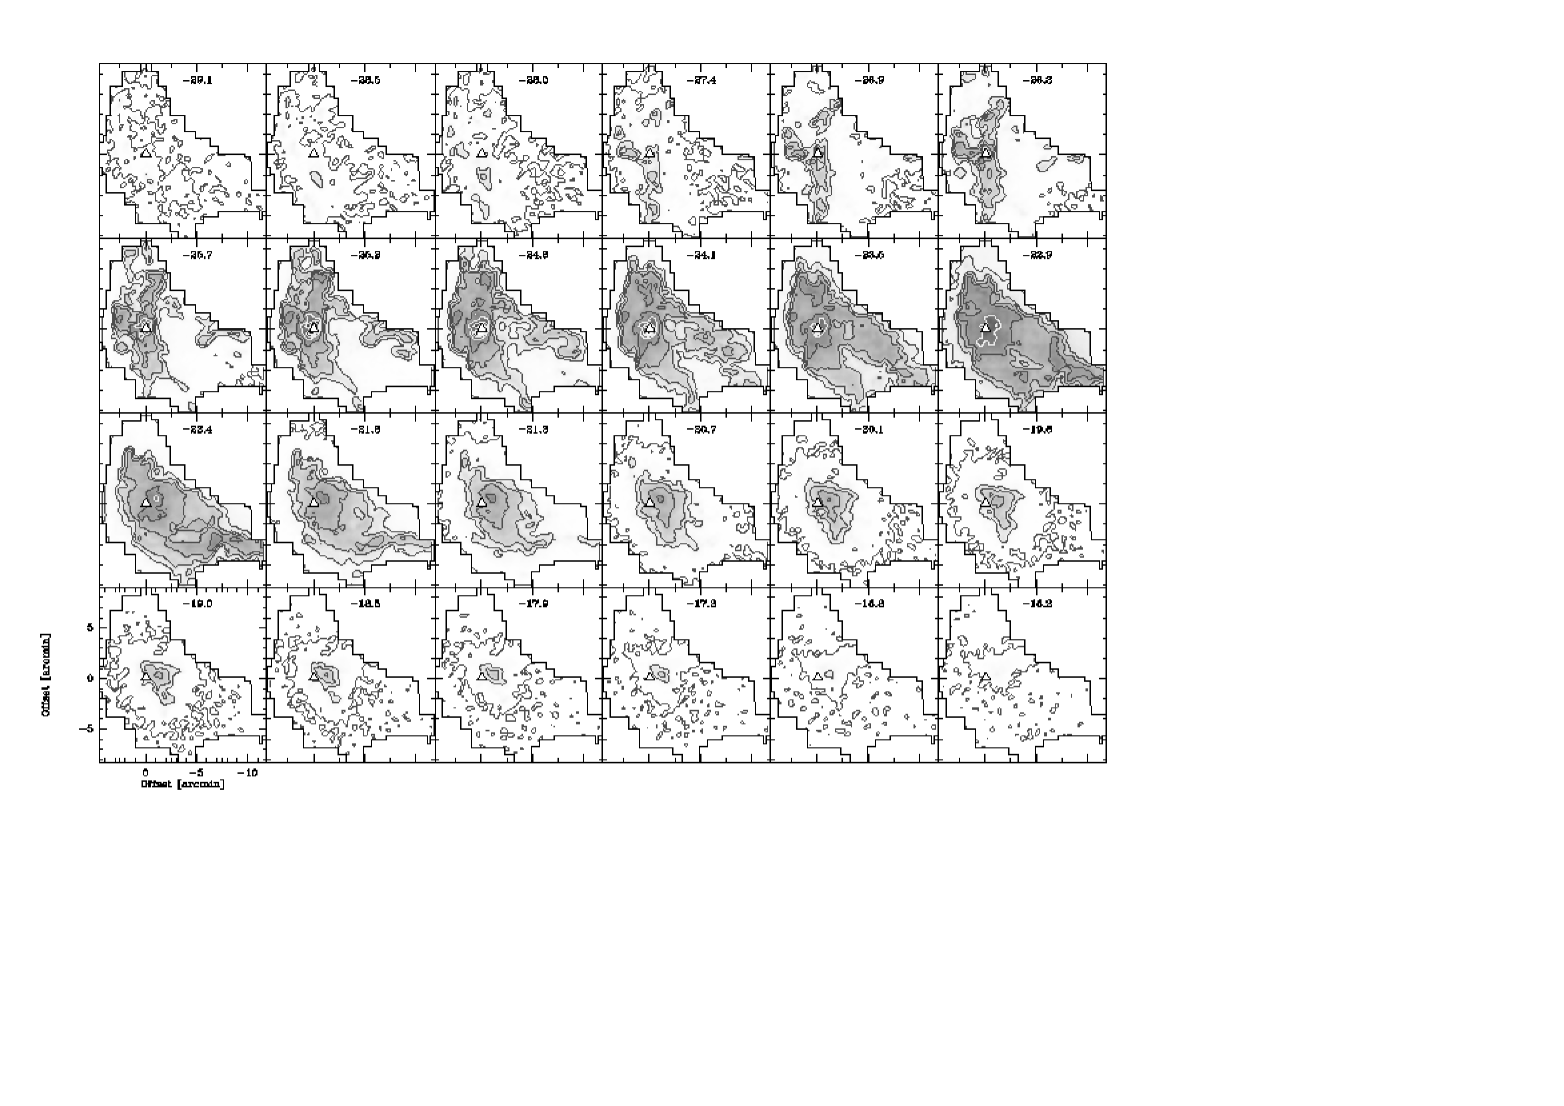
Eastern Cloud – NGC 6193
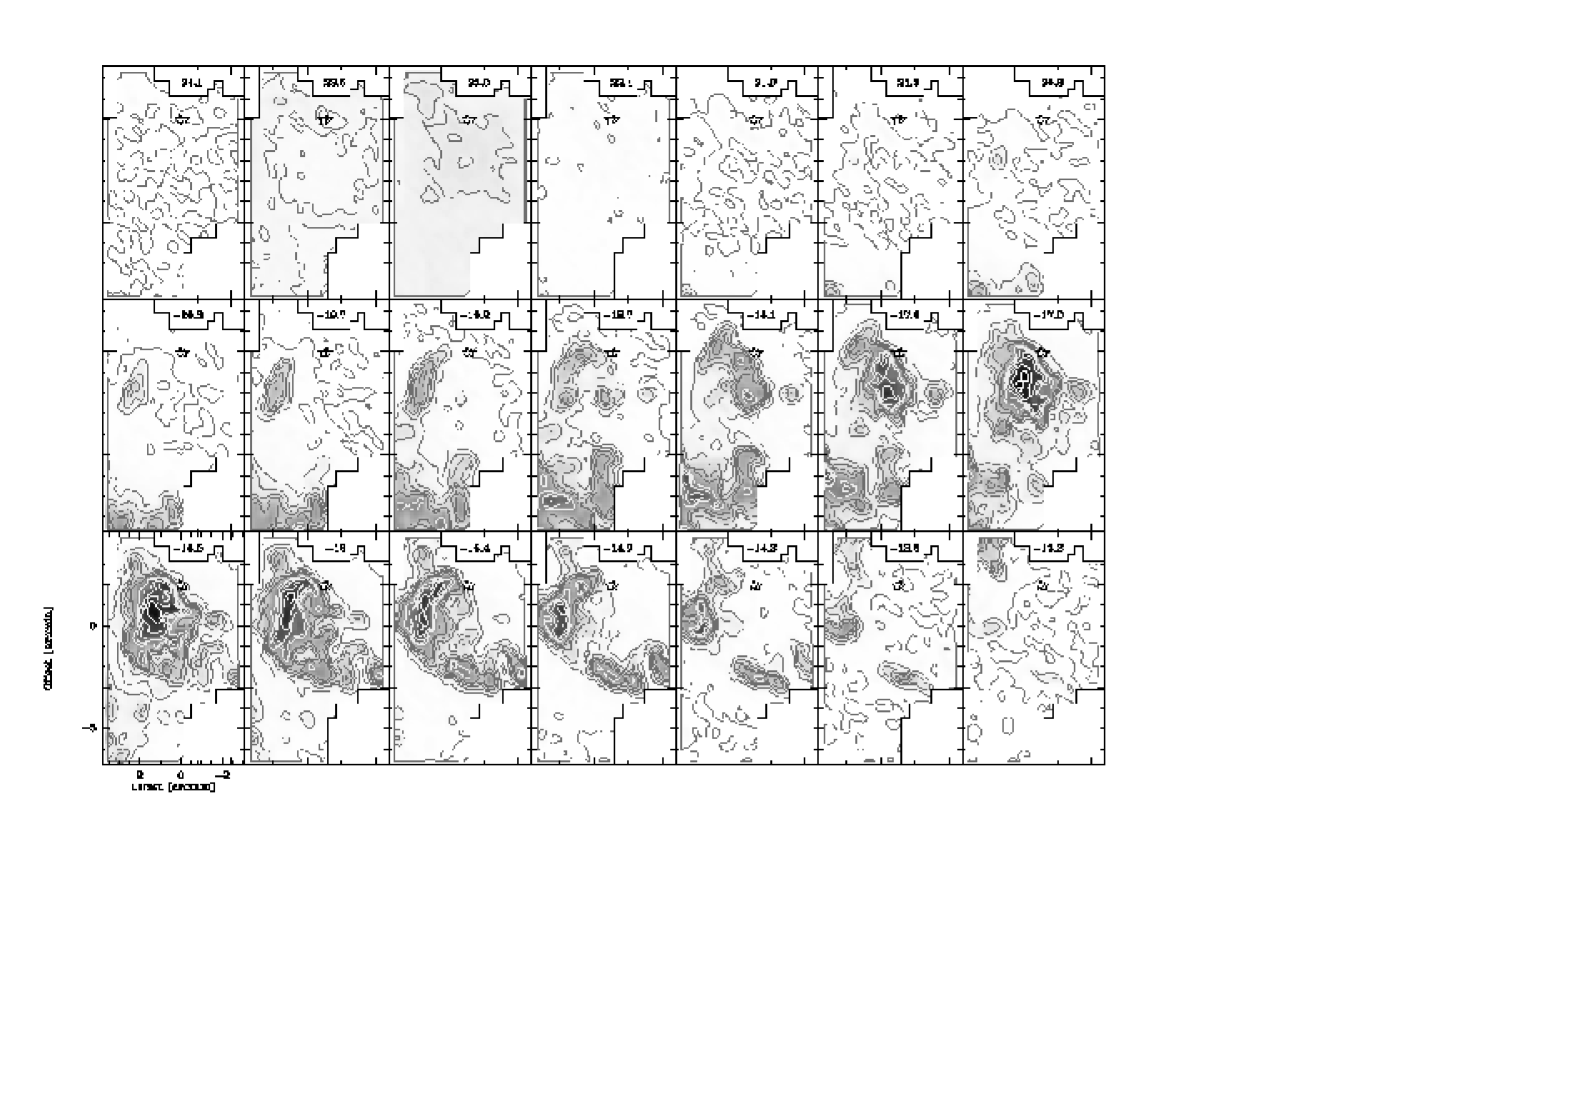
Figure 4 shows a series of velocity channels of 12CO J=21 (13CO J=10 ) emission around NGC 6193. While the emission distribution of 12CO J=21 (top) is highly fragmented and dispersed in all velocity ranges, the 13CO J=10 emission (bottom) focusses mainly on a single region close to the pair of O stars in a rather narrow velocity range (18 to 15 km s-1). However, there is a clear morphological and kinematical coincidence between the most prominent structures visible in both molecular species. As can be seen in Fig. 4 in Arnal et al. (arnal03 (2003)), there are molecular clouds further south of our mapped region at velocities between 17.5 and 11.2 km s-1 which may constitute the remains of an initially more extended molecular cloud, now mostly disrupted by the NGC 6193 cluster.
The single –24 km s-1 velocity component visible in the spectra of Fig. 3 is prevalent across the whole map and looks rather unrelated to the bulk emission of the cloud which starts at –20 km s-1 and peaks at 17 km s-1. There is a clear velocity shift in 13CO J=10 emission (which is less easily recognized in 12CO J=21 ) in this region which becomes even more obvious in a position-velocity plot shown in Fig. 6. This cut at constant declination (offset 1.′5) shows that the velocity decreases from 16 km s-1 to 18 km s-1 from east to west. The physical interpretation of this gradient is not unambiguous. If caused by solid-body rotation of the cloud, in which the cloud itself is continuous and turns around the O stars whose wind/radiation created a hole around them, the velocity gradient of 1.3 km s-1 across 1′ would indicate a period of 1.7107 yr, which is in the same order of magnitude like the one for the Rosette Molecular Cloud (3.1107 yr, Blitz and Thaddeus blitz80 (1980)) or the Orion Nebula (Kutner et al. kutner77 (1977)).
Expansion powered by the energetic output to the massive stars in NGC 6193 provides an alternative explanation to the observed structure and kinematics of this cloud, already suggested by Phillips et al. (phillips86 (1986)) and Yamaguchi et al. (yamaguchi99 (1999)). In this interpretation the arc-shaped peak most clearly seen in the and km s-1 12CO J=21 channel maps of Fig. 4 would be part of the rim of an expanding shell containing HD 150135/150136 within its contour, whereas the peak close to the positions of those stars and having a somewhat more negative velocity ( km s-1) would be part of the shell hemisphere located in front of the stars and moving towards us. Difficulties with this interpretation may be however indicated by a comparison of the momentum of the shell and the the momentum injected by the winds of the O stars on their surroundings during their lifetimes. The momentum of the cloud can be estimated by taking the velocity difference between the proposed frontal feature of the shell and the rim ( km s-1) and multiplying it by our mass estimate of the cloud (660 M⊙; see Section 3.2.3). For the stellar winds, we adopt typical mass loss rates ( M⊙ yr-1), terminal velocities ( km s-1), and an age of yr (Vázquez & Feinstein vazquez92 (1992)). The momentum contained in the expanding shell turns out to be greater than that injected by the stars by about one order of magnitude. The actual difference is probably greater, since the currently derived 660 M⊙ seem to be only the remnants of a larger, now mostly dispersed cloud. On the other hand it is also possible to invoke particular density distributions that may improve the agreement in our comparison, as would be the case if the proposed rim were actually a high density ridge expanding at a lower speed than the layer of gas moving towards us along the line of sight. Unfortunately, the fragmentary nature of the cloud and the tentative character of the interpretation of the structures identified in it prevent us from deciding between both outlined possibilities.
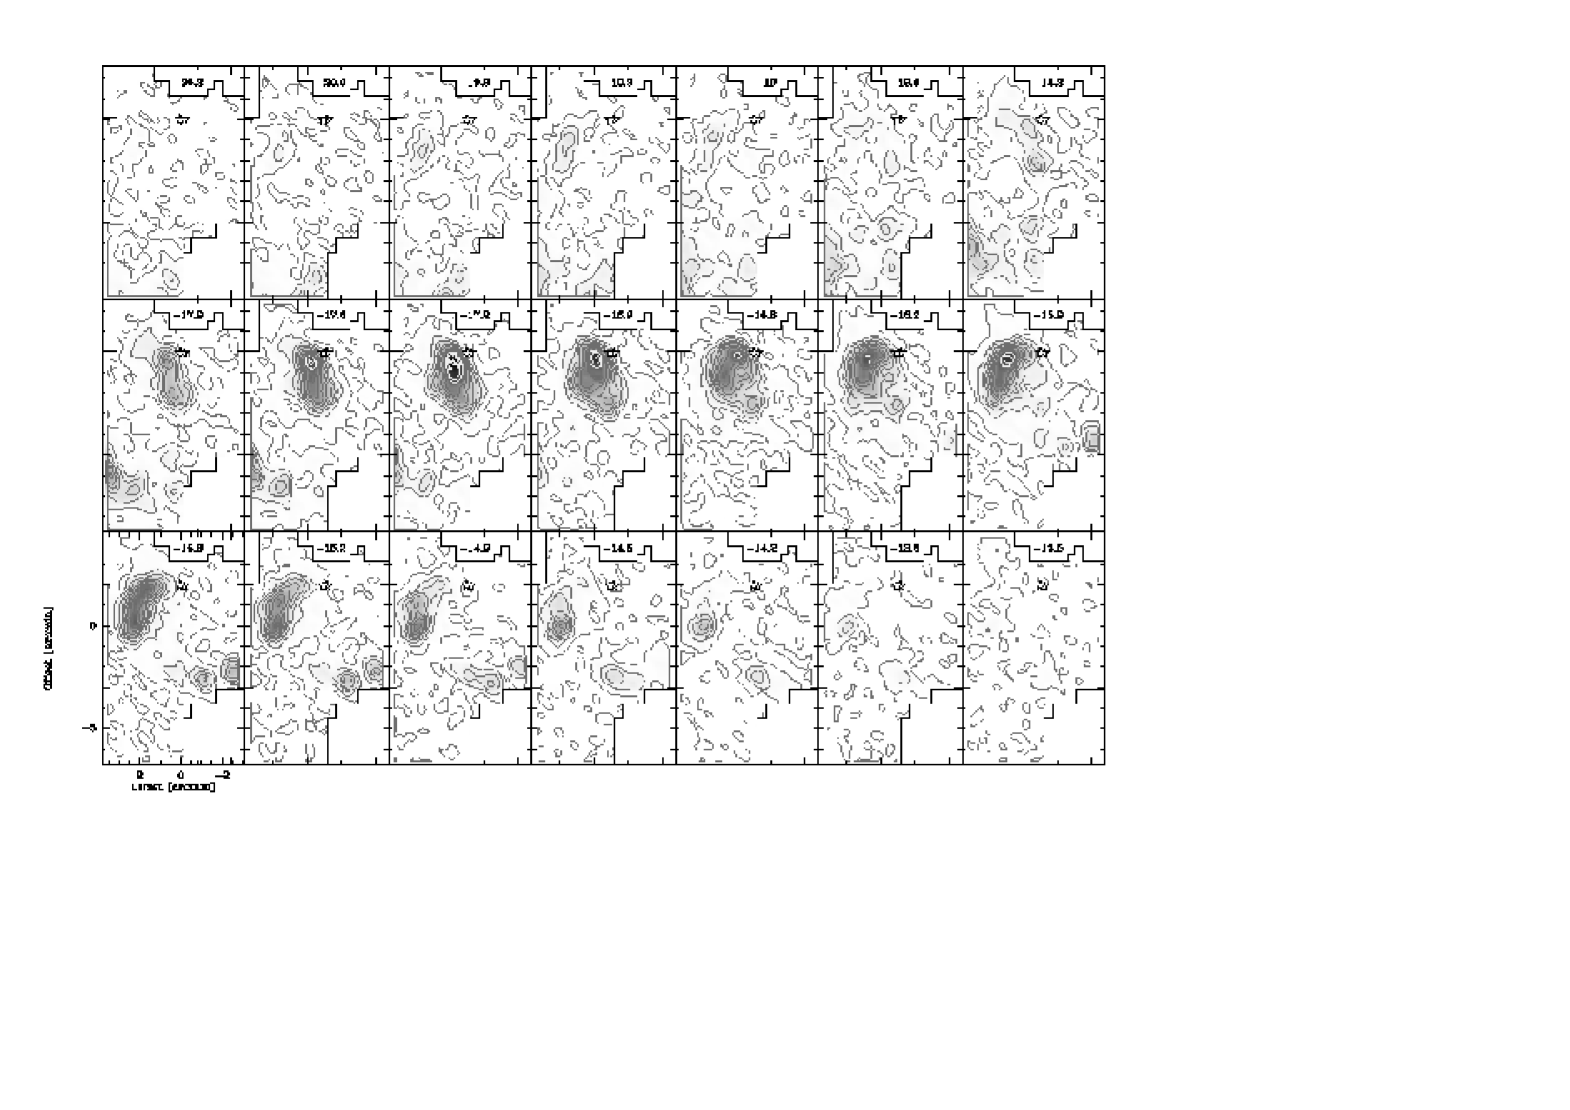
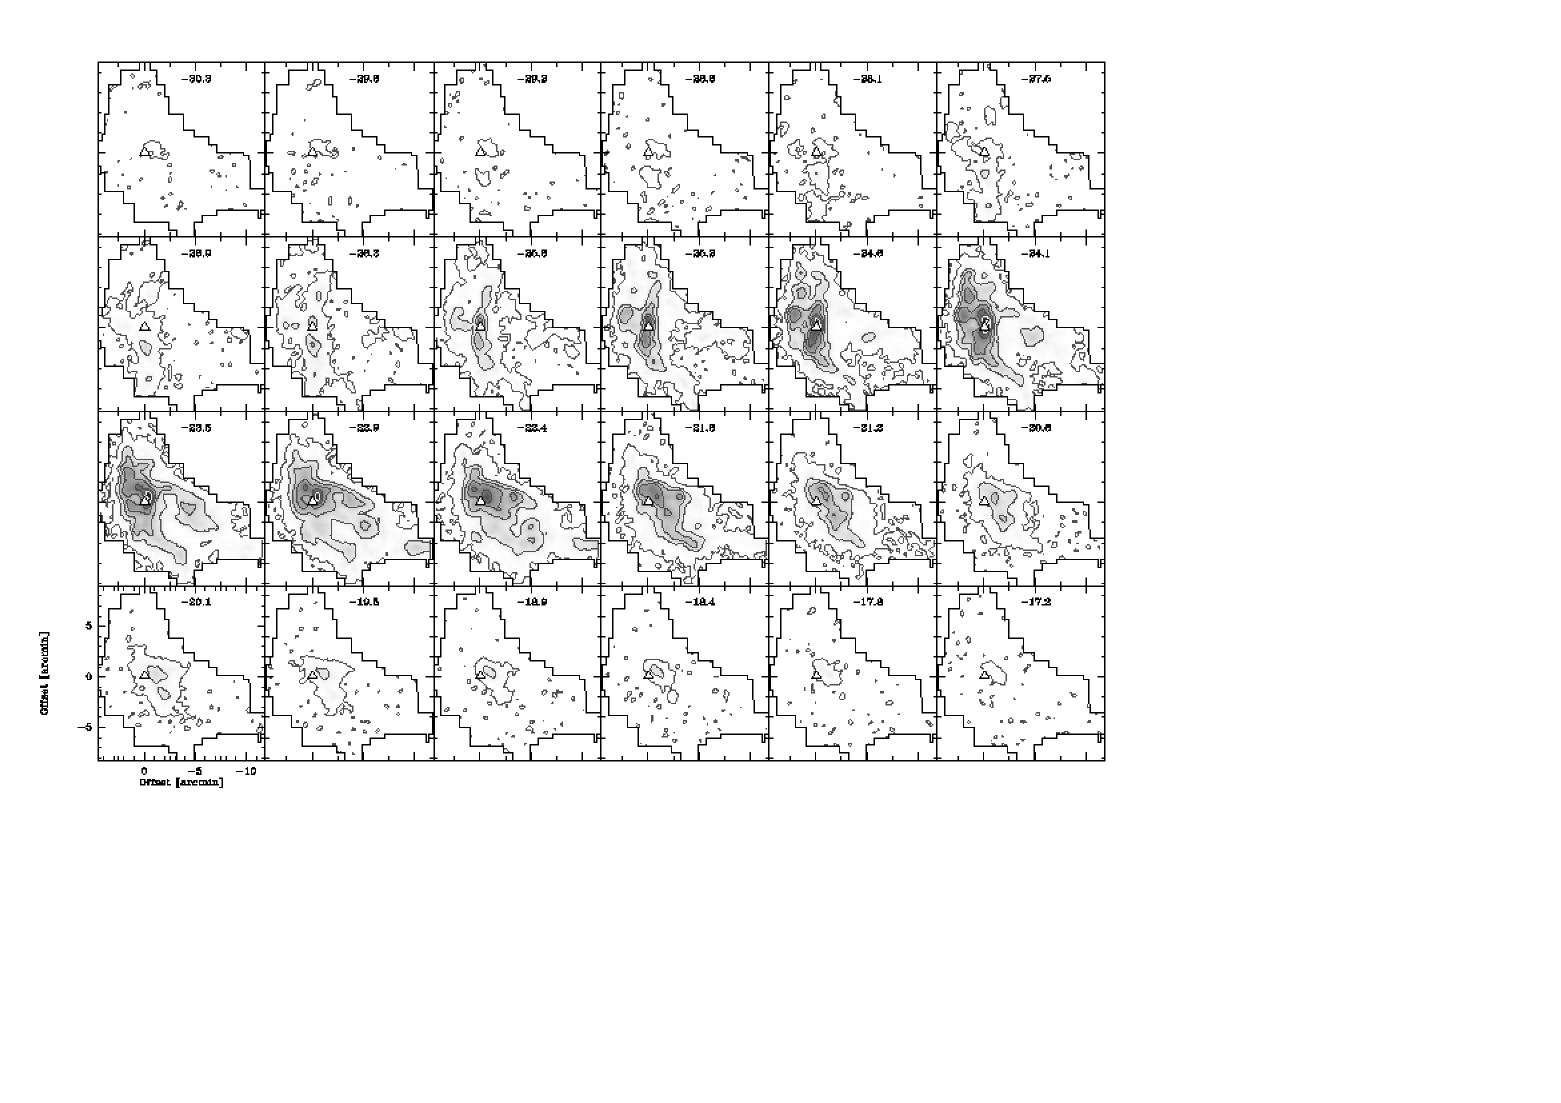
Western Cloud – IRAS 16362-4845
The channel maps of the molecular cloud west of the bright rim
(Fig. 5) show two prominent features, firstly a sharp
gradient in 12CO J=21 and 13CO J=10 line intensity at the interface region to
the rim, and secondly a pronounced peak of both, 12CO J=21 and 13CO J=10 emission close to the location of IRAS 16362-4845 (marked as a
triangle in the figure). Apart of these morphological elements the
western molecular cloud is not as strongly fragmented as the
eastern one. The main features of the molecular gas that we
identify near the position of the compact HII region are in
general coincident with those discussed by Urquhart et
al. (urquhart04 (2004)). However, the greater extension of our
mapped area and the somewhat improved sensitivity in the
line allow us to carry our a more
comprehensive discussion on the structure and kinematics of the
surrounding regions as well.
The HII region NGC 6188 and the molecular cloud are in direct contact in the velocity range –25 to –23 km s-1 where we see a sharp gradient in CO intensity at the interface. Towards higher velocities the interface region moves westwards and CO emission is only found close to the IRAS source. However, low intensity emission – best visible in the 12CO J=21 map – remains across the whole mapping area. 12CO J=21 and 13CO J=10 peak emission is directly associated with IRAS 16362-4845 only in the velocity range –26 km s-1 to –23.5 km s-1. There, we find 13CO column densities (N(13CO)=1.51017 cm-2) at a moderate optical depth (=0.8). Towards higher velocities, the region of peak emission moves north-west and is displaced by 40–60′′ with regard to the IRAS source. This core region is projected over a plateau of lower intensity widespread 12CO J=21 emission. This lower column density material is not visible in 13CO J=10 where the region of peak emission is more extended but also more clearly defined. We do not see a clear outflow signature in the 12CO J=21 channel maps (see Sec. 3.2.1 for a discussion of the spectra) though a bipolar structure with a blue component (–27.4 to –26.3 km s-1) east of IRAS 16362-4845 and a more prominent red component (–21.8 to –16.8 km s-1) on the western side can possibly be identified. Higher angular resolution should clarify to which extend this emission is due to YSO. So far we attribute the redshifted high-velocity molecular gas to another molecular cloud fragment which is eroded by the ionizing gas of the compact HII region forming IRAS 16362-4845.
The morphological relationship between the molecular gas mapped in this region and the structures seen in visible and near-infrared images is obvious. In addition to the noted correspondence between IRAS 16362-4845, its associated stellar aggregate revealed by the infrared images (Section 3.4), and the peak in molecular emission intensity, the rim nebula corresponds to a steep gradient in molecular gas density indicating that the molecular gas is dynamically influenced by the presence of the ionization front directly ahead of it. The associated shock front propagating into the cloud is best visible for 13CO J=10 at km s-1. Further west, the CO emission distribution is more elongated and looks like streaming away from the front at velocities –24.6 to –21.3 km s-1.
3.2.3 Physical properties of the molecular clouds
Table 1 gives an overview of the physical conditions of the bulk emission of the molecular clouds derived from our 12CO J=21 and 13CO J=10 SEST observations and in comparison with values from the literature.
The excitation temperature was calculated by assuming an optically thick 12CO line so that the radiative transfer equation simplifies to [K] with the line temperature T(12CO) [K] determined with an Gaussian fit to the observed line. The 13CO line was assumed to be optically thin and the opacity is then given by with the line temperature T(13CO) [K] equally determined with an Gaussian fit. We assume LTE so that the excitation temperatures for 12CO and 13CO are equal. With the line integrated 13CO J=10 intensity W(13CO) [K km s-1] over different areas (see Table 1), the 13CO column density is given by (Frerking et al. frerking82 (1982)) with a value of of 0.87, 1.06 and 1.87 at an excitation temperature of 10, 15 and 35 K. The H2 column densities are then calculated using the 13CO column density with (Dickman dickman78 (1978)). The masses were determined by with the distance of the cloud in parsec (1300 pc) and the areal extent in square degrees. The average H2 density is evaluated by assuming a slab with a column of the length 2 Radius.
For the western cloud, we distinguish two different areas: the cloud core correlated with IRAS 16362-4845 is covered by approximately one beam in 13CO J=10 and the whole cloud is defined by the 5 level of the observations (essentially all emission visible in Fig. 3). The latter compares best with the literature values. The molecular core extends over 0.24 pc which is approximately the same size as for the embedded compact HII region plus halo (Sec. 3.1). The extinction given by the H2 column density is very high (), and when compared to the extinctions derived from the stellar infrared colors (Section 3.4) it suggests that the embedded aggregate lies roughly between the edge of the cloud facing us and the center of the absorbing column of gas and dust in its direction. The volume density is high (9104 cm-3) indicating the existence of a large reservoir of dense molecular gas. The cloud core mass is 200 M⊙, which is similar to the stellar mass of the whole aggregate (Section 3.4). The whole cloud has a mass of 8000 M⊙ which is approximately two times larger than the masses derived by Arnal et al. (arnal03 (2003)) while the area is two times smaller. However, their observations are strongly affected by beam dilution (8′.7 angular resolution) and 12CO 10 was used for the mass estimate which may explain the differences in masses. Yamaguchi et al. (yamaguchi99 (1999)) also use 13CO J=10 as a mass tracer and obtain a larger total cloud mass though at lower average densities.
For the eastern cloud, we determined the cloud properties for the region of strongest 13CO J=10 emission visible in Fig. 4 in the velocity range –18 to –14 km s-1. While the optical depth (0.2) is very similar in comparison to the western cloud, the 13CO – and accordingly H2 – column densities are smaller. The gas is not as dense ( cm-3) as for IRAS 16362-4845 and the total mass (660 M⊙) is much lower than for the western cloud. Also the extinction on the background, , is much lower than in the western cloud. All that, together with its more fragmentary morphology, points towards a more evolved molecular cloud which constitutes now remnant material.
3.3 The kinematics of the ionized gas
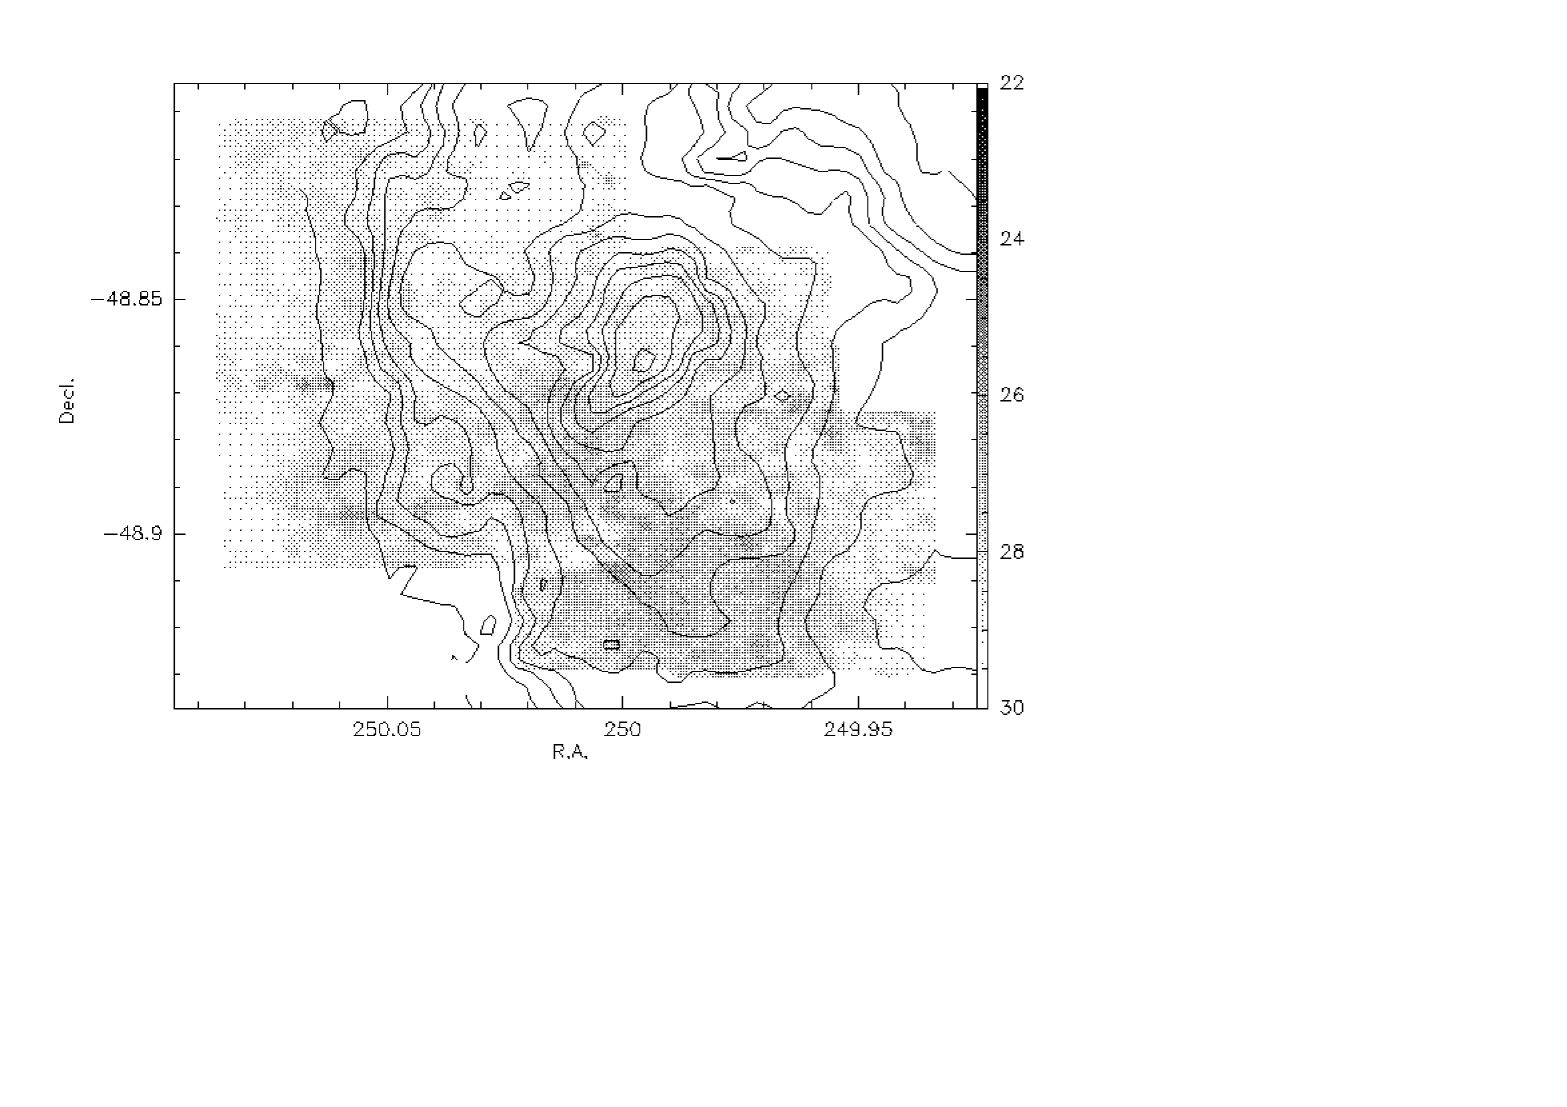
The continuous H information over the observed field (Figure 7) allows us to produce maps of the ionized gas velocity, line width and intensity (Figure 8). It was always possible to fit the observed profiles by a single Gaussian.
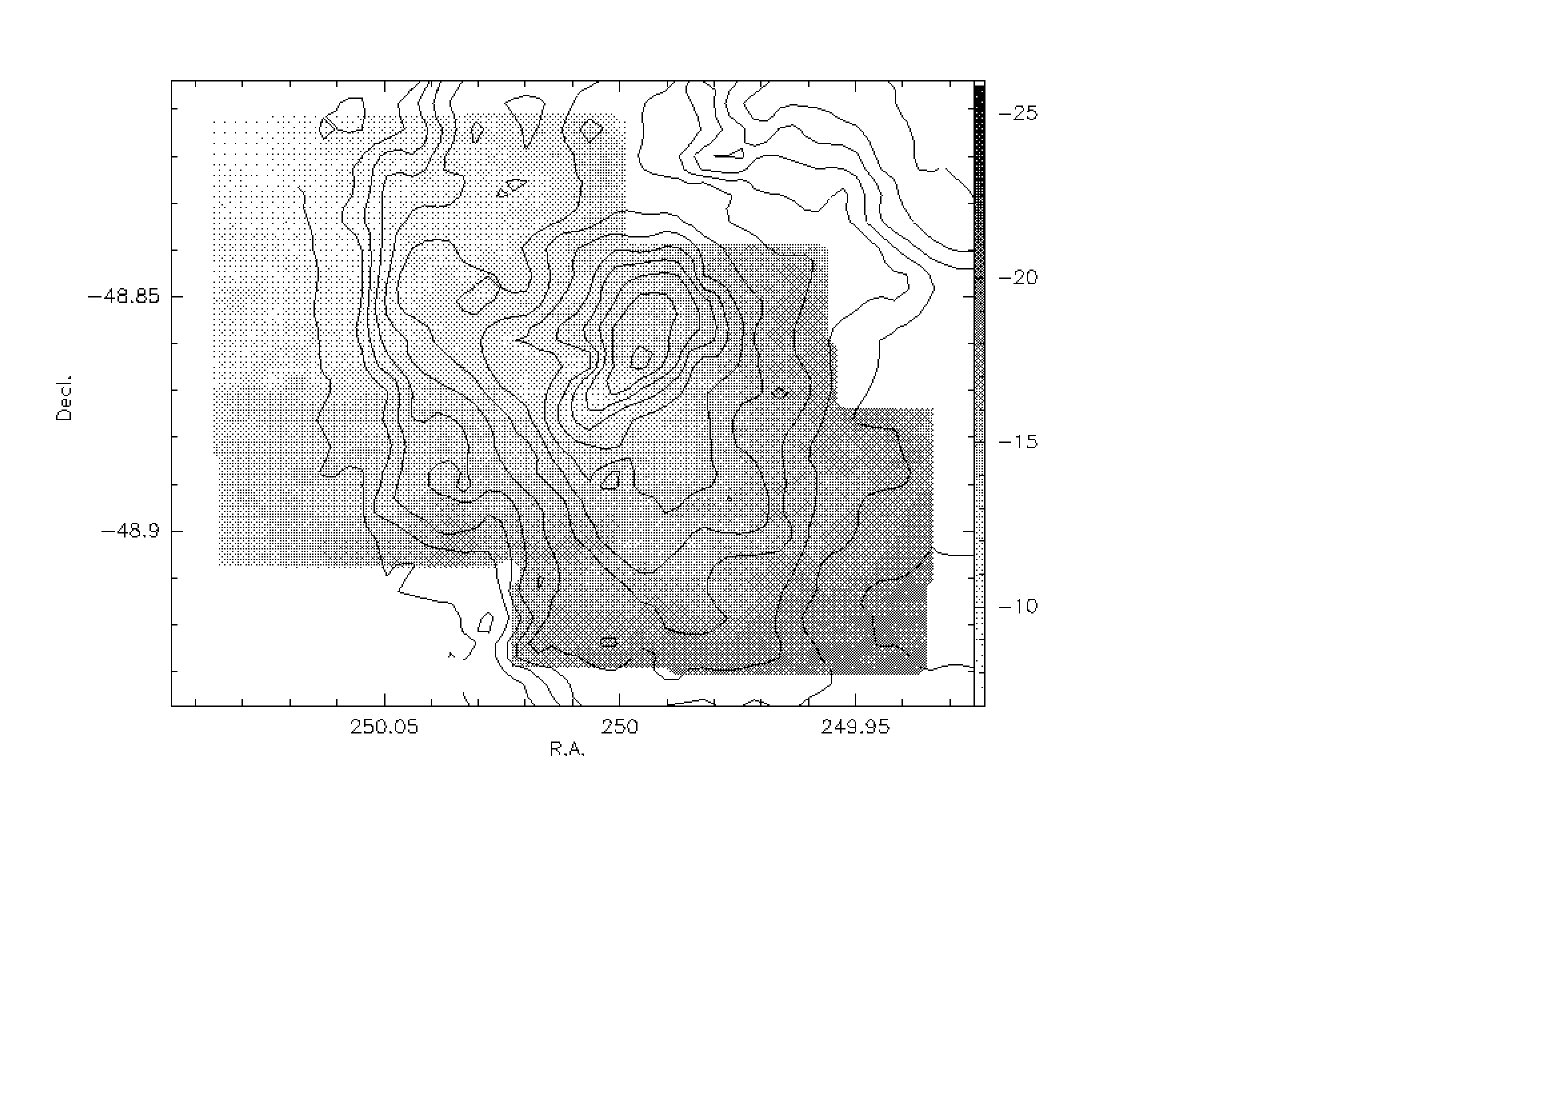
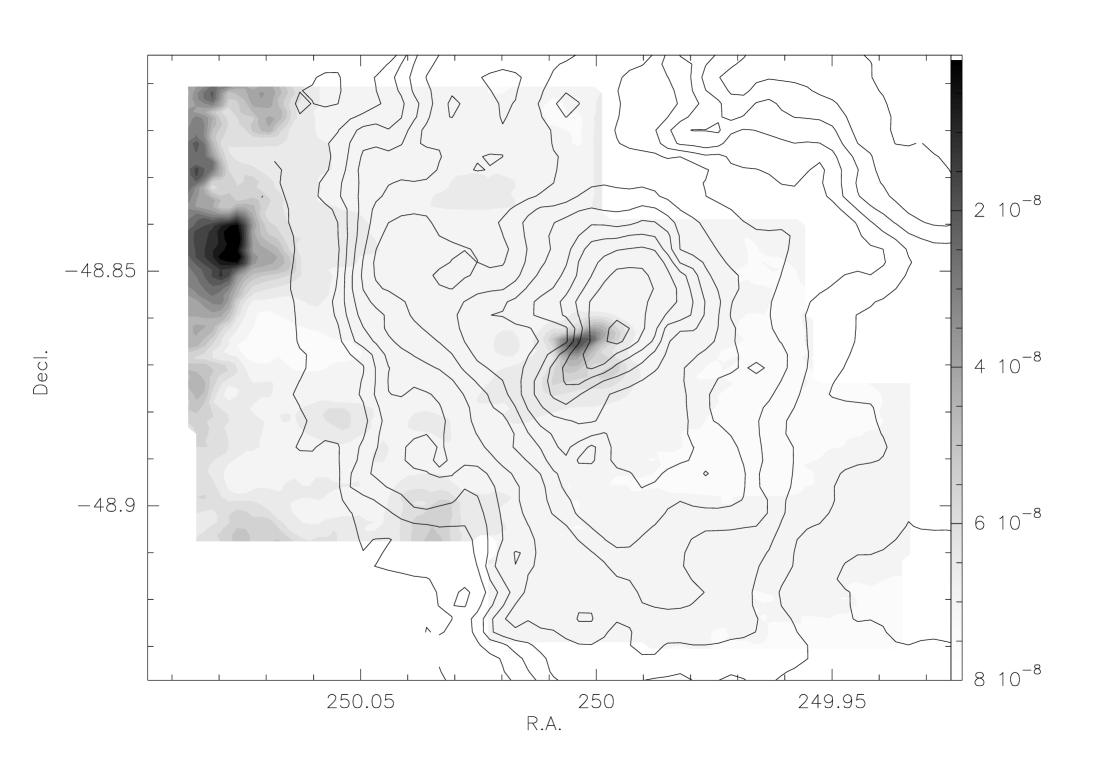
The intensity map (Fig. 8, bottom) clearly shows two major features, the bright rim in the west and the compact HII region in the map center. More diffuse emission is present in the rest of the field. The compact HII region appears displaced from the peak of the CO cloud. However we can note that it is located where CO isocontours are distorded looking like a cavity from where the ionized gas can expand. This is a clear indication of the interaction between the HII region and its parental molecular cloud.
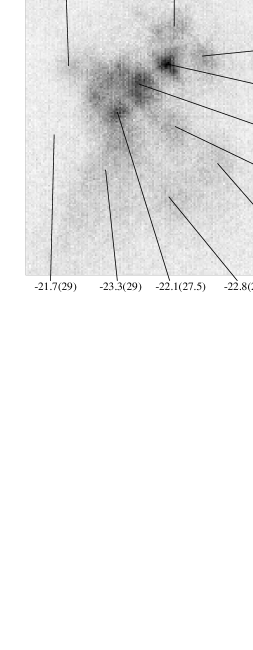
As already mentioned section 3.1., the compact HII region is very patchy and slightly elongated in South-East direction (Figure 9). Integrated over the whole compact HII region the H profile gives a systemic velocity of km s-1 (FWHM 27.5 km s-1). A detailed analysis of the different patches highlights a small velocity variation in the same South-East direction with velocities from –17.8 to –23.3 km s-1. The brightest clump has a velocity of –19 km s-1 (FWHM 29 km s-1). In the direction of the opaque dust lane the H velocity is also –21.7 km s-1. The bulge of CO emission emission at –24.5 km s-1 can be associated to the extended emission of the HII region while the H patches can be counterparts of the bumps around –20 km s-1 seen in the CO profile. This can be interpreted as dense clumps externally ionized and photoevaporated. It is consistent with the conclusion inferred from the infrared images where the core of the compact HII region is deeply embedded in the molecular cloud and only the external, less obscured parts are revealed in the visible.
The line width of the ionized gas (Fig. 8, middle) shows a small and marginally significant increase at the location of the sharp edge of the molecular cloud (25 km s-1) while towards the West and East the width is around 23 km s-1. This trend is probably due to the presence of the ionization front. Elsewhere in the mapped area and farther from the ioniation front, the mean width is 27 km s-1. The line width is the combination of two factors, thermal gas motions and turbulence. A typical HII region temperature of 10000 K gives a thermal FWHM of 21.4 km s-1. If we interpret the width broadening by the turbulence this leads to a velocity dispersion between 8.5 and 16.5 km s-1. Systematic velocity dispersion trends and variations were already reported in other HII regions (e.g. Godbout godbout97 (1997) and references therein).
Finally, a clear large-scale velocity gradient (Fig. 8, top) is visible. From velocities of –25 km s-1 in the North-East part of the map, we go up to about –11 km s-1 in the South-West part with a mean velocity –16.24.3 km s-1. This gradient points towards NGC 6193 confirming that it is the ionizing source. A streaming motion of gas toward us can be excluded because such motion would imply a velocity gradient with decreasing velocities. The velocities at the ionization front up to the compact HII region are in good agreement with the CO velocities. The H emission at these velocities certainly comes from the direct interaction between the ionizing flux and the western molecular cloud.
The higher velocities correspond to more diffuse and fainter H emission except the structure around , (–14 km s-1) which is quite intense. The Western cloud does not show similar velocities but such velocities are noted for the Eastern cloud ( –15 km s-1). In parallel, Arnal et al. (arnal03 (2003)) detected molecular clouds further south at velocities between 17.5 and 11.2 km s-1 which are supposed to be remains of an initially more extended molecular cloud, now mostly disrupted by the NGC 6193 cluster. Hence the H emission at velocities between –16 and –11 km s-1 is probably the ionized counterpart of this initial parental cloud. However due to the limited extension of the H data it is not possible to arrive to definite conclusions.
3.4 The ionizing aggregate of IRAS 16362-4845
The stellar component of IRAS 16362-4845 is revealed by the images, where a tight aggregate of stars emerges at the center of the compact HII region. As noted in Section 3.2.3 the aggregate approximately coincides in position with the peak in column density of molecular gas, which causes an extinction on the background of (or ), thus ruling out that it may be actually composed of background stars seen through the cloud.
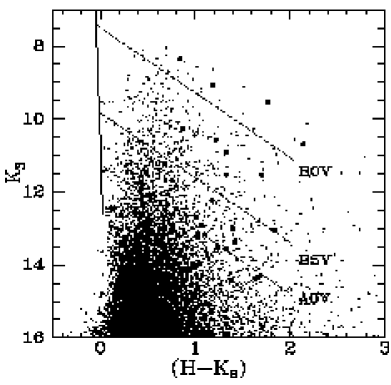
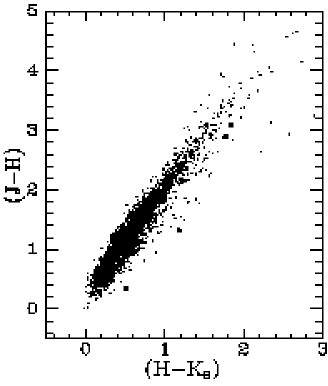
The color-magnitude and color-color diagrams are useful tools in examining the membership, rough spectral types, and possible existence of infrared excess of the stars that appear projected on the nebula. The color-color diagram of the aggregate at the core of the HII region and its surroundings has been discussed by Urquhart et al. (urquhart04 (2004)), who have identified several infrared-excess objects based on 2MASS data. Our SOFI data reach over two magnitudes deeper, have a better linear resolution by a factor of at least two, and oversample the PSF area. Therefore, they allow us to obtain a much more detailed view of the stellar contents of the aggregate. Both the color-magnitude and color-color diagrams are presented in Figures 10 and 11 for the entire catalog of objects detected in our near infrared mosaic of the region, with the objects projected on the central ( pc pc) of the infrared nebula marked with full circles. The position of the members of the aggregate in the color-magnitude diagram shows that the brightest stars seem to have late O types, and are accompanied by several early B-type stars. The tightest concentration occurs in a small cluster precisely at the position of IRAS 16362-4845, and occupies a projected area approximately across (0.05 pc). Judging from their colors they are reddened by widely varying amounts ranging from to or perhaps (depending on whether the reddest star is a true member of the cluster or rather a background star; see discussion below), using the Rieke & Lebofsky (rieke85 (1985)) extinction law and assuming essentially zero intrinsic colors. The compactness of the aggregate and its stellar contents are reminiscent of a Trapezium-like cluster. Other stars having colors in that same range are visible at some distance from the central cluster but still within the confines of the compact HII region.
| Number | Notes | ||||||
|---|---|---|---|---|---|---|---|
| 1 | 16:39:58.4 | -48:51:45 | 12.931 | 2.137 | 1.080 | 17.3 | B5-A0, no excess |
| 2 | 16:39:58.6 | -48:52:05 | 10.568 | 2.163 | 1.217 | B0-B5, slight excess | |
| 3 | 16:39:58.8 | -48:51:59 | 14.363 | - | 1.637 | later than A0 | |
| 4 | 16:39:59.0 | -48:51:34 | 13.044 | 3.078 | 1.831 | B5 or somewhat earlier, slight excess | |
| 5 | 16:39:59.6 | -48:51:37 | 10.679 | - | 2.144 | late O, or perhaps background | |
| 6 | 16:39:59.7 | -48:51:56 | 14.030 | - | - | most probably B5-A0 | |
| 7 | 16:39:59.8 | -48:52:00 | 12.236 | 2.370 | 1.179 | 18.9 | B5-A0, no excess |
| 8 | 16:39:59.8 | -48:51:39 | 12.092 | 0.345 | 0.508 | possible excess; later than A0 | |
| 9 | 16:40:00.0 | -48:51:53 | 11.230 | 1.136 | 0.673 | 10.9 | B5-A0, no excess |
| 10 | 16:40:00.1 | -48:51:42 | 10.907 | - | 1.324 | B0-B5 | |
| 11 | 16:40:00.1 | -48:51:45 | 12.701 | - | 1.008 | B5-A0 | |
| 12 | 16:40:00.2 | -48:51:40 | 8.356 | 1.674 | 0.842 | 14.0 | late O, no excess |
| 13 | 16:40:00.3 | -48:51:59 | 12.449 | 0.520 | 0.124 | probably foreground; in any case, later than A0 | |
| 14 | 16:40:00.3 | -48:51:56 | 13.528 | - | 1.247 | A0 | |
| 15 | 16:40:00.4 | -48:51:46 | 13.001 | - | 1.400 | B5-A0 | |
| 16 | 16:40:00.4 | -48:51:43 | 10.276 | 1.921 | 0.872 | 14.0 | B0-B5, no excess, CO and Br in the spectrum |
| 17 | 16:40:00.9 | -48:51:39 | 11.537 | - | 1.702 | B0-B5 | |
| 18 | 16:40:01.2 | -48:51:52 | 9.074 | 1.320 | 1.181 | probably earlier than B0, but strong excess | |
| 19 | 16:40:01.3 | -48:51:45 | 11.525 | 2.617 | 1.329 | 21.3 | B0-B5, no excess |
| 20 | 16:40:01.6 | -48:51:48 | 9.529 | 2.882 | 1.765 | 28.7 | late O, perhaps slight excess; background? |
| 21 | 16:40:01.7 | -48:51:41 | 14.318 | - | 1.682 | somewhat later than A0 | |
| 22 | 16:40:01.7 | -48:51:53 | 12.451 | 1.772 | 0.793 | 12.8 | B5-A0, no excess |
| 23 | 16:40:01.8 | -48:51:39 | 13.379 | - | 1.415 | B5-A0 | |
| 24 | 16:40:01.9 | -48:51:48 | 13.567 | - | 1.332 | B5-A0 | |
| 25 | 16:40:02.2 | -48:51:55 | 14.436 | - | 1.383 | later than A0 |
1: Extinction estimate using Rieke & Lebofsky (rieke85 (1985)) extinction law and the color index. The value is given only for stars having measurements whose positions in the color-color diagram indicates no infrared excess. Intrinsic colors and are assumed for O stars and stars in the B5-A0 range, respectively.
3.4.1 Individual members
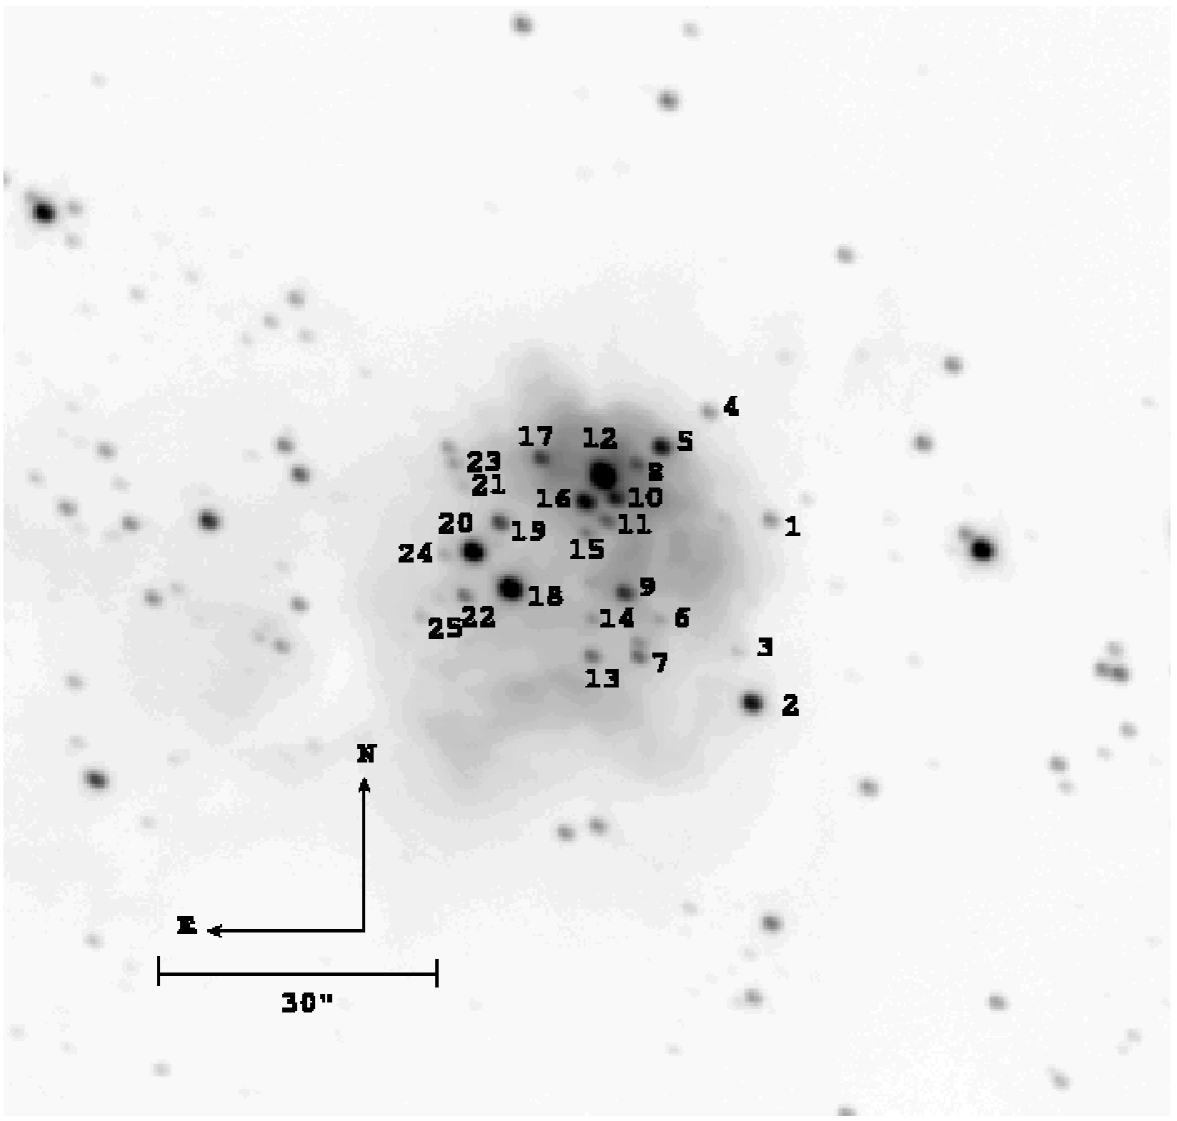
The census of stars in the central pc2 of the HII region is given in Table 2, and plotted in Figure 12. Some of these stars may be either foreground or background, and thus unrelated to RCW 108. In particular we consider Star 13, with blue colors, as a very likely foreground source. In principle we also would be inclined to consider as a foreground source Star 8, the one that appears brightly in visible images nearly coincident with the position of IRAS 16362-4845. However, its is much redder than expected given the color, hinting at the existence of a near infrared excess indicative of youth and thus possible aggregate membership. Its position in the ) diagram indicates that it is unlikely to have a spectral type earlier than A0, as confirmed by its visible spectrum, dominated by Balmer lines and by the CaII H and K lines. Still near the cluster core, Star 5 has and magnitudes consistent with a late O type. We note however that its color implies an extinction in its direction if entirely due to foreground reddening, which would be one of the highest found among the objects in the whole field, although only half that inferred from molecular-line observations. Unfortunately, the star is too obscured for its magnitude to be measurable and no infrared spectrum is available for us to decide on the actual membership of this star.
Star 12 seems to play the main role in ionizing the IRAS 16362-4845 nebula, judging from its central position at the core of the nebula and its magnitude. Its photometry is in agreement with the late-O spectral type that is expected from the excitation characteristics of the nebula (Section 3.5). The fact that IRAS 16362-4845 contains a tight cluster rather than a single star explains the discrepancy between the Lyman continuum flux and the luminosity derived from far-infrared data pointed out by Straw et al. (straw87 (1987)). Star 12 is detected in visible-red images of the region as a very red object next to Star 8, which dominates at visible wavelengths. The visible spectrum of Star 12 shows only a steep rise towards the red but no features, and is severely contaminated by the nebula at the position of H and other strong nebular lines. The 1.5-2.4 m spectrum, shown in Figure 13, is also mostly featureless as expected from a late O star. The hint of Br weakly in absorption must be taken with caution, as it may be an artifact due to small-scale structure in brightness of the nebula affecting the subtraction of the nebular lines from the spectrum of the star. However we note that the subtraction process removes well the HeI (2.058 m) line, whose intensity in the nebula is similar to that of Br (Section 3.5), leading us to favor the interpretation of the Br absorption as a real feature in the photosphere of the star. Moreover, its strength is consistent with that expected for a late-O spectral type (Hanson et al. hanson96 (1996)).

It is interesting to note the possible existence of two faint emission lines in the spectrum of Star 12 at m and m. Despite the increased sky thermal background on the long-wavelength end of the band the quality of the spectrum of Star 12 seems to be sufficiently good at the position of these two lines, especially at 2.314 m. We have attempted several slightly differing reductions of the spectra, by choosing different background subtraction apertures and by excluding each one of the four spectra obtained at a time, in order to ascertain the reality of the features, and in all cases we have recovered them. The position of the 2.314 m feature matches well that of a feature seen in evolved massive stars, such as WRA 751 (Morris et al. morris96 (1996)), where it is nevertheless accompanied by other, much stronger emission lines. On the other hand, the good subtraction of all other nebular lines suggests an origin in the photosphere or the wind of Star 12. Therefore it is unfortunate that we cannot offer an explanation for these features, and mention them here as a possible puzzle should better quality observations provide a definitive confirmation of their existence.

Star 16 is almost 2 mag fainter than nearby Star 12 but has similar colors, suggesting that both are embedded at similar depths in the cloud. Our infrared spectra had the slit oriented so as to contain both stars, and the resulting spectrum of Star 16 is shown in Figure 14. Examination of the frames containing the spectral trace convincingly shows that the prominent Br emission in the spectrum of Star 16 is related to it, and is not due to a poor subtraction of the nebular lines of the surrounding HII region. The spectrum also clearly shows the CO absorption bands starting at 2.29 m typical of cool atmospheres (e.g. Kleinmann & Hall kleinmann86 (1986)) and suggest that Star 16 might actually be a background cool star. However, the simultaneous appearance of both Br emission and CO absorption is frequent among young stellar objects surrounded by significant amounts of circumstellar gas and dust (Greene & Lada greene96 (1996)), which produce a much closer match to the spectrum of Star 16. Our data also hint at color variability of this source, as may be seen by comparing the spectra in Figures 13 and 14 with the photometry in Table 2. The imaging observations yield a redder color for Star 16 than for Star 12, while the slopes of their -band spectra, obtained three years later, show that Star 16 was slightly bluer than Star 12 in 2003.
The photometry of Stars 18 and 20 also suggests a spectral type earlier than B. Star 18 may indeed be a O-type star, but the strong infrared excess derived from its colors, already noted by Straw et al. (straw87 (1987)), indicates that a substantial fraction of the flux at may come from a disk, and that the central star may actually be of later type. In either case, the infrared excess can be taken as an indicator of its youth and thus of membership in the aggregate. The situation of Star 20 is less clear, as it displays a slight infrared excess at most, probably insufficient to explain its brightness at as dominated by circumstellar emission. Although it seems to be the intrinsically brightest star of the IRAS 16362-4845 aggregate, no obvious effects on the nebula are seen in its immediate surroundings, thus leaving open the possibility that it could be a background giant instead. We note however that the numerous giants seen in the whole field imaged in the infrared trace a well-defined reddening vector, from which Star 20 is detached by nearly 0.3 mag. The sense of the departure from the locus traced by giants is the same as observed in large-amplitude variables (e.g. Glass et al. glass95 (1995)). This possibility was considered also by Straw et al. (straw87 (1987)), whose low-resolution spectrum of Star 20 ( IRS 19 in their list) does show indeed CO absorption at 2.3 m. While considering it unlikely on absolute magnitude grounds that Star 20 could be a background giant or supergiant, they favored instead actual membership in the aggregate and considered possibilities such a T Tauri star or even a FU Ori object. Further infrared spectroscopy of this star should clarify its nature.
3.4.2 Stellar mass and density of the aggregate
It is possible to obtain a rough estimate of the stellar mass of the IRAS 16362-4845 aggregate by assuming that our images are sufficiently deep to record all the members with masses above a certain threshold, and then extrapolating the mass function to lower masses to account for the fainter, undetected members. Since the distribution of colors and magnitudes of stars in the aggregate plotted in Figure 10 suggests that there are practically no stars earlier than A0 that may have been missed by our survey (other than those that may be members of unresolved binary pairs), we will use the mass corresponding to that spectral type to derive the scaling factor of the mass function, for which we assume a log-normal Miller-Scalo form (Miller & Scalo miller79 (1979)). Table 2 indicates that there appear to be approximately 19 stars with spectral types A0 or earlier, among which we include Star 20 as a member but exclude Star 5 as a possible background star. The only star discarded as foreground, Star 13, should be later than A0 if it is actually an unobscured member of the aggregate and thus does not enter our census. Similarly, the lightly reddened Star 8 is excluded from the counting also due to its confirmed later spectral type. We adopt M⊙ for a A0 main sequence star from the compilation by Drilling & Landolt (drilling00 (2000)), noting that the spectral type-mass relationship may not be extended to later spectral types given that stars with lower masses take at least a few million years (5 Myr for a 2.5 M⊙ star; D’Antona & Mazitelli dantona94 (1994)) before reaching the main sequence.
The mass of the aggregate that we estimate in this way is M⊙, with a considerable uncertainty due to a number of reasons. Our assessment of which stars are members and which ones are foreground may be incorrect in some cases, thus altering the true census of aggregate members. Moreover, as we noted above, we have not made any corrections for unresolved binarity, which is known to affect a large fraction of massive stars (e.g. Garmany et al. garmany80 (1980)). Also, the scaling factor of the initial mass function is derived from its upper end, which is affected by small-number statistics, and some stars may appear above the A0 limiting line in Figure 10 because of the existence of -band excess. The evolutionary status of the aggregate may also affect our mass estimate in a manner similar to that described by Herbig & Terndrup (herbig86 (1986)) for the Trapezium cluster in Orion: the high brightness of some of the stars that we detect may be due to their pre-main sequence status rather than to their mass, resulting in luminosities higher than those of main-sequence stars of the same masses, leading to an overestimate of the number of massive members. This effect should not affect the most massive, O-type stars like Star 12, whose high temperature is confirmed by the spectrum of the HII region, as such stars have reached already the main sequence by the time that they become visible (Palla & Stahler palla90 (1990), Beech & Mitalas beech94 (1994)), but may result in a systematic overestimate of the mass of other cluster members and therefore of the cluster as a whole. Finally, we note that the aggregate seems to contain numerous stars of spectral type A0 and earlier with , but very few are found below this line, and none with bluer than other than the likely foreground Star 13. No bias in our observations can explain the lack of objects in the aggregate in this region of the color-magnitude diagram (which is well crowded for other parts of the field), and we can only explain it as a real absence of moderately reddened stars with luminosities below that corresponding to a main sequence A star. The apparent absence of stars with masses below 2.5 M⊙ was already noted by Straw et al. (straw87 (1987)), who suggested bimodality in the mass function as a possible explanation. An alternative intriguing possibility to explain these observations might be that at the early age of the aggregate only the most massive stars, which complete their evolutionary tracks towards the main sequence much faster than intermediate-mass and solar-type stars, may be sufficiently evolved and emerged from their circumstellar envelopes to populate the region of the color-magnitude diagram corresponding to moderate extinctions. Our observations do not allow us to test this hypothesis, but future observations at longer wavelengths and high spatial resolution may be able to do it. Both the possible overpopulation of the region above the A0 main-sequence line in Figure 10 due to the early evolutionary stage of the cluster, and the apparent lack of low mass stars, may indicate an actual mass of the cluster below the 210 M⊙ derived above. In the extreme case that no stars less massive than 2.9 M⊙ existed at all in the cluster, and assuming that the likely members listed in Table 2 have luminosities near the main-sequence ones, the mass of the observed cluster population would amount to M⊙.
It is interesting to compare the mass, contents, and extent of the IRAS 16362-4845 aggregate with that of the best studied young massive cluster, the Trapezium. The mass of the Trapezium can be estimated at M⊙ from the stellar mass density and the approximate radius given by Herbig & Terndrup herbig86 (1986), which are respectively 3000 M⊙ pc-3 and 0.22 pc. Higher stellar densities are obtained when considering only the central region of the cluster (McCaughrean & Stauffer mccaughrean94 (1994)). The Trapezium census of the most massive members includes 3 O-type members among the components of and Ori (Warren & Hesser warren77 (1977)), some of which are binaries having also high-mass companions (Weigelt et al. weigelt99 (1999), Petr et al. petr98 (1998)). The mass that we obtain for the IRAS 16362-4845 cluster appears to be somewhat higher, within the caveats described above, and the number of O stars is similar, again within the small-number statistics. It should be pointed out that the Trapezium does contain a substantial population of less massive members (McCaughrean & Stauffer mccaughrean94 (1994)) such as solar-type stars, low-mass stars, and substellar objects, in apparent contrast to the hints of a significant lack of stars later than A0 that we have stressed above. The luminosity function of the Trapezium cluster does not suggest any marked deficiencies over any mass interval (Muench et al. muench02 (2002)), although noticeable effects of the most massive stars on the mass function of the cluster have been recently suggested by Robberto et al. robberto04 (2004)). On the other hand, independently of the actual stellar content the IRAS 16362-4845 cluster is more compact. We estimate a radius of 0.11 pc, only half of the Trapezium cluster. If the extrapolation of the mass function to lower masses described earlier is approximately correct, the mass density is consequently higher than in the Trapezium by more than one order of magnitude, nearly M⊙ pc-3, which translates into cm-3 assuming that the mass forming the cluster was initially in the form of a single molecular core. We note finally that the Trapezium is probably nothing more than the nucleus of a much more extended aggregate containing over 2000 M⊙, the Orion Nebula Cluster (Hillenbrand & Hartmann hillenbrand98 (1998)), for which no counterpart exists in RCW 108 (See Section 3.6.1).
3.5 Spectroscopy of the HII region
The long-slit spectroscopy of selected stars in the visible and the infrared also provides a cross section spectrum of the HII region containing useful information on the physical conditions of its different components and on the ionizing stars, complementing that obtained with the observations of the stellar aggregate discussed in the previous Section.
The slit position in the visible spectrum contains stars 8 and 12, and the slit length reaches well up to the edge of the western molecular cloud, including a portion of the bright rim nebulosity appearing at the erosion interface. It thus samples well the compact component of the HII region, as well as the rim nebula and the tenuous ionized gas foreground to the molecular cloud that pervades the whole region. Moreover, when inspecting the spectroscopic frames we have appreciated the existence of a concentrated knot of emission in the visible appearing where the slit position runs closest to Star 17. This knot, whose outskirts are included in the slit, can be seen in the -band image (Figure 2) and more clearly in the -band image. The compact, almost point-like feature in the visible images is not coincident with Star 17, which is seen in the infrared images only and is actually located 2”0 to the northeast; both can be simultaneously seen only in the -band image of Figure 2.
Our estimates of the density of the ionized gas are made on the basis of [SII] line ratio (Osterbrock osterbrock89 (1989)), and the estimates of the temperature of the ionizing radiation are based on the single-star photoionization models of Stasińska & Schaerer (stasinska97 (1997)) for a gas of solar metallicity and for the density estimated from the [SII] line ratios. The translation of an ionizing radiation temperature into a spectral type of the ionizing star is made using the ZAMS models of Schaerer & de Koter (schaerer97 (1997)). We have estimated the extinctions using either the intrinsic H/H line ratio (foreground nebulosity and rim nebula) or the intrinsic Paschen 6/H line ratio (compact nebula and emission knot near Star 17), taken from Osterbrock (osterbrock89 (1989)) for case B recombination. The extinction curve used is that of Cardelli et al. (cardelli89 (1989)). We have also considered the empirical extinction curve derived by Bautista et al. (bautista95 (1995)) for the Orion nebula, under the expectation that it might better represent the extinction in the direction of the compact nebulosity of IRAS 16362-4845 as well. However, in the cases where the extinction can be simultaneously measured from the Balmer and the Paschen line ratios we find highly discrepant values between both when using Bautista et al.’s (bautista95 (1995)) curve, and a much better agreement when using Cardelli et al.’s (cardelli89 (1989)) curve, hence our preference for the latter. It must be recalled anyhow that the observed spectrum at any position is the integration along the line of sight of the spectra produced over a range of depths, extinctions, and conditions, and that the concept of typical extinction towards any ionized component of the region is thus necessarily an ill-defined one.

3.5.1 The cloud interface
The spectrum of the cloud interface, presented in Figure 15, corresponds to that of a lightly obscured nebula ( from the H/H ratio) ionized by mid-to-late type stars. The [SII] line ratio indicates a density somewhat below 100 cm-3. The extinction-corrected ratios of the [OIII](), [SII] (), [ArIII] (), HeI (), and [SIII] () lines with respect to H are all compatible with an ionizing radiation temperature around 40,000 K. The strength of the [ArIII] and HeI features are not consistent with temperatures significantly below that value, while [SIII] does not allow for a much higher temperature and is in fact better fitted by a temperature below 40,000 K (see Section 3.5.2).
The spectral type corresponding to a temperature of 40,000 K is O7-O8, which must be compared to the spectral types directly determined for HD 150135/150136, the two O-type stars of NGC 6193 that cause the ionization of the western cloud. This is in good agreement with the spectral type O6/O7 given in the literature for HD 150135. The spectral type of HD 150136 is often given as O5 in the literature (e.g. Hiltner et al. hiltner69 (1969)), which seems to be earlier than suggested by the spectrum of the rim nebula. The O7 classification given by Whiteoak (whiteoak63 (1963)) for this star is in better agreement with the spectrum of the nebula.

3.5.2 The foreground diffuse emission
The spectrum obtained through the part of the slit that runs across the dark areas of the RCW 108 cloud still contains emission lines similar to a low-intensity spectrum of the rim nebula, indicating that the molecular cloud is seen through a layer of ionized gas. The [SII] ratio is lower than for the rim nebula, indicating a lower density that we estimate at 10 cm-3 or perhaps even less. The intensities of the nebular lines are nearly constant across the slit with the exception of a dark patch near the rim nebula where they have a noticeably decrease, probably due to the existence of a cloud that is embedded in this foreground layer and absorbs much of the radiation from behind. We have used this local darkening to obtain the sky spectrum to be subtracted from the spectrum of the foreground emission. This sky-subtracted spectrum is shown in Figure 16.
The spectrum of the foreground ionized gas is very similar to that of the rim nebula, showing that the source of its ionization is probably the HD 150135/150136 pair too. The extinction derived from the H/H ratio, , is also very similar to the extinction toward the rim nebula. However we notice that the [SIII] lines in the far red are weaker here. The lower temperature of the ionizing radiation that is inferred, around 30,000 K, is in turn incompatible with the line ratios of all the other emission lines. Such a discrepancy, although less dramatic, was also mentioned concerning the [SIII] lines of the rim nebula, which also favored a temperature clearly below 40,000 K.


3.5.3 The compact HII region
The extracted spectrum of the compact nebula, shown in Figure 17, corresponds to a spot lying approximately midway between the closest positions along the slit to stars 17 and 21 (see Figure 12), and is representative of the whole compact component. For the background subtraction we have chosen a region further to the East that contains the typical spectrum of the foreground emission discussed in Section 3.5.2, which as pointed out in that Section keeps a fairly constant intensity across the area of the dark nebula. Thus, we expect the spectrum presented in Figure 17 to be essentially uncontaminated by the foreground emission.
The most obvious differences between the visible spectrum of the compact HII region and the ones of the rim nebula and the foreground emission discussed earlier are due to extinction, for which we obtain now a value between (from Paschen 6/H) and (from H/H). The near infrared spectrum, shown in Figure 18, is not extracted at exactly the same position as the visible one, since the slit was oriented so as to simultaneously contain stars 12 and 16, and corresponds to a spot about 5” to the Northwest of Star 12. It displays the features expected in a HII region, with Brackett series lines clearly visible up to Br 10, as well as a strong line of HeI at 2.058m. The HeI(2.058) / Br ratio that we measure, 0.63, is near the lower edge of the range measured in diverse HII regions. This might be a consequence of the softness of the ionizing radiation, although Lumsden et al. (lumsden03 (2003)) caution against the use of this ratio to derive the properties of the ionizing stars, especially in compact HII regions.
Extinction, together with the higher density of the emitting gas, are the main responsible of the dominance of the [SIII] lines on the far red part of the visible spectrum with respect to H. The [SII] line ratio is markedly different now, and we derive from it an electron density of 1,500 cm-3. This is much lower than the 13,800 cm-3 independently derived from radio continuum data by Urquhart et al. (urquhart04 (2004)), which may be due to the assumptions implicit in the derivation of electron densities from radio continuum data, but also to the possible existence of a denser, more deeply embedded component of the HII region that does not dominate the visible emission spectrum. Despite the high extinction the H and [OIII] lines on the blue part of the spectrum are still visible. H is stronger than [OIII] now, arguing for a lower temperature of the ionizing radiation than in the cases of the rim nebula and the foreground emission. The lower temperature is also favored by the other line ratios, particularly HeI/H which has a good sensitivity to temperature and only a mild dependency on density in this range. The temperature of the ionizing radiation best fitting all the line ratios is 35,000 K, and indicates a spectral type later than those of HD 150135/150136. Indeed, the temperature is in good agreement with a O9 spectral type, which in turn matches well the position of Star 12 in the color-magnitude diagram discussed in Section 3.4. The agreement with the spectral type estimated by Urquhart et al. (urquhart04 (2004)) based on the ionizing photon flux is also excellent.

3.5.4 The emission knot near Star 17
The emission characteristics of the compact knot near Star 17 are similar to those of the compact HII region, with the main differences of a stronger extinction ( from the Paschen 6/H ratio; the extinction below Å is too strong for H to be distinguishable). The component of the [SII] pair is now much stronger than the component and the ratio between the two is close to the high density saturation value, indicating a density in excess of cm-3. The spectrum longwards of H is rich, making the entire Paschen decrement between Paschen 6 and Paschen 12 visible. Taking into account the difference in densities inferred for the compact nebula and the knot, the relative intensities of the [SII], [ArIII], and [SIII] emission lines are all in agreement with the same ionizing radiation temperature as derived for the compact nebula, K corresponding to a O9 spectral type. Given the proximity of the knot to Star 12 and the consistency with its spectral type as deduced from the spectrum of the compact nebula, we consider it likely that it is a dense clump externally ionized by this star.
3.6 Star formation across the RCW 108 molecular cloud
Our near infrared observations, covering a projected area of nearly 5 pc 5 pc, allow us to investigate the traces of recent and ongoing star formation well beyond the immediate vicinity of IRAS 16362-4845, at a scale that is intermediate between the star formation directly associated to the compact HII region and the large-scale, low resolution surveys of Yamaguchi et al. (yamaguchi99 (1999)) and Arnal et al. (arnal03 (2003)) that encompass the entire RCW 108 complex and most of the Ara OB1 association. While IRAS 16362-4845 is an obvious site of current massive star formation, other sites in the same cloud being obscured by similar amounts and forming lower-mass stars may exist as well without showing so obvious signposts. One of this sites is CD-48 11039, already mentioned in Section 3.1, which is recognized by the reflection nebula that it illuminates. Other young stellar objects of even lower mass may pass completely unnoticed.
To try to identify young lower mass stars in the region, we use the position in the , diagram as a telltale diagnostic for the existence of hot circumstellar disks remnant from their formation, a very common signature of youth among intermediate-mass, pre-main sequence stars and a frequently used approach to the identification of distributed star formation in molecular clouds (e.g. Li et al. li97 (1997), Massi et al. massi00 (2000), Brandner et al. brandner01 (2001), Jiang et al. jiang02 (2002); see also Lada & Lada lada03 (2003) for a review). To produce a reliable identification of near infrared excesses we have considered only stars brighter than . The luminosities to which this limit corresponds is obviously highly dependent on the amount of light reprocessed by the circumstellar material into the band and on how deeply embedded in the cloud the star is. As a representative number, a star 1 Myr old having a foreground obscuration of () as typically found in the IRAS 16362-4845 aggregate, and in which half of the emitted flux at comes from reprocessed light would have a luminosity L⊙333We take a bolometric correction in the band as a representative value for a 4,400 K pre-main sequence star (Kenyon & Hartmann kenyon95 (1995)) in the convective part of its evolutionary track (D’Antona & Mazitelli dantona94 (1994)), which corresponds to a mass of 0.8 M⊙ at an age of 1 Myr.
To assess the amount of infrared excess we use the reddening-free quantity
which measures the separation between the position in the color-color diagram of a star with colors , , and a reddening vector that traces the Rieke & Lebofsky (rieke85 (1985)) extinction curve having its origin at the intrinsic colors of a A0V star. Background red giants, which align along a narrow strip running above this reddening vector in the , diagram, have , while early-type stars with no infrared excess cluster around . Stars with can be either late-type M dwarfs (Bessell & Brett bessell88 (1988)) or stars with infrared excess. The former are far too faint to be detected in our observations at the distance of RCW 108, and the areal density of field late-M dwarfs at the limiting magnitude is too low for them to appear in significant numbers in the imaged field (Reid et al. reid02 (2002)). A third possibility is that they may be binaries unrelated to RCW 108 consisting of pairs with widely different infrared colors, which should be a rare occurrence as well.
Out of the 4,365 stars brighter than for which complete photometry is available, we have found 87 satisfying the criterion that we impose (rather arbitrarily as far as the absolute value is concerned) as a threshold defining the stars suspected to display infrared excess. Their spatial distribution is plotted in Figure 20, superimposed on a -band image of the region centered on IRAS 16362-4845 and where the extent of the dense parts of the RCW 108 clouds is well delineated by the areal density of stars.
The distribution of stars with infrared excess in RCW 108 is clearly non-random. The greatest concentration takes place in the densest region of the cloud, near IRAS 16362-4845, where the overall density of stars is lowest due to the presence of the obscuring cloud. The infrared excess stars are not uniformly scattered in the cloud, but are instead distributed along a belt that contains IRAS 16362-4845 and runs from northeast to southwest. The northeastern side is particularly interesting, as it runs roughly parallel to the rim nebula in the inner side of the cloud, suggesting that the stars in this region may have their origin in the action of the ionization front encountering molecular gas, perhaps producing the implosion of preexisting cores by the increased external pressure. We note in particular a clear contrast in density of near-infrared excess stars as we move along an East-West strip immediately North of IRAS 16362-4845, in which the presence of such objects ends about East of the HII region without any corresponding decrease in molecular gas column density as we proceed further to the West. This suggests that, despite the similar physical conditions of the molecular gas along this strip, star formation has taken place only in the parts closest to the ionization front. It is interesting to note that a similar conclusion is independently reached by Urquhart et al. (urquhart04 (2004)) based on the location and expected coevality of the three thermal sources detected in MSX observations (one of which is IRAS 16362-4845), which they classify as possible ultracompact HII regions corresponding to the earliest stage of massive stellar evolution, at ages years. One of our infrared-excess stars in this zone, at , , is surrounded by a tiny reflection nebula seen only in the -band image. Some stars with infrared excess are seen also outside this area, where the ionization front has already destroyed the cloud, and they may be the result of past episodes of star formation when the cloud extended further towards NGC 6193. Indeed, assuming that the freshly ionized gas can escape freely leaving an essentially clear line of sight between the ionizing stars and the rim nebula, taking our derived density of cm-3 for the molecular cloud and assuming that the true distance from the ionizing stars to the rim nebula is roughly the same as the projected distance, we obtain a propagation velocity of the erosion front
where s-1 is the flux shortwards of the Lyman continuum of a O7 star (Schaerer & de Koter schaerer97 (1997)). This is an upper limit to the velocity, since the low density column of ionized gas between the stars and the rim nebula must be kept ionized thus decreasing the ionizing flux that reaches the molecular cloud, and the true distance between the ionizing stars and the rim of the molecular cloud is likely to be somewhat larger than the projected distance444Based on their interpretation of infrared emission produced in the photodissociation region at the rim nebula/molecular cloud interface, Urquhart et al. (urquhart04 (2004)) suggest that NGC 6193 lies actually somewhat behind the cloud.. Nevertheless, the time needed for the ionization front to travel at this speed from the position of the easternmost infrared excess stars to the present position of the rim of the cloud is only years (of the same order of the estimate by Urquhart et al. (urquhart04 (2004)) based on a different set of hypotheses), or over one order of magnitude less than the typical disk dispersal timescales of solar-type stars (Strom et al. strom93 (1993)), so even a decrease of the propagation velocity of the erosion front by the same factor would still be consistent with the presence of stars with infrared excess far beyond the present edge of the molecular cloud. Overall, we find 39 stars (45% of the total) on the side of the cloud facing NGC 6193 and beyond the cloud in the same direction, and thus possibly having a triggered origin.
It is interesting to note however that numerous infrared excess sources are found in the Southwestern quadrant of Figure 20. The H image (Figure 1) shows that this region is still fairly opaque, despite the higher density of stars shown by the infrared images. Also CO maps such as those shown in Figure 5 show streamers of molecular gas extending in this direction. Based on their location it seems more difficult to link the existence of these stars, and in general all the stars located to the west of IRAS 16362-4845, with the action of the HD 150135/150136 pair. No other O-type stars have been identified near the Southwestern edge of the RCW 108 cloud that may cause effects similar to those of HD 150136/150136. The near-infrared stars near the Southwestern edge of the cloud may thus represent star formation not being triggered by an external cause. Evidence for the coexistence of different modes (triggered/non-triggered) of star formation has been also reported in other massive star formation regions (Jiang et al. jiang02 (2002)). However, the fact that such stars are also non-randomly distributed across the cloud, and that there is no distinct spatial separation between them and the stars for which we proposed a triggered origin, puts a note of caution in our interpretation of the latter, whose location on the side facing NGC 6193 may also be fortuitous.
3.6.1 Star formation efficiency in the western cloud
The derivation of the stellar mass of the RCW 108 complex on the basis of the members identified via their infrared excess would require determining their masses as well as the fraction of cloud members that display such infrared excess. Unfortunately, the currently available data prevent this exercise. However, it is possible to use our estimate of the total mass of the cloud (Section 3.2.3) together with indirect arguments to show that the western cloud has in any case a low star formation efficiency (defined as , where and are respectively the masses in stellar and gaseous form) as compared to typical evolved giant molecular clouds. The stellar mass estimate for the IRAS 16362-4849 aggregate, 210 M⊙, represents only 2.6 % of the mass in molecular form (Section 3.2.3), well below the % of gas that is typically turned into stars in a giant molecular cloud at the end of its life (Williams & McKee williams97 (1997)). The fraction is even smaller if the apparent deficiency of low mass stars in the aggregate hinted at in Section 3.4 is real. In order to raise the star forming efficiency to 10 % one thus needs to invoke the existence of stars amounting to nearly 700 M⊙ scattered across the cloud outside the boundaries of the aggregate. If this component obeyed a Miller-Scalo mass function, the expected number of stars more massive than 3 M⊙ would be around 50. Our observations indicate that the number is far smaller than that, with CD-48 11039 being the only star outside the aggregate with a mass in this range. The low star-to-gas mass ratio, together with the vast amount of molecular gas available to star formation and its high volume density, thus suggest that most of star formation in the RCW 108 still has to take place. It is interesting to speculate that, should star formation proceed across RCW 108 in the future until reaching a final % efficiency, the result may then be similar to the extended Orion Nebula Cluster. The role played by IRAS 16362-4849 as the core of that future RCW 108 aggregate would then be similar to the role that the Trapezium plays in the Orion Nebula Cluster nowadays. In this respect, RCW 108 and the Orion nebula complex might thus be regarded as similar structures at different stages of their evolution.
4 Summary and conclusions
In this paper we have presented a collection of visible, near infrared and millimeter observations of the RCW 108 region and its associated rim nebula, focusing on its active massive star forming site, IRAS 16362-4845, and on the molecular gas presumably associated to the cluster NGC 6193. IRAS 16362-4845 is a compact HII region whose actual morphology and stellar contents are best revealed by near infrared observations. At the core of the HII region lies a Trapezium-like compact cluster dominated by a late O-type star, surrounded by a looser aggregate probably including between one and three other late O-type stars and about 16 B-type stars. The near-infrared color-magnitude diagram of the aggregate gives an estimate of its mass of M⊙. The cluster seems to lack moderately reddened stars later than A0.
We have discussed the spectrum of the ionized gas in the region and the physical conditions of the molecular gas as inferred from 12CO J=21 and 13CO J=10 mapping. The compact HII region is dense ( cm-3), although much less dense than the surrounding molecular gas as inferred from the molecular-line observations in the same direction. It spectrum suggests a spectral type O9 for the ionizing star, in good agreement with the position of the brightest star of its cluster in the color-magnitude diagram. A compact knot located near the main ionizing star, whose density is derived to be above cm -3 and whose lines indicate ionization by a spectrum similar to that of the stars ionizing the compact nebula, may thus be externally ionized by those same stars. Streaming motions are revealed by the interferometric H observations both in the compact HII region and near the molecular cloud interface, which can be interpreted in terms of photoevaporation of the molecular gas.
We obtain masses of 8000 M⊙ and 660 M⊙ for the molecular clouds associated to RCW 108 and to NGC 6193, respectively. The extinction on the background at the position of IRAS 16362-4845 reaches up to mag, while the peak extinction produced by the cloud associated to NGC 6193 is much lower, . We consider explanations to the kinematics of the NGC 6193 cloud based on rotation and on expansion powered by the stars in the cluster, although we do not find conclusive evidence for either interpretation. We attribute broad wing CO emission (redshifted with regard to the bulk emission of the molecular cloud) northwest of IRAS 16362-4845 to erosion of clumps due to the ionizing gas of the comapct HII region. A more complicated scenario including an expanding shell and outflow emission from YSO can not be excluded but needs further observational investigation.
Using near infrared excess as a way to identify young stars still surrounded by circumstellar dust, we find that their distribution is inhomogeneous: not surprisingly, the molecular cloud harbors most of them, mainly in the surroundings of IRAS 16362-4845. Many are distributed in a broad band near the edge of the molecular cloud and parallel to it, suggesting that their formation may have been triggered by the progress of the ionization front traced by the rim nebula into the molecular cloud. Other infrared excess stars appear outside the cloud on the side facing NGC 6193, suggesting that they formed in ancient regions of the RCW 108 molecular cloud that have been eroded away. However, numerous infrared excess sources appear also on the side of the RCW 108 cloud opposite to NGC 6193, where there is no obvious triggering candidate. Despite the evidence for widespread ongoing star formation we find a low overall star formation efficiency that, together with the physical conditions and mass of the cloud, suggests that most of the star formation in RCW 108 still has to take place. Based on this, we speculate that RCW 108 may represent a structure similar to the Orion nebula complex observed at an earlier stage of evolution.
The observations presented and discussed here, while not being an exhaustive survey of the different components of RCW 108 and the gas associated to NGC 6193, provide some useful elements towards a complete picture of a complex that features an emerged cluster with massive stars and the last remnants of its parental cloud, lying on the sky side-to-side to a young, embedded massive star forming region in earliest stages of interaction between a newly formed stellar aggregate and its surrounding gas. At a larger scale, we can also investigate possible evidence of star formation in a molecular cloud being triggered by an external action, namely the ultraviolet radiation of the hottest stars of NGC 6193. The identification of intermediate mass stars with near infrared excesses across the cloud gives us a possibility of carrying out follow-up observations aimed at deriving their approximate ages, which might in turn provide evidence for a wave of star formation running across the RCW 108 cloud. Finally, a detailed study of the RCW 108 region can complement observations at larger scales comprising the entire Ara OB1 association, to which the RCW 108 complex belongs, thus yielding so far elusive observational views on the interplay of star forming processes at widely different length scales.
Acknowledgements.
It is a pleasure to thank the staff of the La Silla Observatory for their support during our observations, especially Dr. Vanessa Doublier, Dr. Emanuela Pompei, Mr. Hernán Núñez, Mr. Duncan Castex, and Ms. Mónica Castillo. We particularly thank Achim Tieftrunk for performing the molecular line observations using the SEST. We are also indebted to Dr. Grayna Stasińska for making available to us the results of her calculated spectra of model HII regions and for useful comments on their use, as well as to Dr. Margaret M. Hanson for her remarks on the infrared spectrum of the ionizing stars of IRAS 16362-4845. Useful discussions with Dr. Mario van den Ancker and Dr. Monika Petr-Gotzens on the nature of Star 16 are gratefully acknowledged. We thank Dr. P. Amram for the H interferometric observations. Finally, we thank the anonymous referee for constructive comments that helped improving the presentation and contents of this paper.References
- (1) Arnal, E.M., Morrel, N.I., Garcia, B., 1988, PASP, 100, 1076.
- (2) Arnal, E.M., May, J., Romero, G.A., 2003, A&A, 412, 431.
- (3) Bautista, M.A., Pogge, R.W., DePoy, D.L., 1995, ApJ, 452, 685.
- (4) Beech, M., Mitalas, R., 1994, ApJS, 95, 517.
- (5) Bessell, M.S., Brett, J.M., 1988, PASP, 100, 1134.
- (6) Blitz, L., Thaddeus, P., 1980, ApJ, 241, 676.
- (7) Bonnell, I.A., Bate, M.R., Clarke, C.J., Pringle, J.E., 2001, MNRAS, 324, 573.
- (8) Bonnell, I.A., Bate, M.R., 2002, MNRAS, 336, 659.
- (9) Brandner, W., Grebel, E.K., Barbá, R., Walborn, N., Moneti, A., 2001, AJ, 122, 858.
- (10) Cardelli, J.A., Clayton, G.C., Mathis, J.S., 1989, ApJ, 345, 245.
- (11) Collins Petersen, C., 2001, Sky & Telescope, vol. 102, no. 11, 54.
- (12) D’Antona, F., Mazzitelli, I., 1994, ApJS, 90, 467.
- (13) Dickman R.L., 1978, ApJ Suppl. 37, 407.
- (14) Drilling, J.S., Landolt, A.U., 2000, in Allen’s Astrophysical Quantities, ed. A.N. Cox, Springer-Verlag.
- (15) Frerking M.A., Langer W.D., Wilson R.W., 1982, ApJ 262, 590.
- (16) Garmany, C. D., Conti, P. S., Massey P. 1980, ApJ, 242, 1063.
- (17) Glass, I.S., Whitelock, P.A., Catchpole, R.M., Feast, M.W., 1995, MNRAS, 273, 383.
- (18) Godbout, S., Joncas, G., Durand, D. et al., ApJ, 478, 271.
- (19) Greene, T.P., Lada, C.J., 1996, AJ, 112, 2184.
- (20) Herbig, G.H., Terndrup, D.M., 1986, ApJ, 307, 609.
- (21) Kenyon, S.J., Hartmann, L., 1995, ApJS, 101, 117.
- (22) Kutner, M.L., Tucker, K.D., Chin, G.C. et al., ApJ 215, 521.
- (23) Hamuy, M., Walker, A.R., Suntzeff, N.B., Gigoux, P., Heathcote, S.R., Phillips, M.M., 1992, PASP, 104, 533.
- (24) Hanson, M.M., Conti, P.S., Rieke, M.J., 1996, ApJS, 107, 281.
- (25) Herbst, W., 1975, AJ, 80, 212.
- (26) Herbst, W., Havlen, R.J., 1977, A&AS, 30, 279.
- (27) Hillenbrand, L.A., Hartmann, L.W., 1998, ApJ, 492, 540.
- (28) Hiltner, W.A., Garrison, R.F., Schild, R.E., 1969, ApJ, 157, 313.
- (29) Jiang, Z., Yao, Y., Yang, J., Ando, M., Kato, D., Kawai, T., Kurita, M., Nagata, T., Nagayama, T., Nakajima, Y., Nagashima, C., Sato, S., Tamura, M., Nakaya, H., Sugitani, K., 2002, ApJ, 577, 245.
- (30) Kaltcheva, N.T., Georgiev, L.N., 1992, MNRAS, 259, 166.
- (31) Kleinmann, S.G., Hall, D.N.B., 1986, ApJS, 62, 501.
- (32) Li, W., Evans, N.J., Lada, E.A., 1997, ApJ, 488, 277.
- (33) Lada, C.J., Lada, E.A., 2003, ARA&A, 41, 57.
- (34) le Coarer, E., Amram, P., Boulesteix, J., Georgelin, Y.M., Georgelin, Y.P., Marcelin, M., Joulie, P., Urios, J., 1992, A&A, 257, 389
- (35) Lumsden, S.L., Puxley, P.J., Hoare, M.G., Moore, T.J.T., Ridge, N.A., 2003, MNRAS, 340, 799.
- (36) Massi, F., Lorenzetti, D., Giannini, T., Vitali, F., 2000, A&A, 353, 598.
- (37) McCaughrean, M.J., Stauffer, J.R., 1994, AJ, 108, 1382.
- (38) Miller, G.E., Scalo, J.M., 1979, ApJS, 41, 513.
- (39) Morris, P.W., Eenens, P.R.J., Hanson, M.M., Conti, P.C., Blum, R.D., 1996, ApJ, 470, 597.
- (40) Muench, A.A., Lada, E.A., Lada, C.J., Alves, J., 2002, ApJ, 573, 366.
- (41) Oliva, E., Origlia, L., 1992, A&A, 254, 466.
- (42) Osterbrock, D.E., 1989, Astrophysics of Gaseous Nebulae and Active Galactic Nuclei, University Science Books.
- (43) Palla, F., Stahler, S.W., 1990, ApJ, 360, L47.
- (44) Perinotto, M., Corradi, R.L.M., 1998, A&A, 332, 721.
- (45) Petr, M.G., Coudé du Foresto, V., Beckwith, S.V.W., Richichi, A., McCaughrean, M.J., 1998, ApJ, 500,825.
- (46) Phillips, J.P., de Vries, C.P., de Graauw, T., 1986, A&AS, 65, 465.
- (47) Reid, I.N., Gizis, J.E., Hawley, S.L., 2002, AJ, 124, 2721.
- (48) Rieke, G.H., Lebofsky, M.J., 1985, ApJ, 288, 618.
- (49) Robberto, M., Song, J., Mora Carrillo, G., Beckwith, S.V.W., Makidon, R.B., Panagia, N., 2004, ApJ, 599, 537.
- (50) Rodgers, A.W., Campbell, C.T., Whiteoak, J.B., 1960, MNRAS, 121, 103.
- (51) Schaerer, D., de Koter, A., 1997, A&A, 322, 598.
- (52) Shaver, P.A., Goss, W.M., 1970, Austr. J. Phys. Suppl., 14, 77.
- (53) Stasińska, G., Schaerer, D., 1997, A&A, 322, 615.
- (54) Stetson, P.B., 1987, PASP, 99, 191.
- (55) Straw, S., Hyland, A.R., Jones, T.J., Harvey, P.M., Wilking, B.A., Joy, M., 1987, ApJ, 314, 283.
- (56) Strom, S.E., Edwards, S., Skrutskie, M.F., 1993, in Protostars and Planets III, Univ. of Arizona Press.
- (57) Urquhart, J.S., Thompson, M.A., Morgan, L.K., White, G.J., 2004, A&A, in press.
- (58) Vázquez, R.A., Feinstein, A., 1992, A&AS, 92, 863.
- (59) Warren, W.H., Hesser, J.E., 1977, ApJS, 34, 115.
- (60) Weigelt, G., Balega, Y., Preibisch, T., Schertl, D., Schöller, M., Zinnecker, H., 1999, A&A, 347, L15.
- (61) Whiteoak, J.B., 1963, MNRAS, 125, 105.
- (62) Williams, J.P., McKeee, C.F., 1997, ApJ, 476, 166.
- (63) Yamaguchi, R., Saito, H., Mizuno, N., Mine, Y., Mizuno, A., Ogawa, H., Fukui, Y., 1999, PASJ, 51, 791.