IMF variations and their implications for Supernovae numbers
Abstract:
The stellar initial mass function (IMF) integrated over an entire galaxy is an integral over all separate star-formation events. Since most stars form in star clusters with different masses the integrated IMF becomes an integral of the (universal or invariant) canonical stellar IMF over the star-cluster mass function. This integrated IMF is steeper (contains fewer massive stars per G-type star) than the canonical stellar IMF. Furthermore, observations indicate a relation between the star-formation rate of a galaxy and the most luminous stellar cluster in it. This empirical relation can be transformed into one between the star-formation rate of a galaxy and a maximum cluster mass. The assumption that this cluster mass marks the upper end of a young-cluster mass function leads to a connection of the star-formation rate and the slope of integrated IMF for massive stars. This integrated IMF varies with the star-formation history of a galaxy. Notably, large variations of the integrated IMF are evident for dwarf galaxies. One important result is that the number of type II supernovae per star is supressed relative to that expected for a canonical IMF, and that dwarf galaxies have a supressed number of supernovae per star relative to massive galaxies. For dwarf galaxies the number of supernovae per star also varies substantially depending on the galaxy assembly history.
PoS(BDMH2004)063
1 The stellar IMF
Star formation takes place mostly in embedded clusters, each cluster containing a dozen to many million stars. Within these clusters stars appear to form following a universal initial mass function (IMF) with a Salpeter power-law slope or index (, [5, 2]) for stars more massive than , , where is the number of stars in the mass interval . This has been found to be the case for a wide range of different conditions in the Milky Way (MW), the Large and Small Magellanic clouds (respectively LMC, SMC) and other galaxies.
2 The (embedded) cluster IMF
Several studies show that star clusters also seem to be distributed according to a power-law embedded cluster mass function (ECMF), , where is the number of embedded clusters in the mass interval , and is the mass in stars. In the solar neighbourhood [4] find a slope between 50 and 1000 , while in the SMC and LMC [1] find and [10] find for in the Antennae galaxies. We therefore assume a single-slope power-law ECMF with between 5 and .
3 The star-formation-rate–maximal-cluster-mass relation
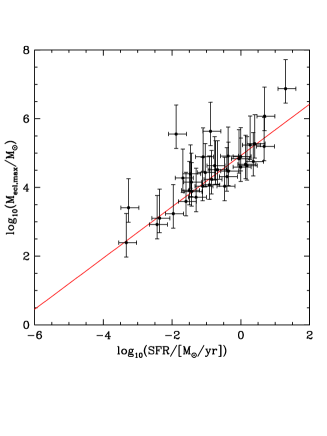
In [9] we derived a relation (shown in Fig. 1) between the maximal cluster mass in a galaxy and the current star formation rate (SFR) of the galaxy,
where is the mass-to-light ratio, typically 0.0144 for young ( 6 Myr) clusters. This eq. connects the IMF via the ECMF with the properties of a galaxy.
4 The integrated galaxial initial mass function (IGIMF)
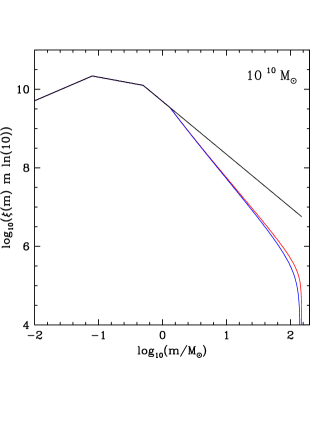
As in our model all stars are born in clusters following a universal IMF but also clusters are formed from a universal ECMF, the mass function for all stars born in all clusters, which we call the integrated galaxial initial mass function (IGIMF), becomes the following integral ([6]),
As seen in Fig. 2 the resulting IGIMFs are always steeper than the input canonical stellar IMF.


5 Results & Conclusions
- •
-
•
Chemical enrichment histories, the number of SNII per star and mass-to-light ratios calculated with an invariant Salpeter IMF cannot be correct for any galaxy.
-
•
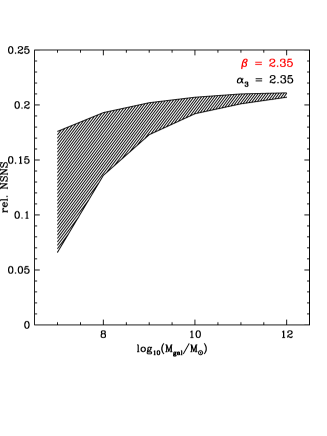
The number of supernovae per star (see right panel of Fig. 3) is possibly significantly lower over cosmological times than for an invariant canonical IMF.
-
•
Irrespective of how old a galaxy is it will always appear less chemically evolved than a more massive equally-old galaxy as a result of the steeper IGIMF.
-
•
The scatter in chemical properties must increase with decreasing galaxy mass.
References
- [1] Hunter, D. A., Elmegreen, B. G., Dupuy, T. J., & Mortonson, M. 2003, AJ, 126, 1836
- [2] Kroupa, P. 2002, Science, 295, 82
- [3] Kroupa, P., & Weidner, C. 2003, ApJ, 598, 1076
- [4] Lada, C. J., & Lada, E. A. 2003, ARA&A, 41, 57
- [5] Salpeter, E. E. 1955, ApJ, 121, 161
- [6] Vanbeveren, D. 1982, A&A, 115, 65
- [7] Weidner, C., & Kroupa, P. 2004, MNRAS, 348, 187
- [8] Weidner, C., & Kroupa, P. 2004, submitted to ApJ
- [9] Weidner, C., Kroupa, P., & Larsen, S. S. 2004, MNRAS, 350, 1503
- [10] Zhang, Q., & Fall, S. M. 1999, ApJL, 527, L81