Pulse Profile Change Possibly Associated with a Glitch in an Anomalous X-ray Pulsar 4U 0142+61
Abstract
We report a glitch-like pulse frequency deviation from the simple spin-down law in an anomalous X-ray pulsar (AXP) 4U 0142+61 detected by ASCA observations. We also found a significant pulse profile change after the putative glitch. The glitch parameters resemble those found in another AXP 1RXS J170849.0400910, in the Vela pulsar, and in other radio pulsars. This suggests that the radio pulsars and AXPs have the same internal structure and glitch mechanism. It must be noted, however, that the pulse frequency anomaly can also be explained by a gradual change of the spin-down rate () without invoking a glitch.
1 Introduction
Anomalous X-ray pulsars (AXPs) are a small group of X-ray emitting pulsars (see Mereghetti et al. (2002) for a review). They are not likely to be accretion-powered pulsars with a binary companion, since the fluxes of the optical counterparts are too small for high-mass binary companions or the Doppler modulation due to the binary motion has not yet been found. They are also not rotation-powered pulsars, since the observed X-ray luminosities ( ergs s-1) exceed the spin-down energy loss rates of neutron stars ( ergs s-1).
Accretion-powered pulsars without a binary companion (fossil accretion disk) (Chatterjee, Hernquist & Narayan, 2000; Alpar, 2001) and those with a small binary companion (Mereghetti & Stella, 1995) have been discussed. However, the pulse timing that originates in the accretion disk (large timing noises and/or persistent spin-up periods) is not found. AXP 1E 2259+586 (Kaspi et al., 2003) and 1RXS J170849.04000910 (Kaspi, Lackey & Chakrabarty, 2000; Kaspi & Gavriil, 2003) exhibited glitches similar to those of rotation-powered pulsars. The timing behavior of AXPs is similar to a solitary neutron star with no accretion disk. AXPs are also characterized by soft X-ray spectra (), no radio detections, slow rotation periods ( s), and burst activities.
Thompson & Duncan (1996, 2001) proposed the novel hypothesis that SGRs (soft gamma repeaters) and AXPs are solitary neutron stars with ultra-strong magnetic fields ( G), referred to as “magnetars.” X-ray photons are produced in this model by the release of the strong magnetic field energy stored in the neutron star crust, or a twisted internal magnetic field of neutron stars. Recent discoveries of burst activities (Gavriil, Kaspi & Woods, 2002; Kaspi et al., 2003), an optical pulsation (Kern & Martin, 2002), and cyclotron spectral features (Gavriil, Kaspi & Woods, 2002; Ibrahim et al., 2002; Ibrahim, Swank & Parke, 2003; Rea et al., 2003) support the magnetar model. Interestingly, the glitch and the pulse profile change were observed simultaneously during the outburst of 1E 2259+586 (Kaspi et al., 2003).
The X-ray source 4U 0142+61 was discovered by Uhuru; its pulsation period of s was discovered by EXOSAT (Israel, Mereghetti & Stella, 1994). 4U 0142+61 was one of the prototypes of anomalous X-ray pulsars (Hellier, 1994; Mereghetti & Stella, 1995; van Paradijs, Taam & van den Heuvel, 1995). A discovery of the optical pulsation supports the magnetar scenario by suggesting that the optical emission comes from the magnetosphere of the neutron star, not from the accretion disk (Kern & Martin, 2002).
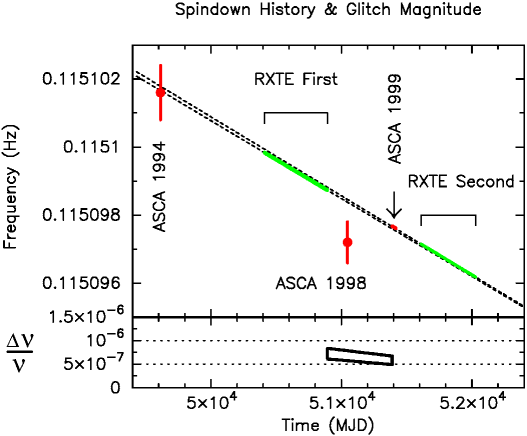
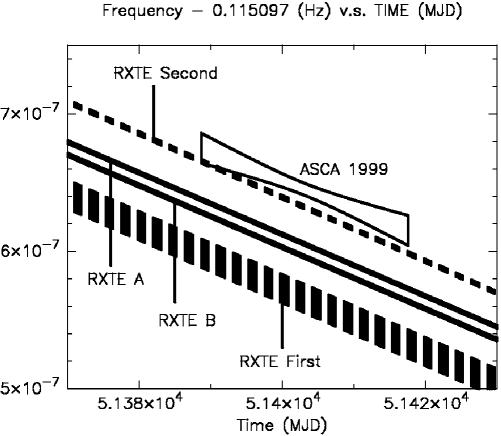
The long-term stability of its intensity, spectrum, and pulse profile were reported through a comparison between ASCA observations in 1994 and in 1998 (Paul et al., 2000). The high stability over 4.4 yrs was reported following the long-term monitoring observations of RXTE from Nov. 1996 to Apr. 2001 (Gavriil & Kaspi, 2002), and the pulse frequency and its derivative were precisely determined. However, this RXTE observation was not complete due to a 2.0-yr gap from May 1998 to Mar. 2000, dividing its total 4.4-yr span into two spans, the “First” (1.3 yr) and the “Second” (1.1 yr) (Table 2 in Gavriil & Kaspi (2002) or Fig. 1). Gavriil & Kaspi (2002) combined these spans and provided the unified ephemerides, “A” and “B,” which are qualitatively similar (Table 2 in Gavriil & Kaspi (2002)).
The ASCA observations in 1998 and 1999 were performed just during the gap between the RXTE observations. Those in 1999 in particular were carried out over a period of a month, and therefore precise determination of the pulse frequency was possible. We discovered in our study that the pulse frequency of 4U 0142+61 in the 1999 ASCA observations was significantly higher than those predicted by the unified ephemerides (A, B) and the first ephemeris, and it is also marginally higher than the prediction by the second ephemeris. These deviations exclude the unified ephemerides and suggest the presence of a glitch within the 2.0-yr gap before the 1999 ASCA observations. In addition, we detected a morphological change of the X-ray pulse, in which the pulse profile after the glitch differed significantly from those before the glitch.
2 Observations
4U 0142+61 was observed with ASCA eight times during its mission life. The observations were undertaken in 1994, 1998, and 1999. This source was monitored over a period of about one month with six exposures during the last term. These observations are summarized in Table 1. All of the observations were taken by GIS and SIS detectors. Almost all GIS observations were taken in the PH mode with 1024 PHA bins and timing bit = 0 at high or medium bit rate, in which the time resolutions were 62.5 or 500 ms. We analyzed only the GIS-2 and GIS-3 data with high and medium bit rates.
| Start Date | Exposure | Reference Epoch | ||
| (UT) | (ks) | (MJD) | (Hz) | (Hz s-1) |
| 1994 Sep 18 (21:35:39) | 18.4 | 49614.17288 | 0.1151016(8) | |
| 1998 Aug 21 (11:23:48) | 18.9 | 51046.69875 | 0.1150972(6) | |
| 1999 Jul 29 (16:22:15) | 23.2 | |||
| 1999 Aug 03 (20:03:29) | 23.5 | |||
| 1999 Aug 09 (18:37:56) | 11.0 | |||
| 1999 Aug 12 (22:24:03) | 19.4 | 51403.13258 | 0.115097645(4) | |
| 1999 Aug 21 (19:06:08) | 25.1 | |||
| 1999 Aug 27 (03:01:19) | 18.1 | |||
| Reference epochs are given at the mid-observation. Numbers in parentheses are 1 uncertainties. | ||||
We obtained all the ASCA observation data for 4U 0142+61 from the High Energy Astrophysics Science Archive Research Center (HEASARC) archive site.111ftp://legacy.gsfc.nasa.gov/FTP/asca/data/rev2/ We used the SCREENED data, which had been subjected to the standard screening procedure (Revision 2). We selected the source photons from a circular region with a radius of 5.9 arcmin centered on the position with the pulsar peak counts, and we used events with an energy of 0.5 to 10 keV (44848 in PI space). The source flux was constant during all observations. The event arrival times were corrected to the value at the solar system barycenter using timeconv v1.53 (HEASOFT v5.2). We incremented the times by half of their time resolutions to mix the high and medium bit rate data and compensate for the difference of the time resolutions, since the times recorded were the leading edge of the time duration of the resolution (M. Hirayama; private communication).
3 Timing Analysis
We proceeded with the following steps to determine the pulse frequencies () and their derivatives () for the observation terms of 1994, 1998, and 1999, on the assumption that the higher order derivatives were zero. We calculated both values at the reference epochs (), which were selected at the middle of the terms, to minimize the effect of the correlated error between and . Hereafter, a subscript “” denotes a parameter evaluated at the reference epoch .
3.1 Epoch-folding Method
The rough (, ) pairs were estimated by the epoch-folding method, in which the best (, ) pair was found to maximize the quantity from each folded light curve:
| (1) | |||||
| (2) |
where is the number of bins in one period, () is the number of events in the -th bin, is the total number of events in the observation term, and is the mean number of events for the bins.
3.2 Pulse Arrival Time Analysis
More accurate determinations of the pulse frequency and its uncertainty were achieved by counting the pulse numbers and the pulse arrival times. The pulse numbers at any time can be expressed by the Taylor expansion around the reference epoch , as in Gavriil & Kaspi (2002). We divided each of the observation terms into short segments. The time series was split into short segments of about 30 min duration every min for the terms of 1994 and 1998. Each of the six observations for the term of 1999 (Table 1) corresponds to a segment. The pulse profiles of the segments were made by folding the time series with the best (, ) values of the -th segment (: the number of segments) obtained by the epoch-folding method cited above, in which the reference “phase zero” epoch of each pulse profile was taken at the mid-time of each segment. The template pulse profile of the term was generated in the same way using all the segments. Both the template and the segment pulse profiles were cross-correlated in the Fourier domains; the Fourier components equal to or above the fifth order were discarded. Thus, we obtained the phase offset () of each segment from the template. The uncertainties of the offsets were estimated by Monte Carlo simulation, adding the Poisson errors to the pulse phase bins.
We were then able to calculate (, ) most accurately by imposing a constraint on the segment pulses in which the cumulative pulse phase of the -th segment relative to the template must be an integer () plus the phase offsets ().
The best combination of the and (, ) pair was found to minimize the following value:
| (3) |
Here, was selected within the error of induced from the uncertainties of (, ) roughly determined by the epoch-folding method. The uncertainties of (, ) can be calculated appropriately, because this analysis uses the fitting method.
4 Results
4.1 Pulse Frequency History
The pulse frequencies and their derivatives obtained by ASCA observations are listed in Table 1. The observations in 1994 and 1998 were too short to determine the , and therefore we calculated only the by setting for these terms. The spin-down history is provided in Fig. 1. The frequencies in the ASCA observations in 1994 and in 1998 were consistent with all of the RXTE ephemerides (Gavriil & Kaspi, 2002). However, the frequency for that in 1999 was significantly higher than the unified ephemerides (A or B) and the First ephemeris, and marginally higher than the Second ephemeris of RXTE (Fig. 2). The frequencies at the reference epoch of the 1999 ASCA observation expected by the RXTE ephemerides (Gavriil & Kaspi, 2002) are listed in Table 2. The same table also reveals the probability of the null hypothesis that the frequency of the ASCA observation and those of the RXTE are the same.
| Ephemeris | (Hz) | Probability | |
| First span only | 0.115097566(10) | 7.0 | |
| Second span only | 0.1150976321(14) | 2.8 | |
| Combined “A” | 0.1150976052(12) | 8.8 | |
| Combined “B” | 0.1150975960(13) | 10.7 | |
| ASCA | 0.115097645(4) | ||
| Numbers in parentheses are uncertainties. | |||
4.2 Pulse Profile
We searched for the pulse profile changes. We first compared the pulse profiles of every segment among the observations in 1999 with their template pulse profiles. The pulse phases of the segment pulse profiles were aligned with the template using the same cross-correlation procedure used in the pulse arrival time analysis (§ 3.2). Each segment pulse profile () was fitted to the template pulse profile () to minimize the reduced statistic by adjusting parameters and as follows.
| (4) |
Here, is the number of phase bins, and () is the number of events in the -th bin of the segment (the template pulse profiles). The number of degrees of freedom is .
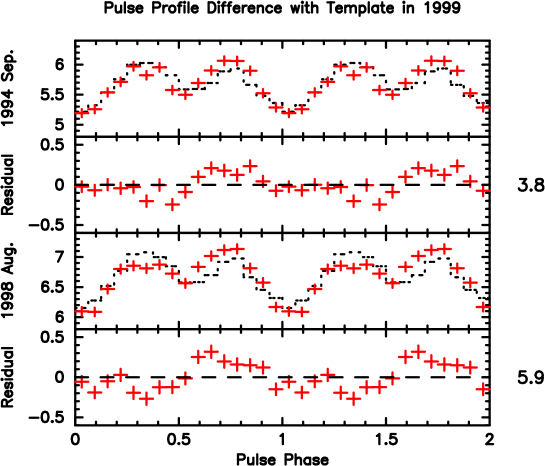
There were no significant variations ( for 14 degrees of freedom, corresponding to a probability of ) of the pulse profiles during the observations in 1999 (Fig. 3). However, the template pulse profiles in 1994 and in 1998 differed significantly from that in 1999 (Fig. 4). The reduced values were 3.8 and 5.9, corresponding to the probabilities of and . The pulse profiles in 1994 and in 1998 were consistent for .
We examined the possibility of whether these pulse profile changes were caused by various mixing of the high-bit and medium-bit rate mode data. In fact, the ratio of the high-bit to medium-bit rate mode exposures (H/M) ranged from 0.2 to 2.9. We compared four pulse profiles created from the 1999 ASCA data with the 1999 ASCA template pulse profile to determine how H/M variation affects the pulse profile. These four pulse profiles were created from data in which H/M = infinity (H = 0), H/M = 2.8, H/M = 1.2, and H/M = 0. The reduced values of the pulse profile differences were 1.8, 1.0, 0.6, and 1.4. This investigation verifies that the H/M variation does not significantly affect the pulse profile change.
We also searched for the energy dependence of the pulse profile changes. We divided the energy range of 0.5 to 10 keV into a high energy band (3.0 to 10.0 keV) and a low energy band (0.5 to 3.0 keV). The threshold of 3.0 keV was determined by the spectrum of 4U 0142+61. The photon count from the power-law component becomes greater above this energy than that from the blackbody component (see Fig. 2 in White et al. (1996)). We found that the pulse profile change was only significant in the low energy band. However, this does not signify that the pulse profile change only occurred in the low energy band, because the photon counts in the high energy band were about 1/10 times lower than that in the low energy band.

5 Discussion
We discovered a significant frequency deviation from the simple spin-down law in 4U 0142+61 for the first time. It is not likely that this deviation was caused by the timing noise, because the timing solutions were good during the RXTE observations (“First” and “Second” spans) and the ASCA 1999 observation. The most likely interpretation of this frequency jump is a glitch. The increase of the frequency () can be constrained, assuming that the glitch happened between MJD 50893.00 (the last time of the First RXTE observation) and MJD 51389.18 (the first time of the 1999 ASCA observation) (Figure 1; lower panel). The increase in the spin down rate can be estimated to be if the difference in the RXTE “First” and “Second” ephemerides (Table 2 in Gavriil & Kaspi (2002)) was caused by this glitch. Interestingly, these values are similar to those in a glitch of another AXP 1RXS J170849.0400910 (Glitch 1 in Kaspi & Gavriil (2003)). These values are therefore also similar to those in the Vela radio pulsar and other young radio pulsars (Kaspi, Lackey & Chakrabarty (2000) and references therein).
We also detected a significant pulse profile change in 4U 0142+61 for the first time, which is possibly associated with the glitch. This phenomenon is reminiscent of the out-burst that occurred in another AXP 1E 2259+586 with regard to the following points (Kaspi et al., 2003). (1) The amplitudes of the two peaks in the pulse profile were swapped during the outburst in 1E 2259+586. (2) 1E 2259+586 also underwent a sudden spin-up in the magnitude of . It could thus be interpreted that 4U 0142+61 occasionally underwent an outburst as well as a pulse profile change and a glitch just before the 1999 ASCA observation. Nonetheless, it must be noted that the lack of a pulse profile change during the 1999 ASCA observation suggests that survival time of the changed pulse profile is more than one month and is longer than the considerably short-lived ( days) pulse profile change observed in 1E 2259+586.
The and of AXP glitches are similar to those of rotation-powered pulsars, and therefore the inner structure of the neutron star and the glitch mechanism may be basically the same. Both types of neutron stars may consist of a neutron superfluid inner part and an outer crust part, and the glitch occurs due to the angular momentum transfer from the inner superfluid to the crust by a catastrophic vortex motion. However, the pulse periods of AXPs ( s) are beyond the cutoff of the glitch occurrence, at which periods the stress of the Magnus force is not strong enough to trigger the glitch (see Fig. 8 in Ruderman, Zhu & Chen (1998)). This suggests that there is a difference in the mechanism that causes these pulsars to reach the critical state of a glitch; for example, the ordinary rotation-powered pulsars reach the critical state due to their spin-down, while the magnetar candidates do so due to the stress of their magnetic fields.
The pulse profile change suggests two possibilities: (1) Large scale reconnection of the magnetic field or deformation of the crust accompanied by deformation of the magnetosphere, or (2) Plasma ejection from the crust into the magnetosphere (maybe a burst), which changes the distribution of the plasma which emits X-ray photons. The association between the pulse profile change and the glitch suggests the following scenarios: (i) The glitch associated with the crust cracking (Ruderman, Zhu & Chen, 1998; Link & Epstein, 1996) or platelet movement (Ruderman, 1991) causes deformation of the crust, and the pulse profile then changes as a result of (1) occurring or (ii) Plasma ejection from the crust associates with both the catastrophic vortex motion (a glitch) and the pulse profile changes due to the occurrence of (1) or (2).
We note that the observed ephemeris inconsistency can be explained without assuming a glitch. It is possible that the spin-down rate was temporarily smaller for a period between the 1998 RXTE observation and the 1999 ASCA observations, as observed in AXP 1E 1048.15937 (Gavriil & Kaspi, 2004). If the period of the smaller spin-down rate begins at the end of the 1998 RXTE observation and ends with the start of the 1999 ASCA observation, the spin-down rate in that period becomes minimum. It is Hz s-1, corresponding to the % change from the spin-down rate of the 1998 RXTE observation. This lower limit of the change is consistent with the finding for AXP 1E 1048.15937 (Gavriil & Kaspi, 2004). Such behavior can be caused by a change of the magnetospheric structure, followed by a torque change and possibly followed by the a pulse profile change.
6 Conclusion
An analysis of the ASCA observations suggests the existence of a glitch in 4U 0142+61. The glitch is similar to the glitch observed in another AXP 1RXS J170849.0400910 and other young radio pulsars. This indicates that the radio pulsars and AXPs have the same internal structures and glitch mechanisms. However, the source of the stress triggering the glitch may be different. We also discovered a pulse profile change, possibly associated with this glitch. This suggests that AXPs have an association between the internal structure and the magnetosphere that does not exist in radio pulsars.
References
- Alpar (2001) Alpar, M. A. 2001, ApJ, 554, 1245
- Chatterjee, Hernquist & Narayan (2000) Chatterjee, P., Hernquist, L., & Narayan, R. 2000, ApJ, 534, 373
- Gavriil & Kaspi (2002) Gavriil, F. P. & Kaspi, V. M. 2002, ApJ, 567, 1067
- Gavriil & Kaspi (2004) Gavriil, F. P. & Kaspi, V. M. 2004, ApJ, 609, L67
- Gavriil, Kaspi & Woods (2002) Gavriil, F. P., Kaspi, V. M., & Woods, P. M. 2002, Nature, 419, 142
- Hellier (1994) Hellier, C. 1994, MNRAS, 271, L21
- Ibrahim et al. (2002) Ibrahim, A. I., Safi-Harb, S., Swank, J. H., Parke, W., Zane, S., & Turolla, R. 2002, ApJ, 574, L51
- Ibrahim, Swank & Parke (2003) Ibrahim, A. I., Swank, J. H., & Parke, W. 2003, ApJ, 584, L17
- Israel, Mereghetti & Stella (1994) Israel, G. L., Mereghetti, S., & Stella, L. 1994, ApJ, 433, L25
- Kaspi, Lackey & Chakrabarty (2000) Kaspi, V. M., Lackey, J. R., & Chakrabarty, D. 2000, ApJ, 537, L31
- Kaspi et al. (2003) Kaspi, V. M., Gavriil, F. P., Woods, P. M., Jensen, J. B., Roberts, M. S. E., & Chakrabarty, D. 2003, ApJ, 588, L93
- Kaspi & Gavriil (2003) Kaspi, V. M. & Gavriil, F. P. 2003, ApJ, 596, L71
- Kern & Martin (2002) Kern, B. & Martin, C. 2002, Nature, 417, 527
- Link & Epstein (1996) Link, B. & Epstein, R. 1996, ApJ, 457, 844
- Mereghetti et al. (2002) Mereghetti, S., Chiarlone, L., Israel, G. L., & Stella, L. 2002, astro-ph/0205122
- Mereghetti & Stella (1995) Mereghetti, S. & Stella, L. 1995, ApJ, 442, L17
- Paul et al. (2000) Paul, B., Kawasaki, M., Dotani, T. & Nagase, F. 2000, ApJ, 537, 319
- Rea et al. (2003) Rea, N., Israel, G. L., Stella, L., Oosterbroek, T., Mereghetti, S., Angelini, L., Campana, S., & Covino, S. 2003, ApJ, 586, L65
- Ruderman (1991) Ruderman, M. 1991, ApJ, 382, 587
- Ruderman, Zhu & Chen (1998) Ruderman, M., Zhu, T. & Chen, K. 1998, ApJ, 492, 267
- Thompson & Duncan (1996) Thompson, C. & Duncan, R. C. 1996, ApJ, 473, 322
- Thompson & Duncan (2001) Thompson, C. & Duncan, R. C. 2001, ApJ, 561, 980
- van Paradijs, Taam & van den Heuvel (1995) van Paradijs, J., Taam, R. E., & van den Heuvel, E. P. J. 1995, A&A, 299, L41
- White et al. (1996) White, N. E., Angelini, L., Ebisawa, K., Tanaka, Y., and Ghosh, P. 1996, ApJ, 463, L83