The Ages of Elliptical Galaxies from Mid-Infrared Emission
Abstract
The mid-infrared (10-20m) luminosity of elliptical galaxies is dominated by the integrated emission from circumstellar dust in red giant stars. As a single stellar population evolves, the rate of dusty mass loss from red giant stars decreases with time, so the mid-infrared luminosity should also decline with stellar age. To seek such a correlation, we have used archival ISO observations to determine surface brightness profiles and central fluxes at 15m in 17 early-type galaxies for which stellar ages have been determined from optical spectral indices. The radial surface brightness distributions at 15m generally follow the stellar de Vaucouleurs profile as expected. We find that the surface brightness ratio is systematically higher in elliptical galaxies with ages Gyrs and in galaxies that exhibit evidence of recent mergers. Within the accuracy of our observations, shows no age dependence for ages Gyrs. The corresponding flux ratios within apertures scaled to the effective radius () are proportional to the ratios at larger galactic radii, indicating that no 15m emission is detected from central dust clouds visible in optical images in some of our sample galaxies. Emission at 15m is observed in non-central massive clouds of dust and cold gas in NGC 1316, an elliptical galaxy that is thought to have had a recent merger. Recent Spitzer Space Telescope data also indicate the presence of PAH emission at m. Several ellipticals have extended regions of 15m emission that have no obvious counterparts at other frequencies.
1 Introduction
Recently Piovan et al. (2003) studied the mid- and far-infrared emission from an evolving stellar population formed as a burst with a Salpeter IMF. Infrared emission at m arises from warm dust in the stellar winds of evolved giant stars; emission at shorter wavelengths m can be largely photospheric (Athey et al., 2002). Most of the time variation of mid-infrared emission from an evolving stellar population results from the declining rate of stellar mass loss from red giants, but Piovan et al. (2003) include many additional details. The mid-infrared emission is far less sensitive to stellar metallicity than age. This raises the interesting possibility that the mean stellar ages in elliptical galaxies can be determined directly from mid-infrared observations. We explore this possibility here using archival ISO observations at 15m.
The mean ages of stars in elliptical galaxies can be estimated optically from the strength of the stellar Balmer lines (e.g. Gonzalez 1993, Worthey 1994, Tantalo et al. 1998, Trager et al. 2000, Kuntschner et al. 2002). These mean age determinations, accurate to 20-30 percent, are often interpreted by comparing optical spectra with computed time-dependent spectral energy distributions a single burst of star formation. Most of the stars in elliptical galaxies are thought to be very old, possibly Gyrs, but unexpectedly young ages have been found for many ellipticals (e.g. Gyrs). Evidently the mean stellar age has been skewed downward by the addition of a relatively small component of young stars that may result from a recent merger or internal star formation.
Using archival ISO data at 15m for 17 early-type galaxies, mostly ellipticals, we explore the possibility that warm circumstellar dust can be used to determine stellar age or the likelihood of a recent merger. Balmer line stellar ages are known for all galaxies in our sample. We begin by verifying that the surface brightness profiles at 15m are similar to those in the I-band which we assume to be stellar, unaffected by dust emission. Since optically obscuring dust is often observed in the cores of elliptical galaxies, including some in our sample, we used both the integrated (within ) flux ratio and the surface brightness ratio at a larger radius () as a measure of the mean stellar ages. The two methods give similar results. In fact we find that the flux ratio within is similar to the ratios at for all the galaxies in our sample. Apparently, optically obscuring dust in the galactic cores – which could in principle contribute to the emission at 15m – cannot be easily detected at the sensitivity and resolution of ISO. As we show below, a plot of against optically determined ages shows that the mid-infrared emission is indeed sensitive to stellar age provided the galaxies are no older than Gyrs. Abnormally large or ratios, suggesting the presence of younger stars, are found in elliptical galaxies that (1) are thought to have suffered a recent merger (2) have strong optically obscuring dust, or (3) have HI or non-thermal radio emission.
2 Observations
The infrared camera ISOCAM on board the ISO satellite (Kessler et al. 1996) observed about 60 elliptical galaxies in the 4-15m region with narrow and wide band filters. ¿From these observations we selected 22 early-type galaxies, 17 of which have optically determined stellar ages (Terlevich & Forbes 2002). The relevant data for the galaxies in our sample are listed in Table 1. For these sample galaxies we consider only those observations taken with the smallest pixel scale to maximize the accuracy of the radial and azimuthally averaged mid-infrared emission. Mid-infrared fluxes within small radii are required to detect emission from dust in the galactic cores. The selected observations were performed in raster mode in the LW3 (m) filter. Individual galactic images have been taken with the Si:Ga array camera with 3 pixel scale. The total on-source integration times for the Si:Ga array are typically 300-600 seconds. Each observation consists of a collection of exposures, each taken with the target galaxy centered at several positions on the array. Two galaxies, NGC 4552 and IC 1409, have been observed at a plate scale of pix and with larger pointing offsets among the individual exposures, allowing raster maps of approximately .
3 Data Reduction
Data reduction has been performed using the Camera Interactive Analysis (CIA) package, version 5.0 (Ott et al., 1997). The procedure to reduce ISOCAM data starts with the dark current subtraction, for which we used the model option to take into account the long term drift in the dark current which occurred during the ISO mission. Then we removed cosmic ray hits using a sigma clipping filter or multi-resolution method. This removes most glitches of short duration. We also visually inspected the frames to manually remove glitches with very long time constants that may affect more than one frame.
Si:Ga devices are also affected by transient effects in which the response time to any change in illumination depends on the incident photon flux. This transient behavior needs to be characterized for our specific data set and properly allowed for in recovering the “stabilized” electronic signal. The transient correction was performed using the Fouks-Schubert method (Coulais & Abergel, 2000) in which a model of the detector response to incident radiation is used to reconstruct the stabilized fluxes. We then flat-fielded the data using standard library flats and applied the conversion from electronic units to Jy/pix using the standard cal–g calibration data that accompanies the data products. After each single exposure has been properly reduced, the final image was produced by registering and coadding each frame.
All 22 galaxies were detected at 15m with a S/N in excess of . In all cases the field of view was larger than the size of the galaxy, allowing an evaluation of the background flux directly from the galaxy maps. The sky background was calculated by taking the median pixel value from several blank regions in the reduced frames. We used the reduction routines in the IRAF package to perform both the aperture photometry and the azimuthally averaged radial profiles.
4 Results
One of the goals in this study is to test the sensitivity of mid-infrared surface brightness profiles to the age of the old stellar population in elliptical galaxies using the known age measurements from optical studies. In principle it might be possible to determine the stellar age at any galactic radius by comparing the surface brightness profiles at 15m and optical wavelengths. Our measurements of the 15m surface brightness profiles may allow us to detect emission from dust whose spatial distribution does not follow the galactic starlight. Complementary observations of the 15m flux through a small aperture centered on the galactic core are designed to detect emission from optically obscuring dusty clouds observed near the centers of many elliptical galaxies in our sample.
4.1 Radial Surface Brightness Profiles at 15m
We used the task ellipse in the IRAF stsdas package to perform elliptical isophote analysis. The isophote fitting algorithm, described by Jedrzejewski (1987), computes best-fitting elliptical isophotes. It applies iterative corrections to the geometrical parameters of a trial ellipse by projecting the fitted harmonic amplitude onto the image plane. The output provides all geometrical parameters for the ellipse including the semi-major axis and mean isophotal intensity. The left panels in Figure 1 show the 15m surface brightness profiles for each galaxy as a function of the semi-major axis to the 1/4 power. Most galaxies have surface brightness profiles that are generally in very good agreement with a de Vaucouleurs profile, which is a straight line in these plots. The downward curvature of at small arises because the pixel size becomes too large to properly track the steep de Vaucouleurs profiles there. It has been recognized for some time that mid-infrared emission from relatively warm dust in elliptical galaxies closely follows the de Vaucouleurs profile of optical starlight (Knapp et al., 1992; Athey et al., 2002; Xilouris et al., 2004), indicating that the warm dust is photospheric or circumstellar. The arrows in the profile plots show the location of for each galaxy where is the effective radius.
The right panels in Figure 1 show the ratio of the surface brightness at 15m to that in the I–band where dust emission is not expected. I–band profiles (not shown here) are taken from the studies of Idiart et al. (2002) and Goudfrooij et al. (1994b). To avoid complications when comparing the 15m and I-band profiles due to sampling with very different instruments and pixel scales, we discarded the innermost part of the profile of in Figure 1. The radial profiles for are also truncated at large radii where the low S/N precludes a proper isophotal fit. In the range plotted – where high S/N, low geometrical distortion, and reasonably large number of pixels ensure the most reliable data – the ratio is approximatively constant with radius for most of the galaxies. Although the stellar metallicity (and dust production?) is expected to decrease with galactic radius, this trend is not reflected in the profiles, which are either flat or increase slowly with projected radius. This insensitivity to stellar metallicity is consistent with the models of Piovan et al. (2003). We note that Malhotra et al. (2000) observe decreasing 15m/7m with galactic radius, but dust may contribute at both these wavelengths.
Two galaxies – NGC 5866 and NGC 5044 – have discordant 15m surface brightness profiles. NGC 5866 is an approximately edge-on S0 galaxy with an extensive dusty disk. The increase in for visible in Figure 1 is due to a slope change in that presumably arises from the bulge-disk transition. Azimuthally averaged surface brightness profiles for this galaxy are of limited value. It is debatable if this dusty S0 galaxy should be included in our sample of elliptical galaxies, but we have retained it to see if the dust is visible at 15m. The profile for NGC 5044 also has a feature visible in Figure 1 at caused by asymmetric emission toward the east and southeast that is discussed in more detail below.
4.2 Aperture Photometry
At visual wavelengths stellar ages and metallicities in elliptical galaxies are evaluated from an analysis of spectral indices, assuming single stellar populations (SSP). Since line index strengths in early-type galaxies have radial gradients (Carollo et al., 1993; Davies et al., 1993; Gonzalez, 1993), the representative mean ages and metallicities of elliptical galaxies refer to a fixed aperture. Following Terlevich & Forbes (2002) and other authors, we compare 15m and I-band fluxes within an aperture of radius .
Photometric data reduction of the 15m maps has been performed using the apphot package in IRAF. These routines are well suited to compute accurate centers and integrated fluxes within the specified circular aperture. Some galaxies in our sample have relatively small effective radii, requiring an accurate centering algorithm. It is also essential to account for pixels that span across the aperture to retrieve reliable photometry just within /8.
Whenever possible, I-band fluxes within for our sample galaxies are found by integrating published profiles to this radius. For galaxies without published profiles we used the total apparent corrected I-magnitude from the Lyon/Meudon Extragalactic Database (LEDA). Then, assuming a de Vaucouleurs I-band distribution, we integrated over the profile to determine the flux within the aperture using the appropriate effective radius for each galaxy. The aperture and surface photometry results are presented in Table 2. Figure 2 shows the ratios based on the photometry inside /8 plotted against the average stellar population age of the galaxies as tabulated by Terlevich & Forbes (2002) for this same aperture. Most optical ages have errors less than 20%; age errors are not plotted for clarity. The lines in Figure 2 show the expected evolution of produced by SSP models from Piovan et al. (2003) for metallicities Z = 0.02 (solar), Z = 0.04 and Z = 0.008. The predicted flux ratios from Piovan et al. (2003) are very insensitive to metallicity variation and vary only weakly for stellar ages Gyr. The observed for galaxies with ages Gyr suggest that the variation with stellar age is even less than that predicted by Piovan et al. (2003) and that the normalization of the theoretical curves may be a bit too low at ages Gyrs. Recently Thomas et al. (2004) have provided independent optical ages for a large number of the galaxies in our sample, using models for stellar absorption indices computed with variable stellar /Fe abundance ratios. While their ages tend to be slightly larger than those quoted by Terlevich & Forbes (2002), our conclusions are unaffected if galactic ages from Thomas et al. (2004) were used instead. Some of the galaxies with ages Gyr are known to contain central dust clouds and disks (see Table 1), but there is only a limited correspondence with the incidence of optically visible dust and the position of galaxies in Figure 2.
To illustrate the lack of significant 15m emission from central dust, we plot in Figure 3 the relationship between aperture flux ratios and the corresponding surface brightness ratios evaluated at , regarded as the ratio for the stellar emission alone. If central dust clouds contribute to the 15m emission, this would be revealed in but not in . The data points in Figure 3 lie along the 1:1 line with very little scatter, suggesting that the vertical spread of the data showed in Figure 2 cannot be explained by central dust clouds. One of the elliptical galaxies with the largest positive deviation in Figure 3 is NGC 5831 which contains no dust visible with HST. If small, centrally located dust is present in these galaxies, its effect on the 15m emission is not prominent.
For stellar ages Gyr the curves in Figure 2 from Piovan et al. (2003) are very sensitive to stellar age and in general terms this is supported by our observations. Three galaxies in Figure 2 – NGC 5866, NGC 6776 and NGC 1316 – lie far above the predicted lines for their optically determined ages. Three additional galaxies – NGC 1453, NGC 4278 and NGC 4261 – are marginally higher. We have already mentioned the unusual S0 galaxy NGC 5866, a galaxy with a massive dusty disk of cold gas that has been detected in HI and CO emission (Roberts et al. 1991; Welch & Sage 2003), so it is not surprising that it has an additional component of non-circumstellar mid-infrared dust emission. Of the remaining galaxies, four – NGC 1316, NGC 1453, NGC 4261 and NGC 4278 – show evidence of recent mergers, have significant HI (which is unusual for elliptical galaxies) or have strong radio emission and dusty disks. However, the remaining galaxy, NGC 6776, seems to be rather normal but does have a faint shell that may be merger-related. On balance, therefore, it appears that 15m observations can be used to identify post-merger ellipticals but the theoretical SSP flux ratios plotted in Figure 2 may unfortunately be too simplistic to fully describe the complexities of post-merger dust formation. The agreement of NGC 5018 with the Piovan et al. (2003) predictions may be fortuitous since there is some evidence of HI and radio emission from this galaxy. However, it appears to be significant that all four of the ellipticals with the lowest values of in Figure 2 – NGC 5831, NGC 720, NGC 2300 and NGC 4649 – have been observed with HST and found to contain no visible central dust.
5 Non-elliptical 15 Images
In Figure 4 we show 15m images of six galaxies from our sample that have low luminosity extensions in various directions from the emission peak which is coincident with the optical galaxy. With a pixel scale of 3 the ISOCAM beam size in the LW3 filter is approximately 5 FWHM. Thus, some of the features in the central 30 of NGC1316 and NGC1453 are clearly resolved. In the remaining galaxies, other non-axisymmetric emission features are apparent but are not resolved by these observations. Apart from NGC 5044, the azimuthally averaged 15m surface brightness profiles tend to wash out the faint isophotal extensions visible in Figure 4. In general, we have been unable to find emission at other frequencies that correlates with these mid-infrared features. The exception to this is NGC 1316 (Fornax A) a galaxy thought to have had recent merger (Schweizer 1980; Geldzahler & Fomalont 1984). Dust and gas appear to be falling into NGC 1316, forming a disk-like pattern in radius in the SE-NW direction, roughly parallel to the jet radio axis (Geldzahler & Fomalont, 1984). The extended emission in our 15m image is entirely consistent with emission from optically visible dust in these same regions, confirming the interpretation of Xilouris et al. (2004).
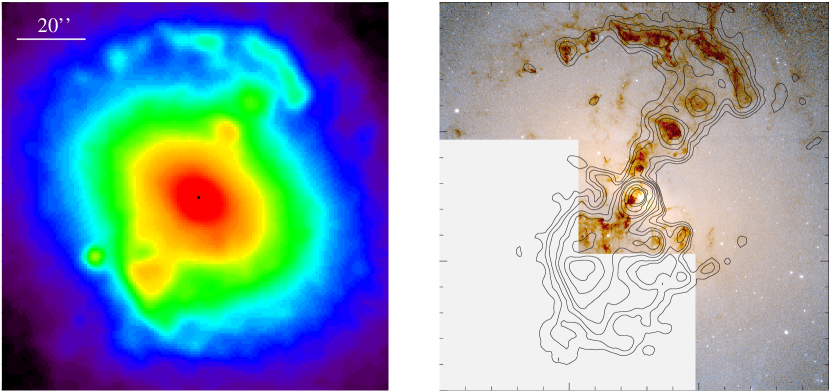
Recently the Spitzer Space Telescope (Werner et al., 2004) has observed NGC1316 with the IRAC (Fazio et al., 2004) instrument in four mid-infrared bands at 3.6, 4.5, 5.8 and 8.0m. The higher sensitivity and spatial resolution of the camera allow us to better resolve the emission in the central of the galaxy. The 8m image in Figure 5 (left panel) shows in great detail and at higher S/N the same asymmetrical features present in the ISO 15m image (see also Xilouris et al. (2004)). Many bright knots and an arc-like structure are prominent and well resolved by IRAC.
The right panel in Fig. 5 shows a contour plot of the emission at 8.0m once the stellar continuum is subtracted using a scaled 3.6 m image. The non–stellar emission is then superimposed to a B–I HST image (grayscale) (press release STScI-PR99-06, Grillmair et al. 1999) where the dust distribution is shown in dark extended features. The correspondence of the non–stellar 8m emission features with the dust seen in absorption by HST is remarkable. Almost every feature visible in the optical absorption study, included the central one, has 8m emission associated.
The 8.0m broadband filter sample the emission band centered at “7.7m” from Polycyclic Aromatic Hydrocarbons (PAH) molecules. Much of the excess emission in this band must then be attributed to PAHs, but the coincidence of the bright spots with the 15m image in the region where the Spitzer and ISO data overlap is indicative that warm small dust grains also contribute to the mid-infrared emission.
Perhaps young, luminous stars are forming in the infalling dusty gas, raising the dust temperature sufficiently to emit at 15m. It is interesting that dust located at large radii in NGC1316 is associated with 15m emission, while optically visible dust in the galactic cores is not. This may occur because only stars of rather low (Jeans) mass can form near the galactic cores where the gas pressures are very high. But the mass of molecular hydrogen in the dusty patches along the central SE-NW direction in NGC 1316, (Horellou et al., 2001), exceeds by the mass of dusty cold gas typically observed in elliptical galaxy cores, and this may be the best explanation for the associated star formation. Finally, it seems odd that the low luminosity extensions in the 15m image of NGC 5044, which we believe to be real, are strong enough to alter the surface brightness profile but still have no easily identifiable correlated emission at other frequencies.
6 Conclusions
We have found that the infrared emission at 15m from elliptical galaxies, normalized by the I-band emission, can provide an approximate measure of the mean age of galactic stars. Similar to the predictions of Piovan et al. (2003), the central flux ratios generally increase for (1) ellipticals known to have stellar ages Gyrs and particularly for (2) ellipticals that exhibit unusual attributes associated with recent mergers: dusty disks, HI emission, non-thermal radio emission, shells, etc. However, if only normal, non-merging galaxies are considered, the central flux ratios for galaxies in our sample shows little or no convincing variation with optically determined stellar ages. Since reliable estimates of the dust mass in elliptical galaxies are not available, it is not possible to quantify the excess 15m emission expected from a given amount of dust. However, the four ellipticals having the lowest observed values of all appear to be dust-free in HST observations.
Some individual galaxies seem inconsistent with these general trends. NGC 6776 has an unusually large , but only modest optical evidence for a recent merger. NGC 7626 and NGC 4374 have optically obscuring central dust and double radio lobes but rather normal .
The strong correlation between the flux ratio measured within and evaluated at indicates that 15m emission from optically visible dust in the cores of some of our sample galaxies is not detectable with ISO. This contrasts with the more distant dust in the merging galaxy NGC 1316 which is a local source of 15m emission. Evidently, massive dust-heating stars are forming in NGC 1316, but not in the dusty cores of many other ellipticals. As in NGC 1316, five additional elliptical galaxies show non-stellar extended features in their 15m images. While we believe these features are real, they do not appear associated with emission at other wavelengths.
We thank L. Piovan for providing electronic form of the SSP model outputs. Studies of hot gas and dust in elliptical galaxies at UC Santa Cruz are supported by NASA grants NAG 5-8409 & ATP02-0122-0079 and NSF grants AST-9802994 & AST-0098351 for which we are very grateful. PT is supported in part by NASA/ADP grant 21-399-20-01. FB is supported in part by a grant MIUR/PRIN 0180903. This research is based on observations with ISO, an ESA project with instruments funded by ESA Member States and with the participation of ISAS and NASA. Part of this work is based on observations made with the Spitzer Space Telescope, which is oparated by Jet Propulsion Laboratory, California Institute of Technology, under NASA contract 1407.
References
- Athey et al. (2002) Athey, A., Bregman, J. N., Bregman, J. D., Temi, P. & Sauvage, M. 2002, ApJ, 571, 272
- Bettoni et al. (2001) Bettoni, D., Galletta, G., Garcia-Burillo, S., Rodriguez-Franco, A. 2001, A&A, 374, 421
- Biller et al. (2004) Biller, B. A. et al. 2004, (astro-ph/00406132)
- Botinelli et al. (1990) Botinelli, L. et al. 1990, A&AS, 82, 391
- Burstein et al. (1987) Burstein, D., Krumm, N. & Salpeter, E. E. 1987, AJ, 94, 883
- Carollo et al. (1997) Carollo, C. M., Danziger, I. J., Rich, R. M., Chen, X. 1997, ApJ, 491, 710
- Carollo et al. (1993) Carollo, C. M., Danziger, I. J., Buson, L. 1993, MNRAS, 265, 553
- Chiaberge et al. (2003) Chiaberge, M., Gilli, R., Macchetto, F. D., Sparks, W. B., Capetti, A. 2003, ApJ, 582, 645
- Coulais & Abergel (2000) Coulais, A. & Abergel, A. 2000, A&AS, 141, 533
- Davies et al. (1993) Davies, R. L., Sadler, E. M., Peletier, R. F. 1993, MNRAS, 262, 650
- Ebneter et al. (1988) Ebneter,K., Davis, M., Djorgovsky, S. 1988, AJ, 95, 422
- Farrarese & Ford (1999) Farrarese, L. & Ford, H. C. 1999, ApJ, 515, 583
- Fazio et al. (2004) Fazio, G. G., et al. 2004, ApJS, 154, 10
- Farrarese et al. (1996) Ferrarese, L., Ford, H. C. & Jaffe, W. 1996, ApJ, 470. 444
- Ferrari et al. (2002) Ferrari, F., et al. 2002, A&A, 389, 355
- Ferrari et al. (1999) Ferrari, F., Pastoriza, M. G., Macchetto, F., Caon, N. 1999, A&A, 136, 269
- Filho et al. (2000) Filho, M. E., Barthel, P. D., Ho, L. C. 2000, ApJS, 129, 93
- Forbes et al. (1995) Forbes, D. A., Franx, M.; Illingworth, G. D. 1995, AJ, 109, 1988
- Geldzahler & Fomalont (1984) Geldzahler, B. J. & Fomalont, E. B. 1984, AJ, 89, 1650
- Georgakakis et al. (2001) Georgakakis, A., Hopkins, A. M., Caulton, A., Wiklind, T., Terlevich, A. I., Forbes, Duncan A. 2001, MNRAS, 326, 1431
- Giovannini et al. (2002) Giovannini, G., Cotton, W. D., Feretti, L., Lara, L., Venturi, T. 2001, ApJ, 552, 508
- Gonzalez (1993) Gonzalez, J. J. 1993, PhD Thesis, Univ. California, Santa Cruz
- Goudfrooij et al. (1994a) Goudfrooij, P., de Jong, T., Hansen, L., Norgaard-Nielsen, H. U. 1994, MNRAS, 271, 833
- Goudfrooij et al. (1994b) Goudfrooij, P., Hansen, L., Jorgensen, H. E., Norgaard-Nielsen, H. U., de Jong, T., van den Hoek, L. B. 1994, A&AS 104, 179
- Goudfrooij (2001) Goudfrooij, P., Mack, J., Kissler-Patig, M., Meylan, G., Minniti, D. 2001, MNRAS, 322, 643
- Ho et al. (2003) Ho, L. C., Filippenko, A. V. & Sargent, W. L. W. 2003, ApJ, 583, 159
- Ho et al. (1997) Ho, L. C., Filippenko, A. V., Sargent, W. L. W., Peng, C. Y. 1997, ApJS, 112, 391
- Horellou et al. (2001) Horellou, C., Black, J. H., van Gorkom, J. H., Combes, F., van der Hulst, J. M., Charmandaris, V. (2001), A&A, 376, 837
- Huchtmeier (1994) Huchtmeier, W. K. 1994, A&A, 386, 389
- Huchtmeier et al. (1995) Huchtmeier, W. K. Sage, L. J.& Henkel, C. 1995 A&A 300, 675
- Idiart et al. (2002) Idiart, T. P., Michard, R., de Freitas Pacheco, J. A. 2002, A&A 383, 30
- Jaffe et al. (1996) Jaffe, W, Ford, H., Ferrarese, L., van den Bosch, F., O’Connell, R. W. 1996, ApJ, 460, 214
- Jedrzejewski (1987) Jedrzejewski, R. I. 1987, MNRAS, 226, 747
- Kessler et al. (1996) Kessler M. F., Steinz U. A., Anderegg M. E., et al., 1996, A&A, 315, L27
- Kim et al. (1998) Kim, D. W., Fabbiano, G. & Mackie, G. 1998, ApJ, 497, 699
- Knapp et al. (1992) Knapp, G. R., Gunn, J. E., Wynn-Williams, C. G., 1992, ApJ, 399, 76
- Kuntschner et al. (2002) Kuntschner, H., Smith, R. J., Colless, M., Davies, R. L., Kaldare, R., Vazdekis, A. 2002, MNRAS, 337, 172
- Leeuw et al. (2000) Leeuw, L. L., Sansom, A. E. & Robson, E. I. 2000, MNRAS, 311, 683
- Mackie & Fabbiano (1998) Mackie, G. & Fabbiano, G. 1998, AJ, 115, 514
- Malhotra et al. (2000) Malhotra, S., Hollenbach, D., Helou, G., Silbermann, N. Valjavec, E., 2000, ApJ, 543,634
- Marcum et al. (2001) Marcum, P. M., O’Connell, R. W., Fanelli, M. N., Cornett, R. H., Waller, W. H., et al. 2001, ApJS, 132, 129
- Martel et al. (2002) Martel, A. R., Baum, S. A., Sparks, W. B., Biretta, J. A., Verdoes Kleijn, G., Turner, N. J. 2002, New Astronomy Reviews, 46, 187
- Mauch et al. (2003) Mauch, T., Murphy, T., Buttery, H. J., Curran, J., Hunstead, R. W., Piestrzynski, B., Robertson, J. G., Sadler, E. M. 2003, MNRAS, 342, 1117
- McNamara et al. (1994) McNamara, B. R., Sancisi, R., Henning, P. A., Junor, W. 1994, AJ, 108, 844
- Nagar et al. (2000) Nagar, N. M., Falcke, H., Wilson, A. S., Ho, L. C. 2000, ApJ, 542, 186
- Ott et al. (1997) Ott, S, Abergel, A., Altieri, B., Augueres, J. L., Aussel, H., et al. 1997, ASP Conf. Ser. Vol. 125, Astronomical Data Analysis Software and Systems (ADASS) VI,ed. G. Hunt & H.E.Payne, 34
- Piovan et al. (2003) Piovan, L., Tantalo, R., Chiosi, C., 2003, A&A, 408, 559
- Plana et al. (1998) Plana, H., Boulesteix, J., Amram, Ph., Carignan, C., Mendes de Oliveira, C. 1998, A&AS, 128, 75
- Ravindranath et al. (2001) Ravindranath, S., Ho, L. C., Peng, C. Y., Filippenko, A. V., & Sargent, W. L. W. 2001, ApJ 122, 653
- Raimond et al. (1981) Raimond, E., Faber, S. M., Gallagher, J. S., Knapp, G. R. 1981, ApJ, 246, 708
- Rembold et al. (2002) Rembold, S. B., Pastoriza, M. G., Ducati, J. R., Rubio, M., Roth, M. 2002, A&A, 391, 531
- Roberts et al. (1991) Roberts, M. S., Hogg, D. E., Bregman, J. N., Forman, W. R., Jones, C. 1991, ApJS, 75, 751
- Sage & Wrobel (1989) Sage, L. J. & Wrobel, J. M. 1989, ApJ, 344, 204
- Sandage & Bedke (1994) Sandage, A. & Bedke, J. in The Carnegie Atlas of Galaxies, vol 1, 1994
- Schweizer (1980) Schweizer, F. 1980, ApJ, 237, 303
- Schweizer (1981) Schweizer, F. 1981, ApJ, 246, 722
- Stevenson et al. (2002) Stevenson, S. L., Salzer, J. J. Sarajedini, V. L., Moran, E. C. 2002, AJ, 125, 3465
- Tantalo et al. (1998) Tantalo, R., Chiosi, C., Bressan, A. 1998, A&A, 333, 419
- Temi et al. (2003) Temi, P., Mathews, W. G., Brighenti, F., Bregman, J. D. 2003, ApJ, 585, L12
- Terlevich & Forbes (2002) Terlevich, A. I. & Forbes, D. A. 2002, MNRAS, 330, 547
- Thomas et al. (2004) Thomas, D., Maraston, C., Bender, R., Mendes De Oliveira, C., 2004, astro-ph/0410209
- Trager et al. (2000) Trager, S. C., Faber, S. M., Worthey, G., Gonzalex, J. J., 2000, AJ, 120, 165
- Tran et al. (2001) Tran, H. D., Tsvetanov, Z., Ford, H. C., Davies, J., Jaffe, W., van den Bosch, F. C., Rest, A. 2001, AJ, 121, 2928
- van Dokkkum & Franx (1995) van Dokkum, P. G. & Franx, M. 1995, AJ, 110, 2027
- Verdoes Kleijn et al. (2002) Verdoes Kleijn, G. A., Baum, S. A., de Zeeuw, P. T., O’Dea, C. P. 2002, AJ, 123, 1334
- Welch & Sage (2003) Welch G.A., Sage L.J., 2003, ApJ, 584, 260
- Werner et al. (2004) Werner, M. W., et al. 2004, ApJS, 154, 1
- Worthey (1994) Worthey, G. 1994, ApJS, 95, 107
- Xilouris et al. (2004) Xilouris, E. M., Madden, S. C., Galliano, F., Vigroux, L., Sauvage, M. 2004, A&A, 416, 41
- Zeilinger et al. (1996) Zeilinger, W. W., Pizzella, A., Amico, P., Bertin, G., Bertola, F., et al. 1996, A&As, 120, 257

![[Uncaptioned image]](/html/astro-ph/0412102/assets/x2.png)
![[Uncaptioned image]](/html/astro-ph/0412102/assets/x3.png)


| Name | Daafootnotemark: | Tbbfootnotemark: | Typeccfootnotemark: | Log aafootnotemark: | age ddfootnotemark: | Optical dust | Visible dust | Notes | |
|---|---|---|---|---|---|---|---|---|---|
| (Mpc) | (Kpc) | () | (Gyr) | from extintion? | lane or disk? | ||||
| NGC0720…….. | 20.80 | -4.8 | E5 | 4.03 | 10.38 | 3.4 | no99footnotemark: | a prototype E5 galaxy central galaxy in Fornax ; | |
| cluster2727footnotemark: ; strong color gradient in stars; central | |||||||||
| color is among blueset of E galaxies4040footnotemark: | |||||||||
| NGC1316…….. | 18.11 | -1.7 | SABs(0) | 7.08 | 10.93 | 3.4 | yes99footnotemark: | evidence of recent merger in H, dust2020footnotemark: ; detected | |
| in dust patches2121footnotemark: ; Fornax A (strong radio source)2626footnotemark: ; | |||||||||
| evidence of merger Arp 15426, 2926, 29footnotemark: ; 3 Gyr old merger | |||||||||
| remnant3030footnotemark: ; 0.5 Gyr old merger remnant3333footnotemark: . | |||||||||
| NGC1399…….. | 18.11 | -4.5 | E1 | 3.78 | 10.52 | no99footnotemark: | IRAS100m22footnotemark: ; low luminosity radio jet2222footnotemark: . | ||
| NGC1453…….. | 43.10 | -5.0 | E2–3 | 5.85 | 10.37 | 7.6 | gas disk1010footnotemark: ; radio1212footnotemark: ; HI12, 1312, 13footnotemark: . | ||
| NGC2300…….. | 27.67 | -3.5 | SA0 | 4.83 | 10.41 | 5.0 | no2323footnotemark: | shells; nuclear radio22footnotemark: ; a normal E32727footnotemark: . | |
| NGC4261…….. | 31.48 | -4.8 | E3 | 5.65 | 10.70 | 14.4 | yes2,7,8,9,372,7,8,9,37footnotemark: | powerful double lobe radio (3C270)2, 122, 12footnotemark: ; radio jets | |
| perpendicular to disk3737footnotemark: ; strong central optical | |||||||||
| emission lines3838footnotemark: ; UV emission from jet3939footnotemark: ; | |||||||||
| NGC4278…….. | 16.22 | -4.8 | E1 | 2.60 | 10.24 | 10.7 | yes11footnotemark: | yes2,4,8,362,4,8,36footnotemark: | large rotating HI+dust disk2,3,12,14,35,372,3,12,14,35,37footnotemark: ; strong |
| nuclear LINER emission lines 3434footnotemark: ; core-halo | |||||||||
| radio source with compact core3535footnotemark: ; | |||||||||
| optically visible dust patches3636footnotemark: ; | |||||||||
| NGC4374…….. | 15.92 | -4.0 | E1 | 4.25 | 10.57 | 11.8 | yes1111footnotemark: | yes2,6,92,6,9footnotemark: | classical double radio 2, 122, 12footnotemark: ; no large scale dust at |
| submm wavelengths2424footnotemark: ; nuclear dust lane3737footnotemark: ; | |||||||||
| core-jet radio source perp. to lane3737footnotemark: ; | |||||||||
| one-sided radio ”jet”3535footnotemark: ; M84; 3C272.1 | |||||||||
| NGC4472…….. | 15.92 | -4.7 | E1/S01(1) | 8.03 | 10.90 | 8.5 | yes1111footnotemark: | yes99footnotemark: | radio1212footnotemark: ; HI1515footnotemark: ; 2-sided weak radio jet4242footnotemark: ; |
| NGC4473…….. | 16.14 | -4.8 | E5 | 1.96 | 10.15 | no99footnotemark: | very small edge-on dust and gas disk but not see | ||
| with HST4343footnotemark: ; prototypical E5 galaxy2727footnotemark: ; | |||||||||
| NGC4552…….. | 15.92 | -4.6 | S01(0) | 2.32 | 10.29 | 9.6 | yes99footnotemark: | undetected at 4141footnotemark: ; | |
| modest radio source4444footnotemark: ; M89; | |||||||||
| NGC4636…….. | 15.92 | -4.8 | E0/S01(6) | 7.71 | 10.51 | yes99footnotemark: | NICMOS image is smooth, showing no dust | ||
| deviates from fund. plane for E cores3636footnotemark: ; | |||||||||
| radio core plus jets4545footnotemark: ; | |||||||||
| moderately strong broad 4646footnotemark: ; | |||||||||
| morphology is asymmetric with hole in center3131footnotemark: ; | |||||||||
| NGC4649…….. | 15.92 | -4.6 | S01(2) | 6.50 | 10.73 | 11.0 | no99footnotemark: | radio1212footnotemark: ; 1616footnotemark: ; HI1717footnotemark: ; no FIR dust2525footnotemark: ; | |
| undetected at 4141footnotemark: ; M60; | |||||||||
| NGC5018…….. | 30.20 | -4.5 | E3 | 3.81 | 10.57 | 1.5 | yes2323footnotemark: | radio1212footnotemark: ; HI1818footnotemark: ; dust patches2727footnotemark: ; | |
| NGC5044…….. | 30.20 | -4.8 | E0 | 10.40 | 10.70 | yes1,111,11footnotemark: | yes22footnotemark: | nuclear radio source22footnotemark: ; very bright, asymmetric | |
| diffuse optical line emission; dusty region is | |||||||||
| smaller; bright dust cloud to East of center4343footnotemark: ; | |||||||||
| NGC5831…….. | 22.91 | -4.8 | E3 | 3.11 | 10.03 | 2.6 | no55footnotemark: | ||
| NGC5866…….. | 13.18 | -1.3 | S03 | 4.98 | 10.32 | 1.8 | big disk2323footnotemark: | core radio source4545footnotemark: ; this S0 galaxy has a | |
| strong dust lane along major axis2727footnotemark: ; | |||||||||
| contains HI; emission4747footnotemark: ; | |||||||||
| NGC6776…….. | 70.41 | -4.1 | E+ | 9.21 | 10.66 | 3.2 | a normal E1 with a very faint shell12, 1312, 13footnotemark: ; | ||
| 843MHz radio (very faint)26, 2826, 28footnotemark: ; | |||||||||
| NGC7562…….. | 39.99 | -4.8 | E2–3 | 4.65 | 10.46 | 11.0 | HI12, 1912, 19footnotemark: ; a pair with NGC7562A and NGC5619 | ||
| with possible tidal connection4848footnotemark: ; | |||||||||
| faint HI detected in old literature4848footnotemark: ; | |||||||||
| NGC7619…….. | 39.99 | -4.8 | E | 6.20 | 10.58 | 9.0 | radio1212footnotemark: ; a normal E32727footnotemark: ; | ||
| NGC7626…….. | 39.99 | -4.8 | E | 7.37 | 10.61 | 11.7 | yes11footnotemark: | yes8,98,9footnotemark: | radio core-jet with double lobes 8, 128, 12footnotemark: ; |
| nuclear dust lane3737footnotemark: ; | |||||||||
| IC 1459 ………. | 18.88 | -4.7 | E1 | 3.57 | 10.37 | yes11footnotemark: | yes99footnotemark: | chaotic dust absorption visible; galaxy | |
| crossed by a disk of ionized gas; | |||||||||
| HI not detected, but CO () is4949footnotemark: ; heavy dust | |||||||||
| lane in with more chaotic and patchy dust | |||||||||
| further out; central starlight core is bluer5050footnotemark: ; | |||||||||
| ionized gas disk; stellar shells; bright point source | |||||||||
| in center; powerful compact radio core source5151footnotemark: ; |
Note. — Luminosities and distances are calculated with km s Mpc; data are from the LEDA catalog; morphological type code from the LEDA catalog; morphological type from the RSA catalog; data are from Terlevich & Forbes (2002); Goudfrooij et al. 1994a; Goudfrooij et al. 1994b; Raimond et al. 1981; Ebneter et al. 1988; Tran et al. 2001; Farrarese & Ford 1999; Ferrarese, Ford & Jaffe 1996; Verdoes Kleijn, et al. 2002; van Dokkum & Franx 1995; Zeilinger et al., 1996; Ferrari et al. 2002; Georgakakis et al., 2001; Huchtmeier 1994; Burstein, Krumm & Salpeter 1987; McNamara et al. 1994; Sage & Wrobel 1989; Huchtmeier, Sage & Henkel 1995; Roberts et al. 1991; Botinelli et al. 1990; Schweizer 1980; Horellou et al. 2001; Kim, Fabbiano & Mackie 1998; Xilouris et al. 2003; Leeuw, Sansom & Robson 2000; Temi et al. 2003; NED; Sandage & Bedke 1994; Mauch et al. 2003; Schweizer 1980, 1981; Goudfrooij et al. 2001; Whittmire et al. 2002; Zeilinger et al. 1996; Ferrari et al. 2002; Mackie & Fabbiano 1998; Stevenson et al. 2002; Giovvanini et al. 2001; Ravindranath et al. 2001; Jaffe et al. 1996; Martel et al. 2002; Chiaberge et al. 2003; Marcum et al. 2001; Ho, Filippenko & Sargent 2003; Biller et al. 2004; Ferrari et al. 1999; Filho et al. 2000; Nagar et al. 2000; Ho et al. 1997; Plana et al. 1998; Rembold et al. 2002; Bettoni et al. 2001; Carollo et al. 1997; Forbes et al. 1995;