Variations of the Mid-IR Emission Spectrum in Reflection Nebulae11affiliation: Based on observations with ISO, an ESA project with instruments funded by ESA Member States (especially the PI countries: France, Germany, the Netherlands and United Kingdom) and with the partecipation of ISAS and NASA
Abstract
Using spatial-spectral data cubes of reflection nebulae obtained by ISOCAM, we have observed a shift in the central wavelength of the 7.7 m band within several reflection nebulae. This band, composed of components at 7.85 m and 7.65 m, shows a centroid shift from 7.75 m near the edge of the nebulae to 7.65 m towards the center of the nebulae as the shorter wavelength component becomes relatively stronger. The behavior of the 7.7 m band center can be explained either by assuming that anions are the origin of the 7.85 m band and cations the 7.65 m band, or that the band center wavelength depends on the chemical nature of the PAHs. The ratio of the 11.3/7.7 m bands also changes with distance from the central star, first rising from the center towards the edge of the nebula, then falling at the largest distances from the star, consistent with the 11.3/7.7 m band ratio being controlled by the PAH ionization state.
1 Introduction
The mid-infrared emission bands observed in many environments, including HII regions, post-AGB (asymptotic giant branch) stars, planetary nebulae, the diffuse ISM of galaxies, and reflection nebulae, are still commonly called the unidentified infrared (UIR) bands even though their association with polycyclic aromatic molecules (PAHs) was made 20 years ago (Leger & Puget, 1984; Allamandola et al., 1985) and this identification has since been supported by observations and theoretical calculations. However, identification of the emission bands with a single carrier has not been possible as the emission bands are likely due to a mixture of PAHs rather than a single molecule. Yet, a wealth of observationally based information about the UIR bands has been collected which, for example, has allowed authors to use them to measure redshifts of galaxies and to differentiate between AGN and starburst galactic nuclei (Roche et al., 1991; Genzel et al., 1998).
Trends observed in the detailed UIR emission spectra indicate that the molecules responsible for these bands vary depending on their environment and history. For example, using laboratory spectra, Allamandola et al. (1999) demonstrated that the difference between the emission spectrum of a post-AGB star and the Orion Bar can be explained by varying the PAH mixture in these sources. While a mixture of less stable PAH cations and neutrals could fit the post-AGB spectrum, more stable PAH cations with no neutrals were needed to fit the Orion Bar spectrum. Since the material around the post-AGB star is young and the material in the Orion Bar has been heavily processed, they concluded that processing in the ISM modifies the PAH mixture. Similar conclusions were reached by Hony et al. (2002) and Peeters et al. (2002) based on spectral variations they observed in ISO spectra of a large number of diverse sources.
The spectra of PAH neutrals and ions are quite different, with ions having stronger C-C mode (6–10 m) emission than C-H mode (10–14 m) emission, and neutrals having weaker C-C than C-H mode emission. Uchida et al. (2000) and Chan et al. (2001) used this property to determine whether the PAH ionization state changed in reflection nebulae and the diffuse ISM. While the reflection nebulae did show a variation of 40% in the intensity ratio over a wide range of incident UV flux, Uchida et al. (2000) expected a much larger variation if the PAHs changed entirely from ions to neutrals as the UV intensity decreased.
The PAH ionization state is determined by the ratio of the UV field () to the electron density (cf. Bakes et al. 2001), with PAHs existing primarily as anions for very low values of and as cations for very high values of . At intermediate values, PAHs will exist as a mixture of anions, neutrals, and cations. The ratio of the recombination and ionization rates determines where the transitions from cations to neutrals and neutrals to anions occur as decreases. Verstraete et al. (1990) have measured the ionization rate for coronene and pyrene, but the recombination rate (cation to neutral) has been measured only for the smallest PAHs (Abouelaziz et al., 1993), and the experimental value is smaller than theoretical values by one to two orders of magnitude. Only estimates exist for the physical constants that determine the anion to neutral transition (Le Page, Snow, & Bierbaum, 2001). The spectra of anions and cations are very similar from 5–14 m, so that the mid-IR spectrum in regions of very high and very low UV intensities should also be similar.
A shift of the 7.7 m band centroid has been observed previously. Bregman (1989a), and Cohen et al. (1989) noted that the central wavelength of the 7.7 m band depended on the type of object. Objects with freshly created PAHs (planetary nebulae) have a band centered near 7.85 m, while objects with older material (HII regions, reflection nebulae) have a band centered near 7.65 m. They noted that the 7.7 m band often contained contributions from both of these components. Peeters et al. (2002), using higher spectral resolution data from the ISO database, confirmed these results, and could clearly distinguish the two components that make up the 7.7 m band. They also suggested that the PAHs showing a 7.85 m band were pure, newly formed material while PAHs showing a 7.65 m band had been processed in the ISM. Hony et al. (2002) suggested that as PAHs are exposed to the interstellar UV field, they are eroded. Thus, it appears that as PAHs are exposed to UV radiation, the 7.7 m band shifts from 7.85 to 7.65 m.
The PAH lifecycle must be similar to other materials formed around stars and then ejected into the ISM (e.g. silicates). Once ejected into the ISM, PAHs are exposed to the diffuse UV field for about 107 years and chemically modified. They then become part of the material that forms a dark cloud, where all but the most volatile components of the gas, including the PAHs, freeze out to form the ices observed in absorption in the direction of embedded protostellar sources (Sellgren et al., 1995; Brooke et al., 1996; Bregman & Temi, 2001). Chemical reactions should occur in the ice (Bernstein et al., 1999, 2002), again modifying the chemistry of the PAHs. As stars burn their way out of the dark clouds, the PAHs become visible as emission from reflection nebulae.
In this paper, using ISOCAM spectral images of reflection nebulae, we show that the wavelength of the 7.7 m emission band varies with position in the nebula in a manner consistent with either variations in the ionization of the PAHs and/or with UV photo-processing of the PAHs. In regions of the nebulae close to the exciting star, the 7.7 m band has a weak component at 7.85 m which becomes stronger relative to the 7.65 m component with increasing distance from the star. The 11.3/7.7 m band ratio also varies with increasing distance from the star, first increasing and then decreasing in strength. In section 2 we describe the data reduction of the ISOCAM images to form spatial-spectral data cubes followed by an analysis of the data in section 3 and a discussion in section 4.
2 Data reduction
A large sample of reflection nebulae was observed with the ISOCAM camera (Cesarsky et al., 1996) on board the ISO satellite (Kessler et al., 1996). For the analysis presented here we selected three reflection nebulae observed in the spectral-imaging mode with the Circular Variable Filter (CVF). The data set is represented by a cube in which the two spatial coordinates are defined by the 32x32 Si:Ga infrared array, and the third dimension is the spectral axis obtained by scanning the CVF filter. The CVF is divided in two sections that cover a spectral range from 5.14 to 9.44 m (CVF1) and from 9.33 to 15.1 m (CVF2), with a spectral resolution of .
Two nebulae, vdB 17 and vdB 133, have been recorded by performing a full scan of the two CVFs in both the increasing and decreasing wavelength directions with a scale of per pixel. Each wavelength was observed 11 times for vdB 133 and 8 times for vdB 17 in each scan leg, with an elementary integration time per measurement of 2.1 seconds. The CVF step increment was set to 1 and 2 steps respectively for vdB 133 and vdB 17, providing an oversampling factor of 2–4 and 1–2 in the spectral axes. At the end, the combination of the different parameter set for each observation resulted in a total on-source integration time of 3378 and 1340 seconds, in each scan direction, for vdB 133 and vdB 17 respectively.
NGC 1333 SVS3 has been recorded with a different set of observing parameters; the pixel scale was set to 1.5″, providing a field of view of . Combining the 17 exposures taken at each CVF increment with an oversampling factor of 2–4, and a 2.1 seconds integration time per measurements, the total observing time spent on-source was 2696 seconds. The spectral scan through the CVF was performed on two non-contiguous sections of the CVF in a single scan direction (long to short wavelengths).
The data were reduced starting from the raw level, the CISP product, using the ISOCAM Interactive Analysis processing package CIA, (v5.0) (Ott et al., 1997). To correct the raw data for the dark current we used the dark model (Biviano et al., 2000) that takes into account the observing time parameters and the variation of the dark current both within a single revolution of the satellite and among all the revolutions. Then, the data were deglitched by applying a multiresolution median filter and corrected for the transient response of the detector. We applied the transient correction using the Fouks-Schubert method. Flat fielding was done using dedicated CVF zodiacal measurements that take into account the scattered light pattern that is produced inside the camera from reflections between detector and CVF filters (Sauvage, private communication).
3 Analysis
3.1 Wavelength of the “7.7” m band
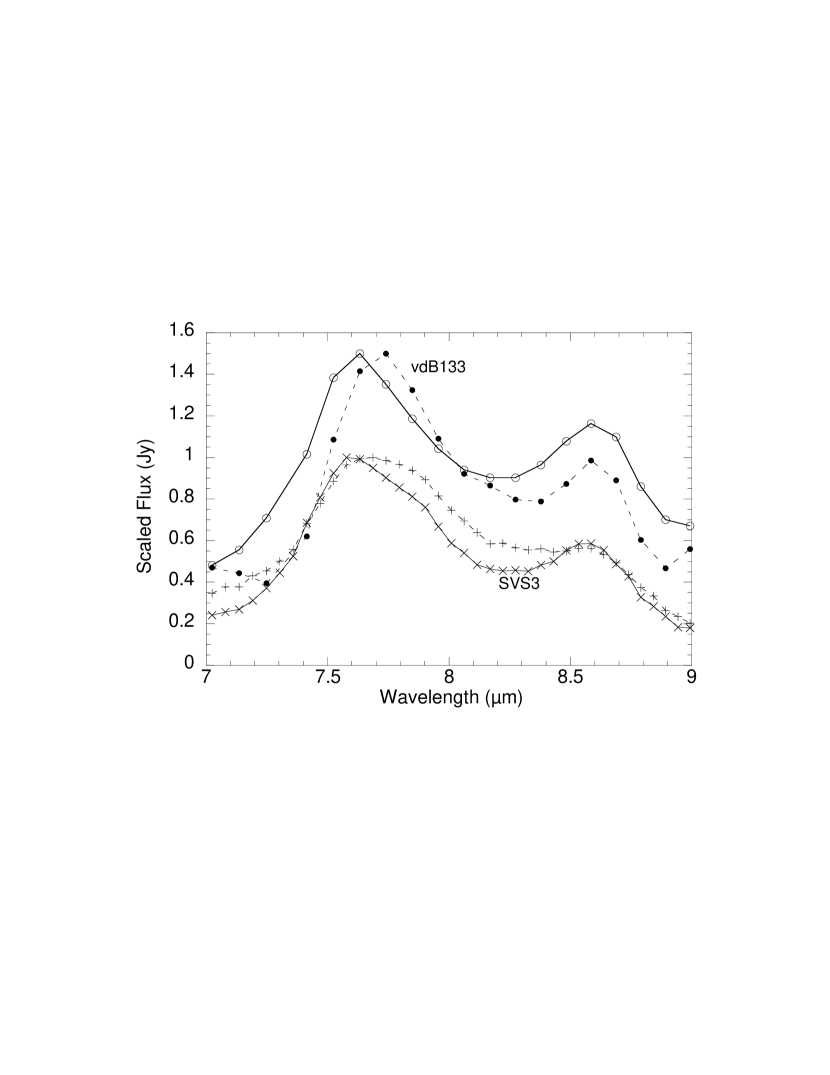
Figure 1 shows spectra from two different locations in the reflection nebulae vdB 133 and NGC 1333 SVS3. There is a clear shift in the centroid of the 7.7 m emission band between the two locations in each object. Also in both cases, the spectrum with the shorter wavelength emission band is closer to the exciting star than the one with the longer wavelength band. The higher resolution of the NGC 1333 SVS3 spectrum shows that the centroid appears to shift because the 7.7 m emission band is a combination of two overlapping components, one peaking at approximately 7.65 m and a second at 7.85 m, the same components observed by Peeters et al. (2002) and Bregman (1989a) in planetary nebulae (7.85 m) and HII regions (7.65 m). The 7.85 m component is stronger towards the edges of the nebulae, resulting in an apparent shift of the 7.7 m centroid to longer wavelengths.
To explore how the center wavelength of the 7.7 m band varies within these reflection nebulae, we fitted the spectrum at each point in vdB 133, vdB 17, and NGC 1333 SVS3 with a combination of a Gaussian and quadratic extending from 7.0 to 8.3 m using the GAUSSFIT routine in IDL. The quadratic fits the slope in the data points shortward and longward of the emission band to form a pseudocontinuum that the Gaussian rides on. We use the center wavelength of the Gaussian as the centroid of the emission feature.
3.2 Measuring feature strengths
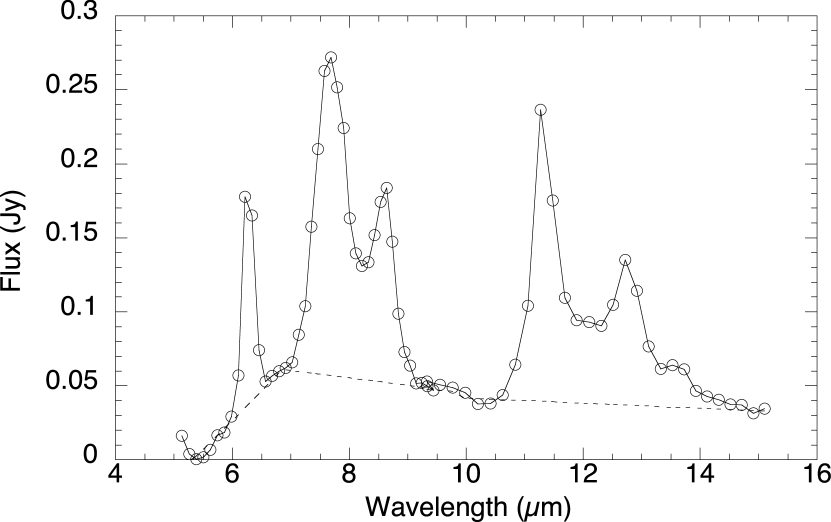
The emission spectra of the reflection nebulae shown in Figure 2 consists of three components, narrow emission features due to PAH molecules, broad features (6–9 and 11–14 m) due to the overlap of individual emission bands from a collection of PAHs, very large PAHs or PAH clusters, and a continuum rising to longer wavelengths attributed to very small grains (Sellgren et al., 1985; Cesarsky et al., 2000; Bregman et al., 1989b). Separating the components is difficult since the intrinsic band shapes are unknown. However, it is clear from examining the data that the emission at 7, 10, and 15 m does not decrease as quickly with increasing distance from the exciting stars as the narrow band emission. In the fainter outer regions of the nebulae, incorrect zodiacal light subtraction also contributes to this ”continuum”.
Since we are interested in the response of PAH ionization to a changing UV field, we have chosen to only include emission above a continuum level defined by fitting straight line segments between data points centered at 5.8, 7.0, 9.3, 10.0, and 14.9 m. This procedure removes both the contribution from very small grains and any residual spectral structure in the sky background that could affect the accuracy of the band intensities, primarily in the low intensity regions of the nebulae.
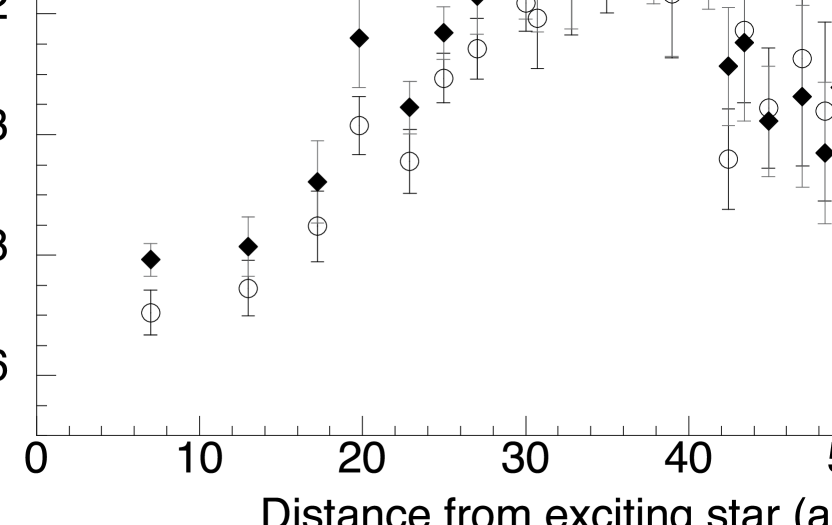
In vdB 17, we compared band ratios derived by integrating the band intensities of the 7.7 and 11.3 m bands with peak band intensity ratios. The integrated 7.7 m band includes all of the flux above the continuum between 6.8 and 9.1 m, and the integrated 11.3 m band includes the flux between 10.4 and 11.9 m. Figure 3 shows a comparison of the 11.3/7.7 m intensity ratio as a function of distance from the exciting star. Each point is an average of 10 pixels, and the error bars show the standard errors. Both methods produce curves with similar shapes for the 11.3/7.7 m intensity ratio, and the mean error for both methods is the same (about 3%). The peak band intensities are a factor of 3.35 higher than the integrated band ratios since the 7.7 m band is much broader than the 11.3 m band. The integrated 7.7 m band includes a band of unknown origin centered near 8 m that increases in strength towards the edges of the nebulae, adding to the integrated flux (Uchida et al., 2000). Since both methods produce the same result, we have chosen to use peak intensity ratios to avoid possible contamination by the 8 m feature.
3.3 Correlation of the wavelength of the “7.7” m band with other parameters
For each location in the nebulae, there is a strong correlation between the distance from the exciting star and the wavelength of the 7.7 m band. This is shown in Figure 4 as a function of the incident UV field, which is also a function of distance from the exciting star. The UV field intensity is generally denoted as , where =1 is the average value of the interstellar UV field and has a value of 1.610-3 ergs s-1 cm-2. Determining the UV field intensity at each point in a nebula is not necessarily straightforward since there is generally no information about the relative positions (in 3-D space) of the nebula and the exciting star. In most cases, authors have chosen to use the projected distance on the sky as the true distance for calculating the UV field intensities.
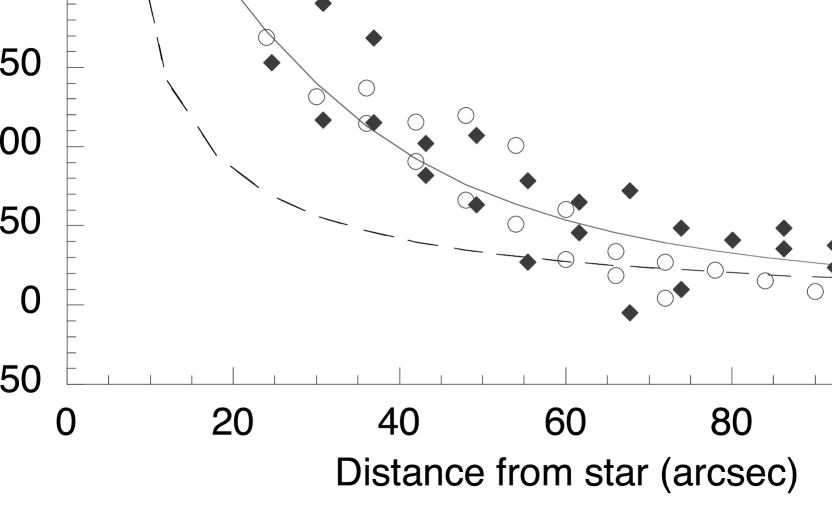
In the case of vdB 17, where the exciting star appears to be centered on the nebula, Uchida et al. (2000) assumed that the exciting star was embedded within the nebula, so that the UV intensity dropped off as r-2 where r is the projected distance on the sky. Witt & Schild (1986) point out that the brightest reflection nebulae have their exciting stars either within or behind the nebula, so the assumption that the star is within the nebulosity in vdB 17 seems reasonable. However, this assumption can be tested by examining the scattered light intenstiy of the nebula as a function of distance. In Figure 5 we show the radial brightness profile of a north-south cut through vdB 17 in both visible light (from the Palomar digital sky survey) and at the peak of the 7.7 m band. If the star is embedded within the nebulosity, and the nebula is spherical and has uniform density, then the light intensity should decrease with distance as shown by the dashed line in Fig. 5, which does not fit the data. If the nebula is highly flattened and the star is within the nebula, the falloff will be even faster. However, if the star is behind the nebula by a distance corresponding to 28″on the sky (21017 cm), and the nebula is flat and of uniform density, then the intensity profile can be fitted quite well (solid line in Fig. 5). Using this geometry gives a much smaller range for as a function of projected distance than that assumed by Uchida et al. (2000). Both geometries give low values of far from the star, but the geometry with the star behind the nebulosity also has relatively low values for the UV intensity close to the center of the nebula.
For vdB 133, the density is not uniform and we do not have a method for determining the relative geometry of the star and nebula. However, the star is some distance to the side of the nebulosity so that the calculated distance from the star to any point in the nebula is not as sensitive to the assumed geometry as in the case of vdB 17. For our discussion, we will take the projected distance of the star to the nebula as the true distance and use that for calculating the incident UV field. In NGC 1333 SVS3, the star appears centered in the nebulosity, but the density does not appear to be uniform. In this case, we have chosen to use the projected distance as the true distance, although this could introduce an error for points close to the star.
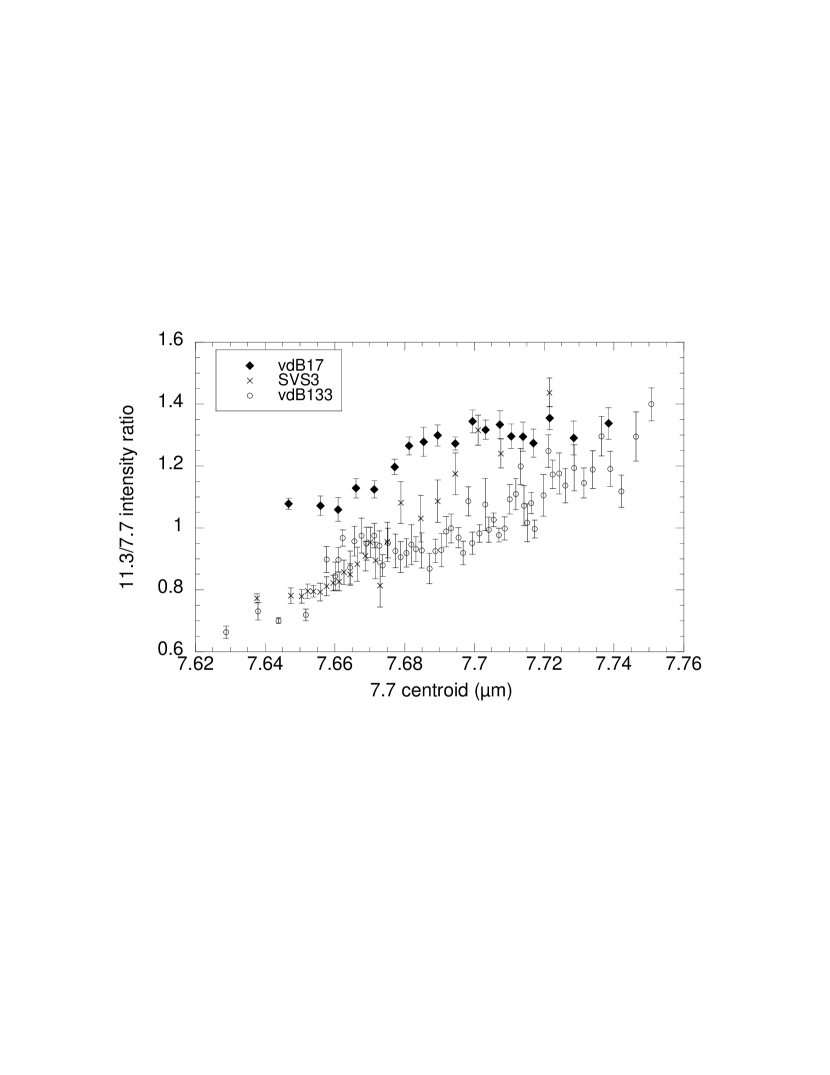
The wavelength of the 7.7 m band also correlates well with the intensity ratio of the 11.3 and 7.7 m bands (shown in Fig. 6 for vdB 17, vdB 133, and SVS3).
4 Discussion
Since the UV intensity changes by two orders of magnitude within each reflection nebula, and since the ratio of the UV intensity to the electron density, , determines the PAH ionization state, it is necessary to estimate both and within the nebulae before we can examine whether changes in the PAH ionization as a function of position within the nebulae can account for the observations. In the following sections, we will first discuss how we determined and for the nebulae, then model the observations in two different ways.
4.1 Expected ionization state of the PAHs
The PAH ionization state within a reflection nebula is a function of the ratio of the UV intensity to the electron density. The UV intensity is a function of the nebular geometry and the spectral type of the illuminating star, and the electron density can be determined roughly for these reflection nebulae by estimating the density of the gas within the nebulae. Joblin et al. (1996b) give an electron density of 15 e- cm-3 in NGC 1333 SVS3 based on a C/H ratio of 310-4, assuming that all of the electrons would come from ionization of neutral carbon, and an estimate of the gas density based on H2 emission (Joblin et al., 1996a). Owl et al. (2002) derive a density for SVS3 of 2104 (ne=6 cm-3) based on a PDR model and far IR measurements centered at the far IR peak intensity.
In the reflection nebula vdB 17 (also in the NGC 1333 region), the density can be estimated from the extinction through the nebula. Racine (1968) gives E(B-V)=0.6 for vdB 17, so that Av=1.8 magnitudes. Using the canonical column density value of NH/Av=1.91021 cm-2 magnitude-1 gives NH=3.41021 cm-2 along the line of sight to the star in vdB 17. We can derive a lower limit to the density by assuming that the nebula is spherical. The nebula has an apparent diameter of 100″, corresponding to 7.51017 cm at a distance of 500 pc (Strom et al., 1974). The average density is then 9.1103 cm-3, and the electron density (also assuming that the electrons are from carbon ionization) will be 2.7 cm-3. We already have stated that the exciting star is 28″behind the scattering nebulosity, so it is very likely that the thickness of the nebula along the line of sight is substantially less than 100″, perhaps by an order of magnitude, and that the electron density is correspondingly higher. Martini et at. (1999) derive a density of 1104 cm-3 (ne=3 cm-3) for vdB 17 based on molecular hydrogen line ratios. Warin et al. (1996) derive a density of 3103 cm-3 to 5104 cm-3 (ne=0.9–15 cm-3) based on CO line observations. Thus, while the electron density in vdB 17 is uncertain, it is probably in the range of 1–10 cm-3, and we will use 1 cm-3 for the following discussion.
For vdB 133, Li & Draine (2002) derive an electron density of 0.3 cm-3 based on a model fit to the PAH emission spectrum. We can estimate the average density in the same manner as we did for vdB 17, using the reddening to the nebula and its apparent size. Racine (1968) gives E(B-V)=0.65, the apparent projected extent of the nebulosity in the infrared is 120″, and it is at a distance of 1400 pc (Humphreys et al., 1978). Assuming that the nebula has the same extent along the line of sight as in the plane of the sky gives an average density of 1.4103 cm-3 and ne=0.4 cm-3. While both of these values are uncertain, we do not have any better methods of estimating the density in vdB 133, and will adopt a value of ne=0.3 cm-3 for the following discussion.
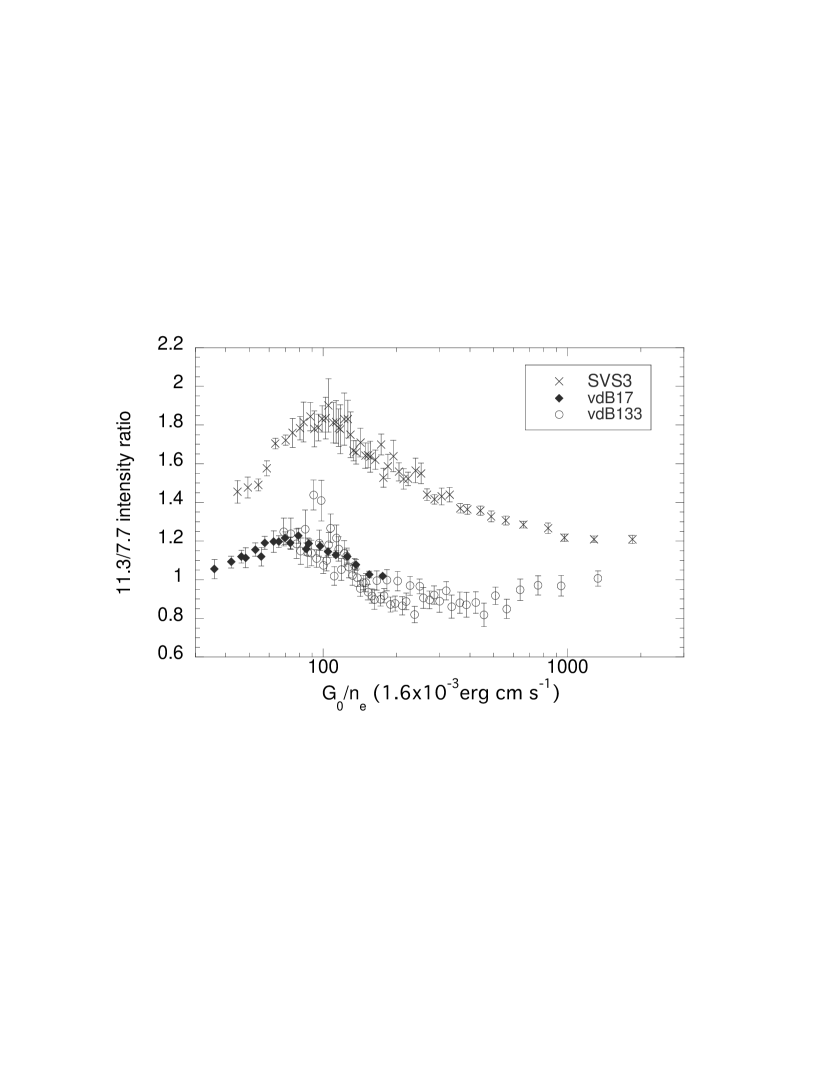
Using the value of for SVS3 given by Joblin et al. (1996a) and those given by Uchida et al. (2000) for vdB 17 and vdB 133, we can calculate as a function of distance in the nebulae. Fig. 7 shows the 11.3/7.7 m band ratio as a function of for the three nebulae. Each data point is an average of ten pixels and the error bars show the standard error of each group of ten. A constant value of 0.5 has been added to the SVS3 data for display purposes since it overlaps the data from the other two nebulae. Qualitatively, the observed trend is as expected for the 11.3/7.7 m band ratio since as increases, PAHs should transition from anions through neutrals to cations. Bakes et al. (2001) show that the strength of the 7.7 m band is a slowly changing function of , with a value 30% larger at =10 than at =1104. Their result is also consistent with our observation that the 7.7 m band tracks the scattered light intensity in vdB 17 (Fig. 5) which requires that most of the observed variation in the 7.7 m band intensity be due to re-emission of absorbed radiation rather than abundance variations. The 11.3 m band is strongest in neutral PAHs, so that the observed peak in the 11.3/7.7 m band ratio at =100 can be interpreted as the value of where there is a maximum in the abundance of neutral PAHs. This is about a factor of four lower than calculated by Bakes et al. (2001), which can simply be the result of Bakes et al. using too large a value for the PAH+ recombination coefficient. Chan et al. (2001) also preferred a low value for the recombination coefficient based on their measurements of relative PAH band intensities in the diffuse ISM. Thus, as decreases from 1000 to 100, the cation to neutral ratio drops. Below =100, anions are forming and the 11.3/7.7 m band ratio decreases. If this interpretation is correct, then it appears that PAHs transition almost directly from cations to anions with only a narrow range of where neutral PAHs are present, and that the abundance of neutral PAHs is never very high. This could also explain why the PAH emission spectrum doesn’t change very much from object to object as the anion and cation spectra are very similar in the mid-IR. However, even if the abundance of neutral PAHs is never very high, they can contribute significantly to the 11-14 m emission since these bands are much stronger in neutral PAHs than in PAH ions.
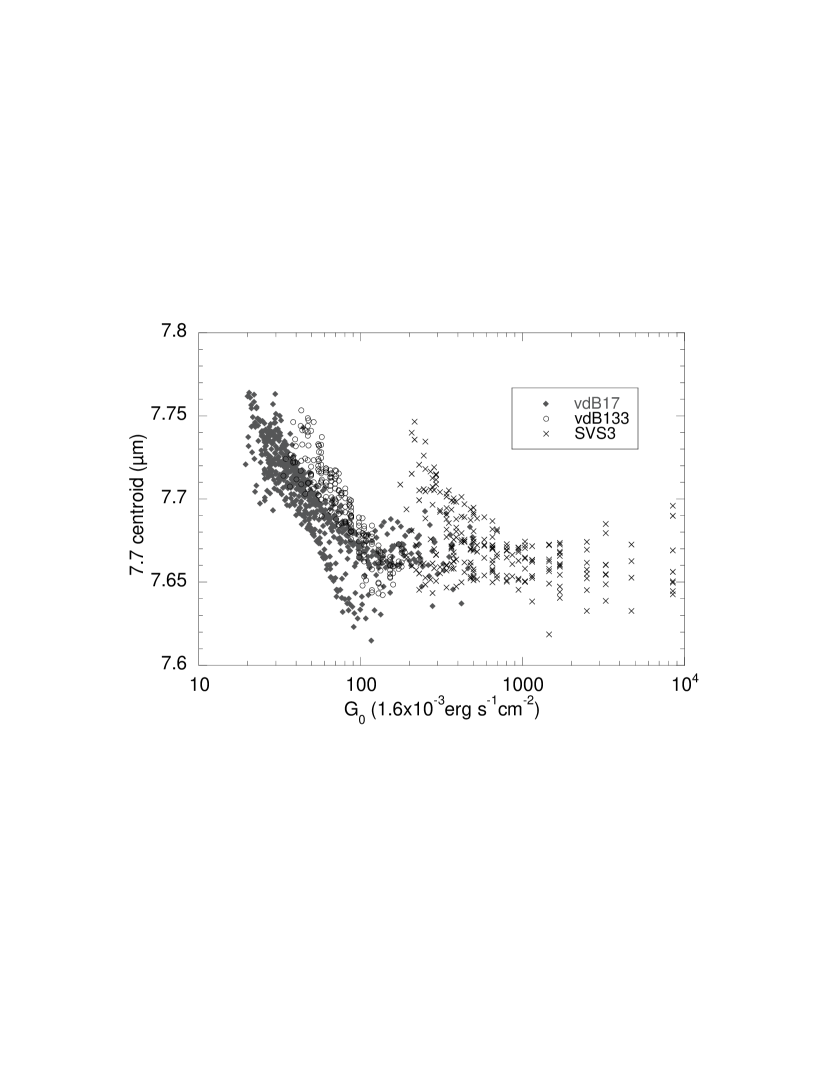
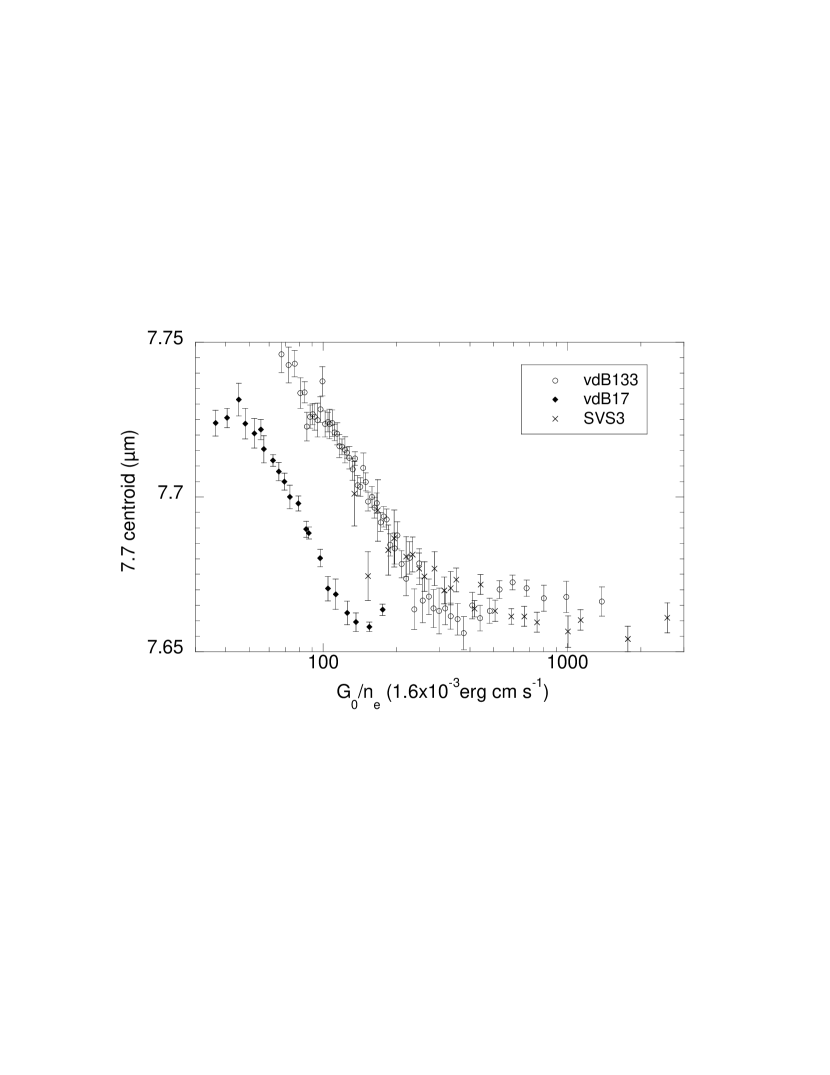
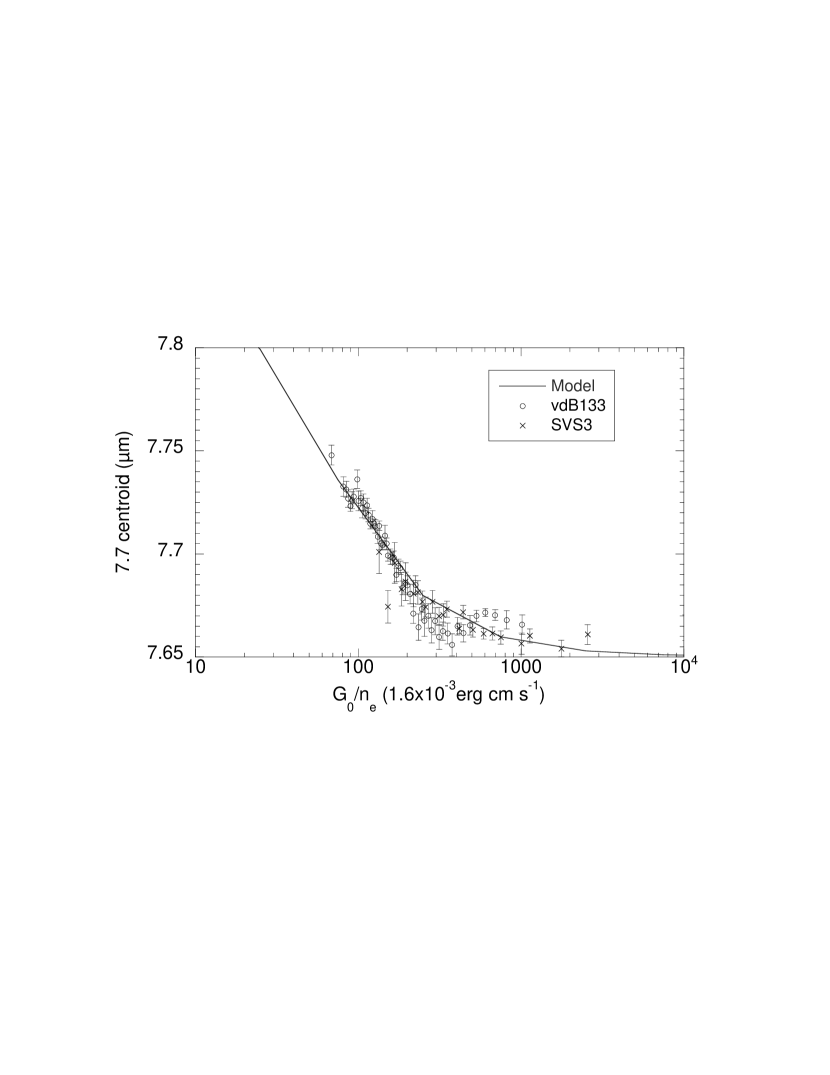
Fig. 8 shows the 7.7 m centroid plotted as a function of where each point plotted is the average of 10 pixels. The coincidence of the vdB 133 and SVS3 curves and the near coincidence (within a factor of two in ) of the vdB 17 curve, can be explained if the process that causes the band centroid to shift is a chemical equilibrium process. An example of such a process is detailed in the next section.
4.2 Modeling the PAH Emission Process 1: The Wavelength of the 7.7 m Band as an Indicator of the Anion/Cation Ratio
To explain the observed behavior, we can construct a simple model in which we will assume that anions have an emission band at 7.85 m while cations have an emission band at 7.65 m. Then we calculate the ionization balance between anions and neutrals and neutrals and cations separately assuming ionization equilibrium. Following Verstraete et al. (1990), the ionization balance between neutrals and cations can be expressed as
| (1) |
where is the number of neutral PAHs, is the ionization rate coefficient for neutral PAHs, is the number of singly ionized PAHs, is the electron density, and is the recombination coefficient for singly ionized PAHs. The ionization balance between anions and neutrals can be described by a similar equation. Rearranging the equation gives an expression for the fraction of PAHs that are singly ionized ().
| (2) |
where . The fraction of anions () is
| (3) |
where , is the rate for removing an electron from anionic PAHs, and is the attachment rate for electrons to neutral PAHs. The centroid of the 7.7 m band () is then
| (4) |
For a PAH molecule with 80 carbon atoms, Verstraete et al. (1990) give sec-1. Using this value, we then adjusted and the ratio until the 7.7 m centroid calculated as a function of fitted the data (solid line, Fig. 9). The fit requires a value for of cm-3sec-1, a factor of two less than that given by Verstraete et al. (1990), and a value of cm3 for , a factor of three less than the estimate given by Le Page, Snow, & Bierbaum (2001). Using these parameters, we calculated and as a function of , and the neutral fraction () as .
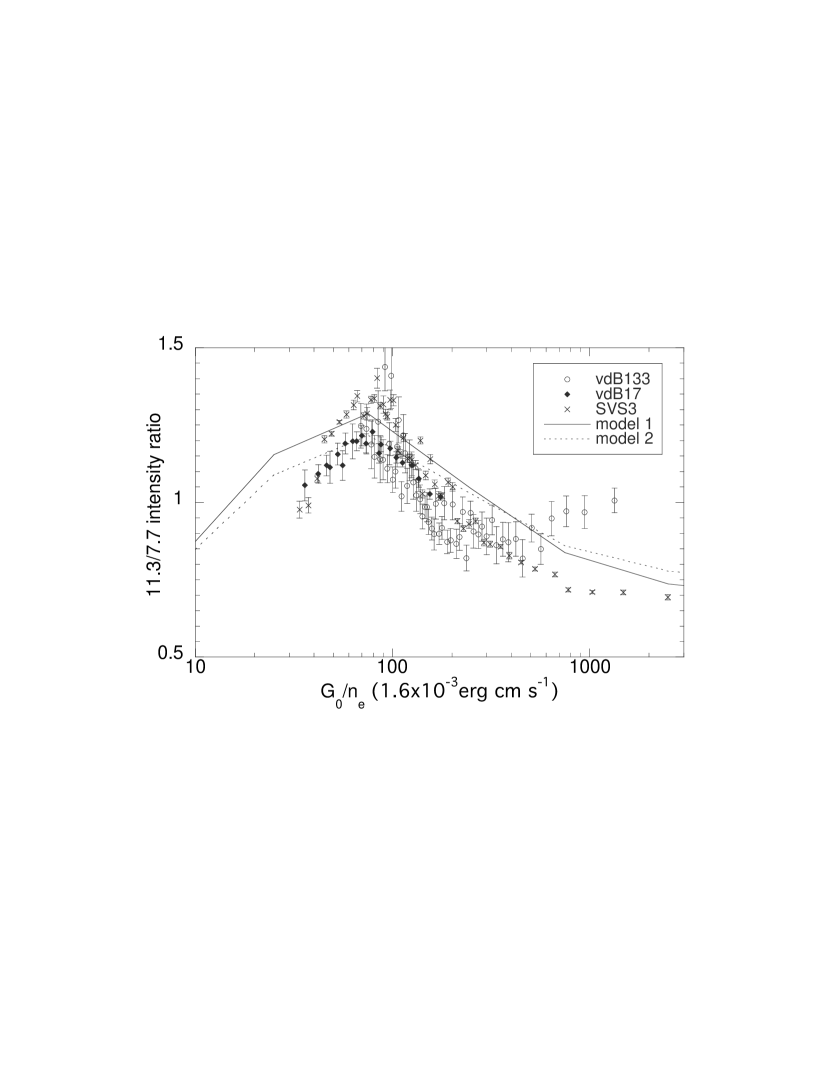
Given the PAH ionization state as a function of , we can also calculate the 11.3/7.7 m ratio as a function of if we know the intrinsic 7.7 and 11.3 m band strengths for anions, neutrals, and cations. The intrinsic band strengths are the average for the entire PAH population weighted by the abundance of each PAH, and will depend on the PAH mix present in each object and on the spectrum of the exciting UV field. For this calculation, we assume that the PAH mix does not change within an object, and that the intrinsic band strengths are the same as those calculated by Bakes et al. (2001). Then, the 11.3/7.7 m ratio is
| (5) |
and is shown as the solid line in Fig. 10 along with the data from the reflection nebulae. In addition, the dashed line shows the effects of reducing the intrinsic 11.3 m band intrinsic strength for neutrals by 20%. The agreement between the model and the data is fairly good, especially since we did not adjust any of the intrinsic band strengths to create a better fit (for example, a small decrease in the intrinsic 11.3/7.7 m band ratio for cations would result in a better fit for points with greater than 200 and a small increase for neutrals would give a better fit near ). The three points plotted at the lowest values of do not fit the model very well, but we have made the assumption here that the density is constant within the entire nebula and that there is no UV extinction internal to the nebula.
4.3 Modeling the PAH Emission Process 2: The Wavelength of the 7.7 m Band as an Indicator of PAH Processing
A second model that could fit the data assumes that the position of the 7.7 m band depends on the physical nature of the emitting PAHs rather than on the ionization state of the PAHs. Hony et al. (2002) suggested that PAH molecules are eroded by exposure to the interstellar UV field, and these physical changes are reflected in the relative strengths of the C–H out-of-plane bending modes. It is possible that the same physical changes cause the 7.7 m band to shift from 7.85 m, as observed in planetary nebulae, to 7.65 m, as observed in HII regions. The outer regions of reflection nebulae, where the band centroid is closer to 7.85 m, would contain a larger fraction of less eroded PAHs than the regions closer to the exciting star where the UV intensity is higher.
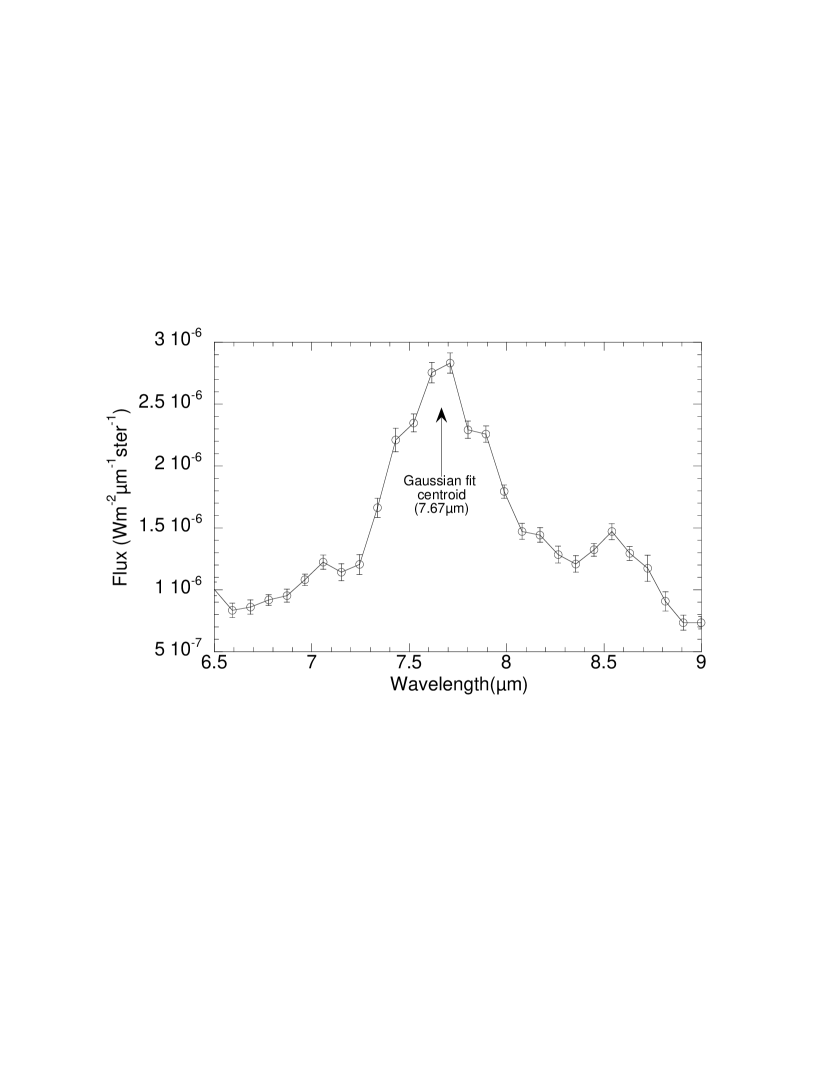
The molecular clouds from which reflection nebulae are born are formed from the gas and dust of the ISM, and in the scenario we are considering here, the PAHs leaving these clouds have a 7.7 m band centered near 7.85 m. We can determine the wavelength of the 7.7 m band for PAHs entering these clouds by examining the spectra of PAHs in the diffuse ISM. Mattila et al. (1996) used the ISOPHOT spectrometer (PHT-S) to take spectra of the galactic plane along lines of sight that avoided bright IR emission and optically bright stars. We averaged spectra taken at (l,b) of (-45,0), (-30,0), (-15,0), (-15,1), (-5,0), and (+30,0), all regions with obvious PAH emission, to produce the spectrum shown in Fig. 11. Using these data, we determined the position of the 7.7 m band in the diffuse ISM, finding that its centroid occurs at 7.67 m, the same wavelength (within the precision possible with the low resolution spectra from ISOPHOT) as found in HII regions and reflection nebulae, implying that material entering HII regions and the dark clouds from which reflection nebulae form have 7.7 m bands centered near 7.65 m.
In this model, PAHs are chemically altered during the time that the PAH molecules reside within the dark cloud, and molecules are formed that are similar to the fresh PAHs observed around planetary nebulae. It is these chemically altered molecules that have a strong 7.85 m band and are most abundant at positions in the reflection nebulae that are farthest from the exciting stars, and thus have suffered the least amount of cumulative UV exposure. Nearer to the exciting stars, the PAHs are processed as they are during residence in the ISM, and the 7.65 m band becomes more prominent. Fig. 4 shows that as the UV field intensity increases, the band centroid shifts to shorter wavelengths. For vdB 133, the band centroid shift occurs as increases from 20 to about 100, but then remains constant at about 7.65 m for larger values of , while in SVS3, the transition to a constant value occurs at about a of 700. This is the behavior expected if the PAHs are fully reprocessed by the UV exposure for intensities above =100 (for vdB 133, or 700 for SVS3) since once all the material is converted to the form with a strong 7.65 m band, it will not appear to shift any further. The behavior in vdB 17 mirrors that in vdB 133. If the above explanation is correct, then we expect that the UV exposure that PAHs experience before they are ejected into the ISM plus the exposure within the ISM should be comparable to the exposure they suffer in these reflection nebulae. Assuming a residence time in the ISM of 1107 years, and where by definition =1, the total UV exposure can be expressed as the product of these two values, or 1107 in units of years. The UV exposure of a PAH before it is ejected from a planetary nebula is more difficult to estimate. PAHs are likely formed during the mass-loss phase of carbon-rich stars and then modified by exposure to UV radiation to produce the PAH spectrum characteristic of planetary nebulae. The 7.85 m component is usually stronger than the 7.65 m component in planetary nebulae, but there is a wide range observed in the ratio of the two components. For example, in BD +30∘3639 the 7.85 m component is dominant while in NGC 7027, the two components are almost of equal strength (Peeters et al., 2002). The emitting PAHs are at the edges of the ionized region (within the surrounding photo-dissociation region), and if they have experienced the same UV field for the lifetime of the nebulae, then the total UV exposure in the two objects is similar (510 years). However, the actual exposure is certainly less than this value since in the past the ionized region was smaller and the PAHs that are now visible were shielded by material closer to the central star. Thus, the PAHs that are present in the ISM likely have a cumulative UV exposure of a few 107 years.
To determine the UV exposure of PAHs in the reflection nebulae, it is necessary to estimate the age of the nebulae. Both vdB 17 and SVS3 are in the NGC 1333 complex, which includes a star cluster with an age of 1–2106 years (Lada et al., 1996). Joblin et al. (1996a) adopted an age of 1105 years for SVS3. The reflection nebulae must be somewhat younger than the stars since they formed only after the stars broke out of the dark cloud. Also, there is no reason why both nebulae should have the same age. SVS3 is more compact than vdB 17 and probably has a higher density, perhaps indicating that it is younger. Using 1105 years for the age of SVS3 gives a range for the cumulative UV exposure of the PAHs of 1107 to 1109 for =100 to 10,000, with the PAHs showing no change in the 7.7 m centroid position above =700, corresponding to a UV exposure of 7107 years. For vdB 17, an age of 1105 gives an exposure of from 2106 to 2107 years for =20 to 200, and an exposure ten times higher if the age is 1106 years. In both of these objects, the cumulative UV exposure of the PAHs is comparable to the UV exposure of PAHs in the diffuse ISM. The near coincidence of vdB 17 and vdB 133 in Fig. 4 then implies that these two objects have similar ages.
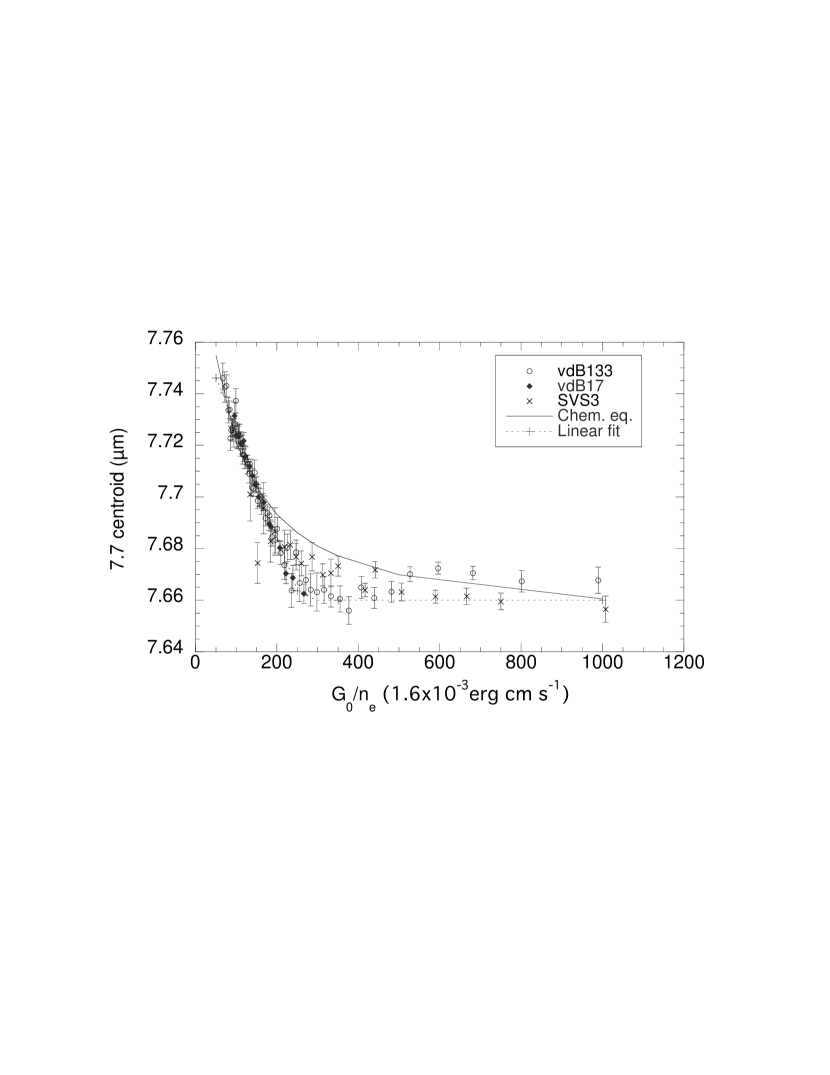
Fig. 12 shows two model fits to the 7.7 m centroid as a function of . If UV processing of the PAHs causes the wavelength shift, then the shift could be linear with exposure (time) if it is due to an irreversible reaction (dotted line) such as loss of side groups (Joblin et al., 1996a). However, in this case the co-alignment of the curves when plotted vs would not be expected unless density is linearly related to the age of the nebulae. If the shift is due to a reversible reaction (ie. loss of H), then it should scale as and follow the solid curve. Thus, while this curve may not fit as well as a linear fit, the co-alignment of the data from the three nebulae is a consequence of the equilibrium reaction process. In this plot, the vdB 17 data has been shifted to larger by about a factor of two, which is equivalent to lowering the density by a factor of two.
4.4 Comparison of the models
Changes in the ionization balance of PAHs provides a good explanation for the changing ratio of the 11.3 to 7.7 m features, and this explanation is supported by models (Bakes et al., 2001) and from fitting laboratory spectra to astronomical sources (Allamandola et al., 1999). Thus, the shift of the 7.7 m feature could be simply explained if anionic PAHs have a feature at 7.85 m while cationic PAHs have a feature at 7.65 m. However, there is no evidence, either from theoretical spectral calculations or from laboratory spectra, that the PAH ionization state has an effect on the position of the 7.7 m band. This may simply mean that spectra of the appropriate PAH ions do not yet exist.
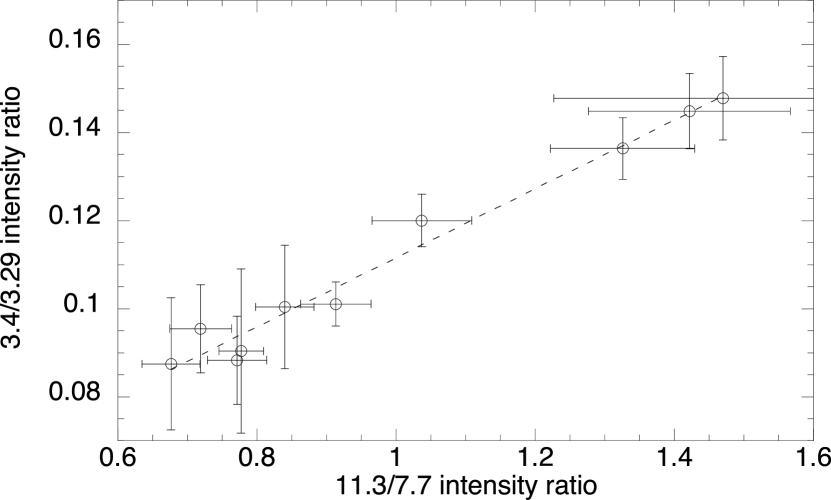
The alternate explanation, that the shift of the 7.7 m band is due to chemical modification of the PAH population, is supported in two ways. First, Hony et al. (2002) show that as PAHs are exposed to UV radiation, the solo, duo, and trio out-of-plane C-H modes in the 11–13 m region change in a manner that can be explained by erosion of the edges of the molecules. Secondly, Joblin et al. (1996a) and Sloan et al. (1997) showed that in SVS3, the 3.4/3.3 m band intensity ratio increases with increasing distance from the exciting star. We show the data from Sloan et al. (1997) as a function of the 11.3/7.7 m band intensity ratio (an indicator of PAH ionization) in Fig. 13. Joblin et al. (1996a) showed that the 3.4 m band is due to -CH3 sidegroups on PAH molecules that are lost upon exposure to UV radiation with a corresponding decrease in the 3.4/3.3 m band intensity ratio. Thus, Fig. 13 shows that chemical evolution of PAH molecules and the ionization state of the molecules can be well correlated. We conclude that the present data does not rule out either explanation.
5 Conclusions
We have observed a shift in the central wavelength of the 7.7 m band within three reflection nebulae. Previous observations had established that the 7.7 m band has a strong component near 7.85 m in fresh PAH material (e.g. around planetary nebulae), while PAHs that have been exposed to the UV of the ISM for long periods (e.g. HII regions, diffuse ISM) are dominated by a band near 7.65 m. In the reflection nebulae studied here, the wavelength of the feature occurs at longer wavelengths at points distant from the exciting stars in the nebulae, and at progressively shorter wavelengths for points closer to the stars. We also observe that the 11.3/7.7 m band ratio changes as a function of in a manner consistent with changes in PAH ionization.
The shift of the 7.7 m band position can be explained either as a result of changes in the anion to cation ratio (assuming that anions have a strong band at 7.85 m and cations have a strong band at 7.65 m) or as an indicator of UV processing of the PAH mixture. In the second scenario, PAHs enter a dark cloud with a 7.65 m band center and are chemically processed on grain surfaces, causing a shift of the band to 7.85 m. Upon exposure to UV radiation, the PAHs are modified back to the form they had in the diffuse ISM and the band shifts back to 7.65 m.
References
- Abouelaziz et al. (1993) Abouelaziz, H., Gomet, J. C., Pasquerault, D., et al. 1993, J. Chem. Phys., 99, 237.
- Allamandola et al. (1985) Allamandola, L. J., Tielens, A. G. G. M., & Barker, J. R. 1985, ApJ, 290, L25
- Allamandola et al. (1999) Allamandola, L. J., Hudgins, D. M., & Sandford, S. A. 1999, ApJ, 511, L115
- Bakes et al. (2001) Bakes,E.L.O., Tielens,A.G.G.M., & Bauschlicher,C.W.,Jr. 2001 ApJ, 556, 501
- Bernstein et al. (1999) Bernstein,M.P., Sandford,S.A., Allamandola,L.J. et al. 1999, Science, 283, 1135
- Bernstein et al. (2002) Bernstein,M.P., Elsila,J.E., Dworkin,J.P. et al. 2002, ApJ, 576, 1115
- Biviano et al. (2000) Biviano A., Sauvage M., Gallais P., et al., 2000, Experimental Astronomy, 10, 255
- Bregman (1989a) Bregman, J. D. 1989, in Interstellar Dust, IAU Symp., 135, 109
- Bregman et al. (1989b) Bregman, J.D., Tielens, A.G.G.M., Allamandola, L.J., Geballe, T., and Witteborn, F.C. 1989, ApJ, 344, 791
- Bregman & Temi (2001) Bregman, J.D., and Temi. P. 2001, Ap.J, 554, 126
- Brooke et al. (1996) Brooke,T.Y., Sellgren,K., & Smith,R.G. 1996, ApJ, 459, 209
- Cesarsky et al. (1996) Cesarsky C.J., Abergel A., Agnese P., et al., 1996, A&A, 315 L32
- Cesarsky et al. (2000) Cesarsky, D., Lequeux, J., Ryter, C., and Gerin, M. 2000, A&A, 354, L87
- Chan et al. (2001) Chan, K. W., Roellig, T. L., Onaka, T., et al., 2001 ApJ, 546, 273
- Cohen et al. (1989) Cohen, M., Tielens, A. G. G. M., Bregman, J., et al. 1989, ApJ, 341, 246
- Genzel et al. (1998) Genzel, R., Lutz, D., Sturm, E., et al. 1998, ApJ, 498, 579
- Hony et al. (2002) Hony S., Van Kerckhoven, C., Peeters, E., et al. 2001, A&A, 370, 1030
- Humphreys et al. (1978) Humphreys, R. M. 1978, ApJS, 38, 309
- Joblin et al. (1996a) Joblin,C., Tielens,A.G.G.M., Allamandola,L.J., & Geballe,T.R. 1996a, ApJ, 458, 610
- Joblin et al. (1996b) Joblin,C., Tielens,A.G.G.M., Geballe,& T.R., Wooden,D.H. 1996b, ApJ, 460, L119
- Kessler et al. (1996) Kessler, M. F., Steinz J. A., Anderegg M.E., et al. 1996, A&A, 315, L27
- Lada et al. (1996) Lada,C.J., Alves,J., Lada,E.A. 1996, AJ, 111, 1964
- Li & Draine (2002) Li, Aigen, and draine, B. T. 2002, ApJ, 572, 232
- Leger & Puget (1984) Leger, A., & Puget, J. L. 1984, A&A, 137, L5
- Le Page, Snow, & Bierbaum (2001) Le Page, V., Snow, T. P., & Bierbaum, V. M. 2001, ApJS, 132, 233
- Mattila et al. (1996) Mattila,K., Lemke,D., Haikala,L.K., et al. 1996, A&A, 315L, 353
- Martini et at. (1999) Martini,P., Sellgren,K., & DePoy,D.L. 1999, ApJ, 526, 772
- Ott et al. (1997) Ott S., Abergel A., Altieri, B., et al., 1997, In: Hunt G., Payne H.E. (eds.) Astronomical Data Analysis Software and Systems. ASP Conf.Ser. 125, 34 1997
- Owl et al. (2002) Owl, R. C. Y., Meixner, M. M., Fong, D. et al. 2002, ApJ, 578, 885
- Peeters et al. (2002) Peeters, E., Hony, S., Van Kerckhoven, C., et al. 2002, A&A, 390, 1089
- Racine (1968) Racine,R. 1968, AJ, 73, 233
- Roche et al. (1991) Roche, P .F., Aitken, D. K., Smith, C. H., & Ward, M. J. 1991, Mon. Not. R. Astr. Soc., 248, 606
- Sellgren et al. (1985) Sellgren, K., Allamandola, L. J., Bregman, J. D., Werner, M. W., and Wooden, D. H. 1985, ApJ, 299, 416
- Sellgren et al. (1995) Sellgren,K., Brooke,T.Y., Smith,R.G., & Geballe,T.R. 1995, ApJ, 449L, 69
- Sloan et al. (1997) Sloan,G.C., Bregman,J.D., Geballe,T.R., Allamandola,L.J., and Woodward, C.E. 1997, ApJ, 474, 735
- Sloan et al. (1997) Sloan, G. C., Bregman, J. D., Allamandola, L. J., et al. 1997, BAAS, 29, 787
- Sloan et al. (1999) Sloan,G.C., Hayward,T.L., Allamandola,L.J., et al. 1999, ApJ, 513L, 65
- Strom et al. (1974) Strom, S. E., Grasdalen, G. L., and Strom, K. M. 1974, ApJ, 191, 111
- Uchida et al. (2000) Uchida,K.I., Sellgren,K., Werner,M.W., & Houdashelt,M.L. 2000, ApJ, 530, 817
- Verstraete et al. (1990) Verstraete, L., Leger, A., d’Hendecourt, L., et al., 1990, A&A, 237, 436
- Warin et al. (1996) Warin, S., Castets, A., Langer, W. D., et al. 1996, A&A, 306, 935
- Witt & Schild (1986) Witt,A.N., & Schild,R.E. 1986, ApJS, 62, 839