Confirmation of Errors in Hipparcos Parallaxes from HST/FGS Astrometry of the Pleiades111Based on observations made with the NASA/ESA Hubble Space Telescope, obtained at the Space Telescope Science Institute, which is operated by the Association of Universities for Research in Astronomy, Inc., under NASA contract NAS5-26555.
Abstract
We present absolute trigonometric parallaxes and relative proper motions for three members of the Pleiades star cluster, obtained with HST’s Fine Guidance Sensor 1r, a white-light interferometer. We estimate spectral types and luminosity classes of the stars comprising the astrometric reference frame from spectra, VJHK photometry, and reduced proper motions. From these we derive estimates of absolute parallaxes and introduce them into our model as observations with error. We constrain the three cluster members to have a dispersion in distance less than 6.4 pc, and find an average = 7.43 0.17 0.20 milliseconds of arc, where the second error is systematic due to member placement within the cluster. This parallax corresponds to a distance of pc or a distance modulus of for these three Pleiads, presuming a central location. This result agrees with three other independent determinations of the Pleiades distance. Presuming that the cluster depth systematic error can be significantly reduced because of the random placement of these many members within the cluster, these four independent measures yield a best-estimate Pleiades distance of milliseconds of arc, corresponding to a distance of pc or a distance modulus of . This resolves the dispute between the main sequence fitting and the Hipparcos distance moduli in favor of main sequence fitting.
Subject headings:
astrometry — interferometry — stars: distances — stars: clusters — distance scale1. The Problem
Our knowledge of the life histories of stars relies on models whose fidelity is ultimately tested by appeal to real stars. The Sun provides the most basic calibration of these models, of course, because it is only for the Sun that an accurate age exists and for which the mass, temperature, composition, and structure are known with precision, accuracy, and completeness. Clusters of stars are also fundamental for constructing models because we can assume that all the cluster’s members are of the same age and composition, even if other parameters are more loosely constrained.
Preeminent among clusters is the Pleiades, and much effort has gone into determining the absolute parallax of this cluster. ESA’s Hipparcos mission brought the benefits of space observing to astrometry to produce precise positions, proper motions, and parallaxes for nearly all stars brighter than . Before Hipparcos, the distance to the Pleiades was too large for ground-based parallaxes to yield a good distance, so the best estimates were derived by comparing the main sequence of the Pleiades to a main sequence constucted from nearby stars with large parallaxes. A small correction for evolution is necessary (the Pleiades is about 100 Myr old (Pinsonneault et al., 1998) while the nearby field stars are typically as old as the Sun), but the Pleiades appears to have essentially the same elemental abundances as the Sun (Boesgaard & Friel, 1990), obviating a need for a metallicity correction such as is needed, for example, for the Hyades.
In addition to its primary program, Hipparcos included stars in several of the nearest open clusters in order to resolve the “Hyades distance problem” once and for all, and to similarly calibrate other clusters. The result obtained by Hipparcos for the Pleiades (van Leeuwen, 1999) was a complete surprise, yielding a distance modulus of magnitude, to be compared to a modulus of from main sequence fitting (Pinsonneault et al., 1998). Taken at face value, the Hipparcos result means that stars in the Pleiades are about 0.23 magnitude fainter than otherwise similar stars of the solar neighborhood. This large discrepancy has forced a careful reexamination of the assumptions and input parameters of the stellar models, as well as a thorough study of the Hipparcos data itself and potential errors in it. The controversy has not been fully resolved in that builders of star models find that the changes in physics or input parameters needed to account for the Hipparcos distance are too radical to be reasonable while the Hipparcos team has resolutely defended the Hipparcos result. With no clear reconciliation of these divergent views, we felt it worthwhile to reobserve some stars in the Pleiades in the traditional method of parallax astrometry—highly precise measurements of stellar positions relative to nearby reference stars—by taking advantage of the extraordinary precision achieveable with Fine Guidance Sensor 1r on the Hubble Space Telescope.
This project began as an effort to resolve known Pleiades spectroscopic binaries into visual binaries so that we could both obtain an accurate distance and calibrate the Zero-Age Main Sequence with known masses. We did not succeed in resolving the spectroscopic binaries, nor would our measurement of the Pleiades parallax by itself resolve the problem raised by Hipparcos, but our measurement in concert with other recent independent measurements of the Pleiades distance clearly and unambiguously shows that the Hipparcos parallax is wrong and that traditional main sequence fitting results in reliable estimates. To avoid repetition, we will discuss the work to date in detail in our discussion.
2. Observations and Data Reduction
| Set | MJD | Roll aaSpacecraft roll as defined in Chapter 2, FGS Instrument Handbook (Nelan & Makidon, 2001) | bbAverage of 2 to 5 observations at each epoch. Internal errors are on order 0.005 magnitude per observation set. | ||
|---|---|---|---|---|---|
| (degrees) | 3030 | 3063 | 3179 | ||
| 1 | 51770.65507 | 284.046 | 14.03 | 13.54 | 10.05 |
| 2 | 51783.6811 | 284.046 | 14.00 | 13.56 | 10.06 |
| 3 | 51957.17546 | 103.014 | 14.00 | 13.47 | 10.08 |
| 4 | 51968.37565 | 103.014 | 14.01 | 13.57 | 10.09 |
| 5 | 52128.77383 | 284.046 | 13.97 | 13.58 | 10.07 |
| 6 | 53053.24519 | 113.021 | 14.00 | 13.44 | 10.08 |
| 14.00 | 13.53 | 10.07 | |||
| 0.02 | 0.06 | 0.01 |
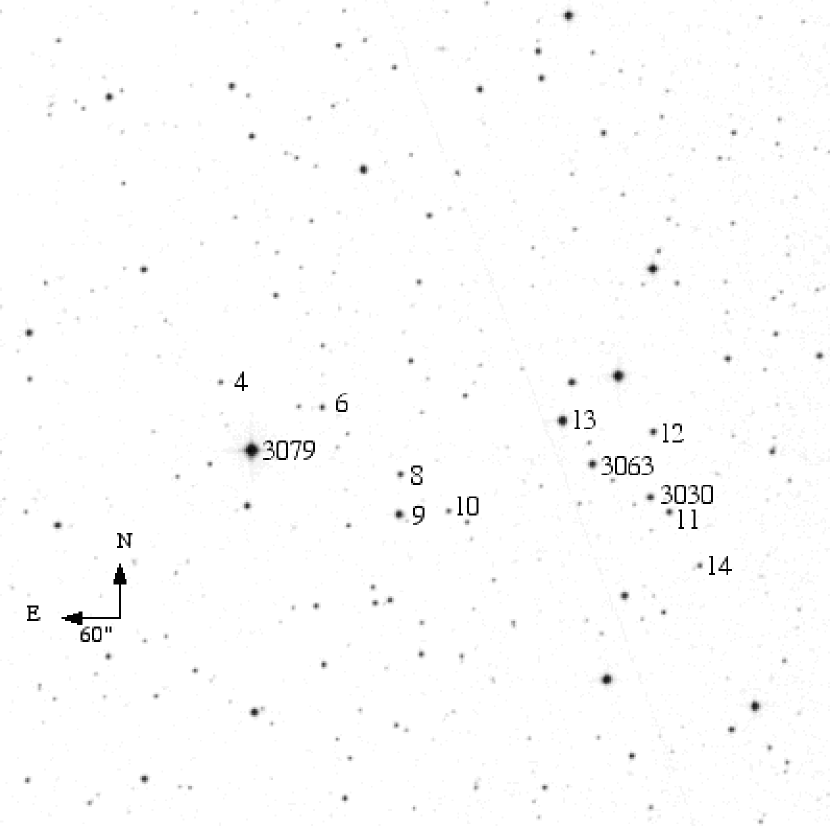
Six sets of astrometric data were acquired with HST, spanning 3.51 years, for a total of 135 measurements of the three Pleiads and nine reference stars. The three Pleiades targets were H ii 3030, 3063, and 3179, identified hereafter by their Hertzsprung (1947) numbers. Table 1 lists the epochs of observation and measured FGS -band photometry of the three Pleiads. Each data set required approximately 33 minutes of spacecraft time. The reductions and calibrations are detailed in Benedict et al. (2002a), Benedict et al. (2002b), and McArthur et al. (2001). At each epoch we measured both the reference stars and the target multiple times in order to to correct for intra-orbit drift of the type seen in the cross filter calibration data shown in Figure 1 of Benedict et al. (2002a). Figure 1 shows the distribution of the reference stars (4–14) and the presumed Pleiads (3030, 3063, and 3179) on a second-generation -band image, obtained from the Digital Sky Survey (http://stdatu.stsci.edu/dss/).
Bradley et al. (1991) and Nelan & Makidon (2001) provide an overview of HST’s Fine Guidance Sensors, and Benedict et al. (2002b) describe the fringe tracking (POS) mode astrometric capabilities of an FGS, along with data acquisition and reduction strategies also used in the present study. Times of observation use a modified Julian Date, MJD = JD 2444000.5.
We obtained observations at each of the two maximum parallax factors. This leads to the two distinct spacecraft roll angles shown which result from the requirement to keep HST’s solar panels fully illuminated throughout the year. This roll constraint generally imposes alternate orientations at each time of maximum positive or negative parallax factor over a typical 2.5 year parallax campaign, allowing a clean separation of parallax and proper motion signatures. As noted, our original intent was to determine orbital parameters for some known spectroscopic binaries, but once resolution of the binary did not work out we changed this dynamical parallax experiment to a standard parallax program. The most recent data set extended our time span by 2.5 years, significantly improving the accuracy of our final parallaxes and the precision of our final proper motion values.
3. Absolute Parallaxes for the Reference Stars
Because the parallax determined for the three Pleiades members is measured with respect to reference frame stars which have their own parallaxes, we must either apply a statistically-derived correction from relative to absolute parallax (van Altena, Lee, & Hoffleit (1995), hereafter YPC95), or estimate the absolute parallaxes of the reference frame stars. In principle, the colors, spectral type, and luminosity class of a star can be used to estimate the absolute magnitude, , and -band absorption, . The absolute parallax is then simply,
| (1) |
The luminosity class is generally more difficult to estimate than the spectral type (temperature class), yet the derived absolute magnitudes are critically dependent on the assumed luminosity. As a consequence, we use as much additional information as possible in an attempt to confirm the luminosity classes. Specifically, we obtained 2MASS photometry and UCAC2 proper motions for a one-degree-square field containing Figure 1, and then iteratively employ the technique of reduced proper motion (Yong & Lambert (2003), Gould & Morgan (2003)) in an effort to discriminate between giants and dwarfs.
3.1. Reference Star Photometry
| ID | |||||
|---|---|---|---|---|---|
| 3179 | 10.07 | ||||
| 3063 | 13.54 | ||||
| 3030 | 14.00 | ||||
| ref-4 | 15.66 | ||||
| ref-6 | 14.56 | ||||
| ref-8 | 14.48 | ||||
| ref-9 | 13.60 | ||||
| ref-10 | 15.85 | ||||
| ref-11 | 14.63 | ||||
| ref-12 | 14.23 | ||||
| ref-13 | 13.15 | ||||
| ref-14 | 15.48 |
Our bandpasses for reference star photometry include: (from FGS 1r), and JHK (from 2MASS111The Two Micron All Sky Survey is a joint project of the University of Massachusetts and the Infrared Processing and Analysis Center/California Institute of Technology ). The 2MASS JHK values have been transformed to the Bessell & Brett (1988) system using the transformations provided in Carpenter (2001). Table 2 lists VJHK photometry for the target and reference stars indicated in Figure 1.
3.2. Reference Star Spectroscopy
The spectra from which we estimated spectral type and luminosity class come from Lick Observatory222Lick Observatory is owned and operated by the University of California.. The resolution was approximately, with coverage from 3900 Å to 6700 Å. Classifications used a combination of template matching and line ratios. Spectral types for the stars are good to about 2 subclasses. Table 4 lists the spectral types and luminosity classes for our reference stars. The estimated classification uncertainties are used to generate the values in that table.
3.3. Interstellar Extinction
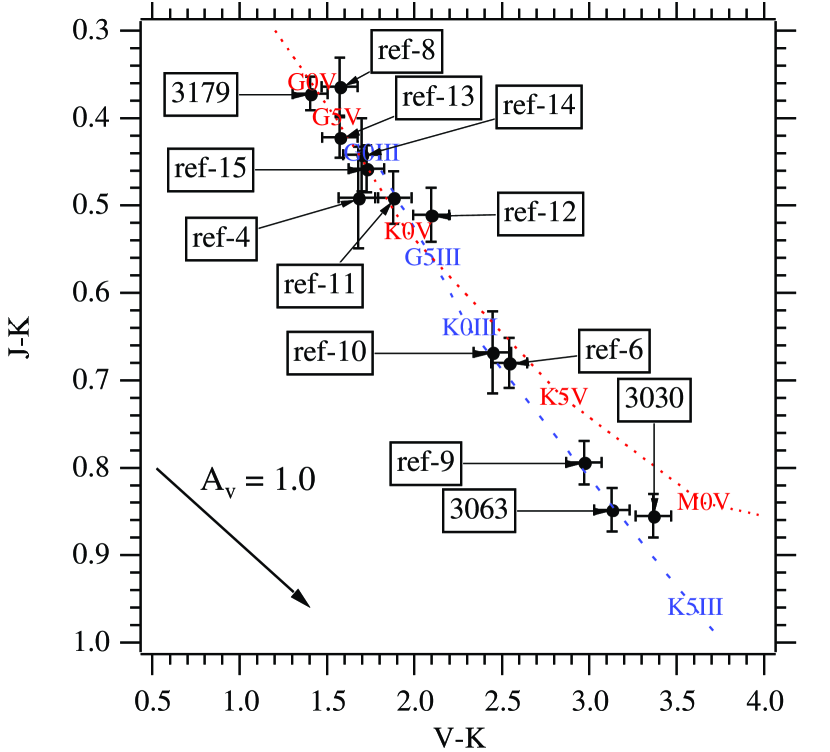
To determine interstellar extinction, we first plot these stars in a vs. diagram. A comparison of the relationships between spectral type and intrinsic color against those we measured provides an estimate of reddening. Figure 2 shows this color-color diagram and a reddening vector for . Also plotted are mappings between spectral type and luminosity classes V and III from Bessell & Brett (1988) and Cox (2000) (hereafter AQ2000). Figure 2, along with the estimated spectral types, provides an indication of the reddening for each reference star.
| ID | SpT | aa | |||
|---|---|---|---|---|---|
| ref-4 | G5V | 1.55 | 1.68 | 0.13 | 0.14 |
| ref-6 | K1IV | 2.32 | 2.54 | 0.22 | 0.24 |
| ref-8 | G3V | 1.45 | 1.57 | 0.12 | 0.13 |
| ref-9 | K2III | 2.70 | 2.97 | 0.27 | 0.30 |
| ref-10 | K1IV | 2.32 | 2.45 | 0.13 | 0.14 |
| ref-11 | G8V | 1.80 | 1.88 | 0.08 | 0.09 |
| ref-12 | K0V | 1.96 | 2.10 | 0.13 | 0.15 |
| ref-13 | G3V | 1.45 | 1.57 | 0.12 | 0.13 |
| ref-14 | G5V | 1.55 | 1.70 | 0.15 | 0.16 |
| ID | Sp. T. | V | MV | AV | m-M | (mas) |
|---|---|---|---|---|---|---|
| ref-4 | G5V | 15.68 | 5.1 | 0.14 | ||
| ref-6 | K1IV | 14.5 | 3.4 | 0.23 | ||
| ref-8 | G3V | 14.48 | 4.8 | 0.14 | ||
| ref-9 | K2III | 13.61 | 0.5 | 0.23 | ||
| ref-10 | K1IV | 15.85 | 3.4 | 0.23 | ||
| ref-11 | G8V | 14.63 | 5.6 | 0.14 | ||
| ref-12 | K0V | 14.24 | 5.9 | 0.14 | ||
| ref-13 | G3V | 12.14 | 4.8 | 0.14 | ||
| ref-14 | G5V | 15.48 | 5.1 | 0.14 |
Assuming an Galactic reddening law (Savage & Mathis, 1979), we derive values by comparing the measured colors (Table 2) with intrinsic colors from Bessell & Brett (1988) and AQ2000. Specifically, we estimate from , derived from the Savage & Mathis (1979) reddening law. The resulting values are collected in Table 3. Colors and spectral types of these reference stars are consistent with a field-wide average , far less than the maximum reddening, , determined by Schlegel et al. (1998). For the stars classified as dwarfs, , in good agreement with a recent determination of = 0.12 for the Pleiades (Hainline et al., 2001). The more distant non-dwarfs have .
The technique of reduced proper motions can confirm the reference stars’ estimated luminosity classes, but the precision of existing proper motions for all the reference stars was so low that only suggestive discrimination between giants and dwarfs was possible. Typical uncertainties for , a parameter equivalent to absolute magnitude, , were about a magnitude. Nonetheless, a reduced proper motion diagram does suggest that ref-6, -9, and -10 are not dwarf stars, since they are considerably redder in than the other stars classified as dwarfs. Giants are typically redder in than dwarfs for a given spectral type (AQ2000). Our luminosity class uncertainty is reflected in their input spectrophotometric parallax errors (Table 4). We will revisit this additional test in Section 4.1, once we have solved for higher precision proper motions.
3.4. Adopted Reference Frame Absolute Parallaxes
We derive absolute parallaxes with values from AQ2000 and the derived from the photometry. Our adopted errors for are 0.7 mag for the dwarfs and from 0.7 to 2 mag for the non-dwarf reference stars. These are somewhat larger than we have used in the past (Benedict et al. (2002a), Benedict et al. (2002b), McArthur et al. (2002)), but justified given our far smaller set of spectrophotometric data. Our parallax values are listed in Table 4. Individually, no reference star absolute parallax is better determined than = 32%. The average absolute parallax for the reference frame is mas. As a check, we compare this to the correction to absolute parallax discussed and presented in YPC95 (Sec. 3.2, Fig. 2). Entering YPC95, Fig. 2, with the Pleiades Galactic latitude, , and average magnitude for the reference frame, , we obtain a correction to absolute of 1.0 mas. We prefer to introduce into our reduction model our spectrophotmetrically-estimated reference star parallaxes as observations with error. When such data are available, the use of spectrophotometric parallaxes offers a more direct (i.e., less Galaxy model-dependent) way of determining the reference star absolute parallaxes.
4. The Absolute Parallax of the Pleiades
4.1. The Astrometric Model
Using the positions measured by FGS 1r, we determine the scale, rotation, and offset “plate constants” relative to an arbitrarily-adopted constraint epoch (the so-called “master plate”) for each observation set (the data acquired at each epoch). The MJD of each observation set is listed in Table 1, along with a measured magnitude transformed from the FGS instrumental system as per Benedict et al. (1998). Our Pleiades reference frame contains 9 stars. We employ the six-parameter model discussed in Benedict et al. (1999) for those observations. In this case, we determined the plate parameters from target and reference star data. Additionally, we apply corrections for lateral color discussed in Benedict et al. (1999), using values specific to FGS 1r as determined from observations with that FGS.
As for all our previous astrometric analyses, we employ GaussFit (Jefferys et al. (1987)) to minimize . The solved equations of condition for the Pleiades field are:
| (2) |
| (3) |
| (4) |
| (5) |
where and are the measured coordinates from HST; and are the lateral color corrections; and represents the color of each star, estimated from its spectral type, , and color listed in Table 2. and are scale- and rotation plate constants, and are offsets; and are proper motions; is the epoch difference from the mean epoch; and are parallax factors; and and are the parallaxes in and . We obtain the parallax factors from a JPL Earth orbit predictor (Standish, 1990), upgraded to version DE405. Orientation to the sky is obtained from ground-based astrometry (2MASS Catalog) with uncertainties in the field orientation of .
4.2. Modeling Constraints from Prior Knowledge
In addition to introducing our estimated reference star parallaxes as observations with error, we also introduce proper motion data from UCAC2 (Zacharias et al. (2003)) and Schilbach et al. (1995). Initial values are listed in Table 6. Typical input errors are 5-6 mas for each coordinate. The lateral color calibrations and the color indices are also treated as observations with error. As a final constraining observation, we solve for a line-of-sight dispersion in the parallaxes of the three Pleiades members with the ‘observation’ derived from the angular extent of the Pleiades (1°, from Adams et al. 2001) and an assumption of spherical symmetry. From this, we infer that the 1 dispersion in distance in this group is 1°/1 radian =1.7%. Hence, the 1 dispersion in the parallax difference between Pleiades members is
| (6) |
where we have here temporarily adopted a parallax of the Pleiades, mas. The parallax dispersion among targets 3030, 3179, and 3063 becomes an observation with associated error fed to our model, an observation used to estimate the parallax dispersion among the three stars, while solving for their parallaxes. Loosening the cluster dispersion to 2° (i.e., mas) had no effect on the final weighted average parallax. Again, note that mas is not an error associated with the distance to the Pleiades. It serves to constrain the dispersion in distances measured for Pleiades members.
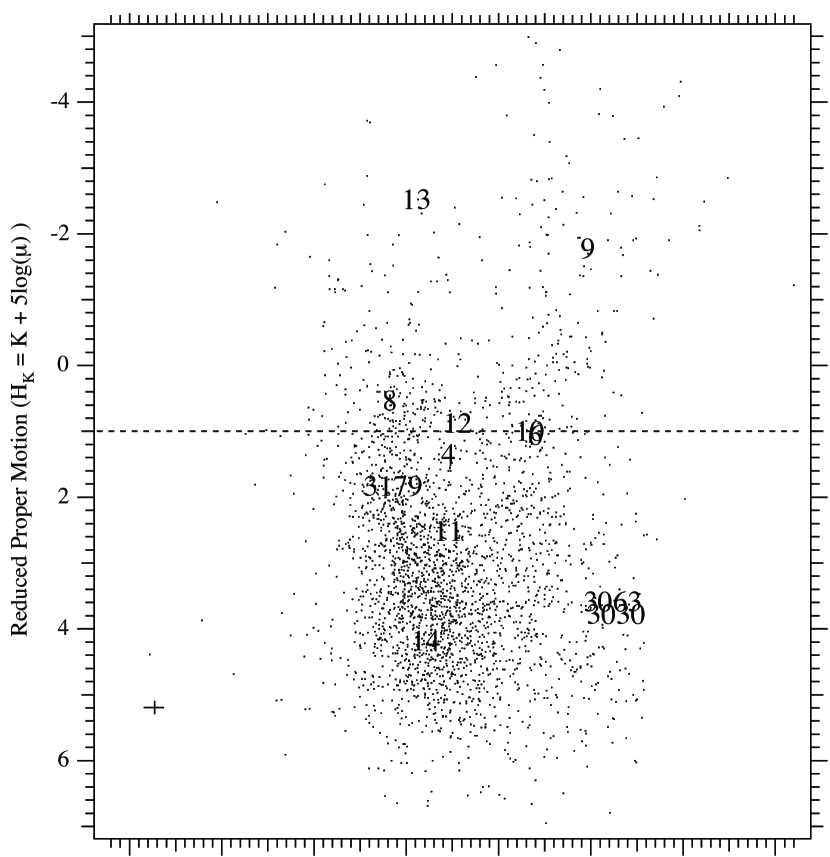
Proper motion values obtained from our modeling of HST data are listed in Table 6 as ‘Final’. We now employ the technique of reduced proper motions to provide a confirmation of the reference star estimated luminosity class listed in Table 4. We obtain proper motion and , photometry from UCAC2 and 2MASS for a one-degree-square field centered on the Pleiades. Figure 3 shows versus color index for 5,542 stars. If all stars had the same transverse velocities, Figure 3 would be equivalent to an H-R diagram. Target Pleiads and reference stars are plotted as ID numbers from Table 6. Errors in are now mag. Reference stars 6, 9, and 10 are clearly separated from the others, supporting their classification as non-dwarfs. Ref-6 and ref-10 remain below ref-9, confirming their sub-giant nature.
4.3. Assessing Reference Frame Residuals
| ID | aa and are relative positions in arcseconds | aa and are relative positions in arcseconds | |
|---|---|---|---|
| 3179 | |||
| 3063 | |||
| 3030 | |||
| ref-4 | |||
| ref-6 | |||
| ref-8bbRA = 03 51 45.050, Dec = +23 53 43.43, J2000 | |||
| ref-9 | |||
| ref-10 | |||
| ref-11 | |||
| ref-12 | |||
| ref-13 | |||
| ref-14 |
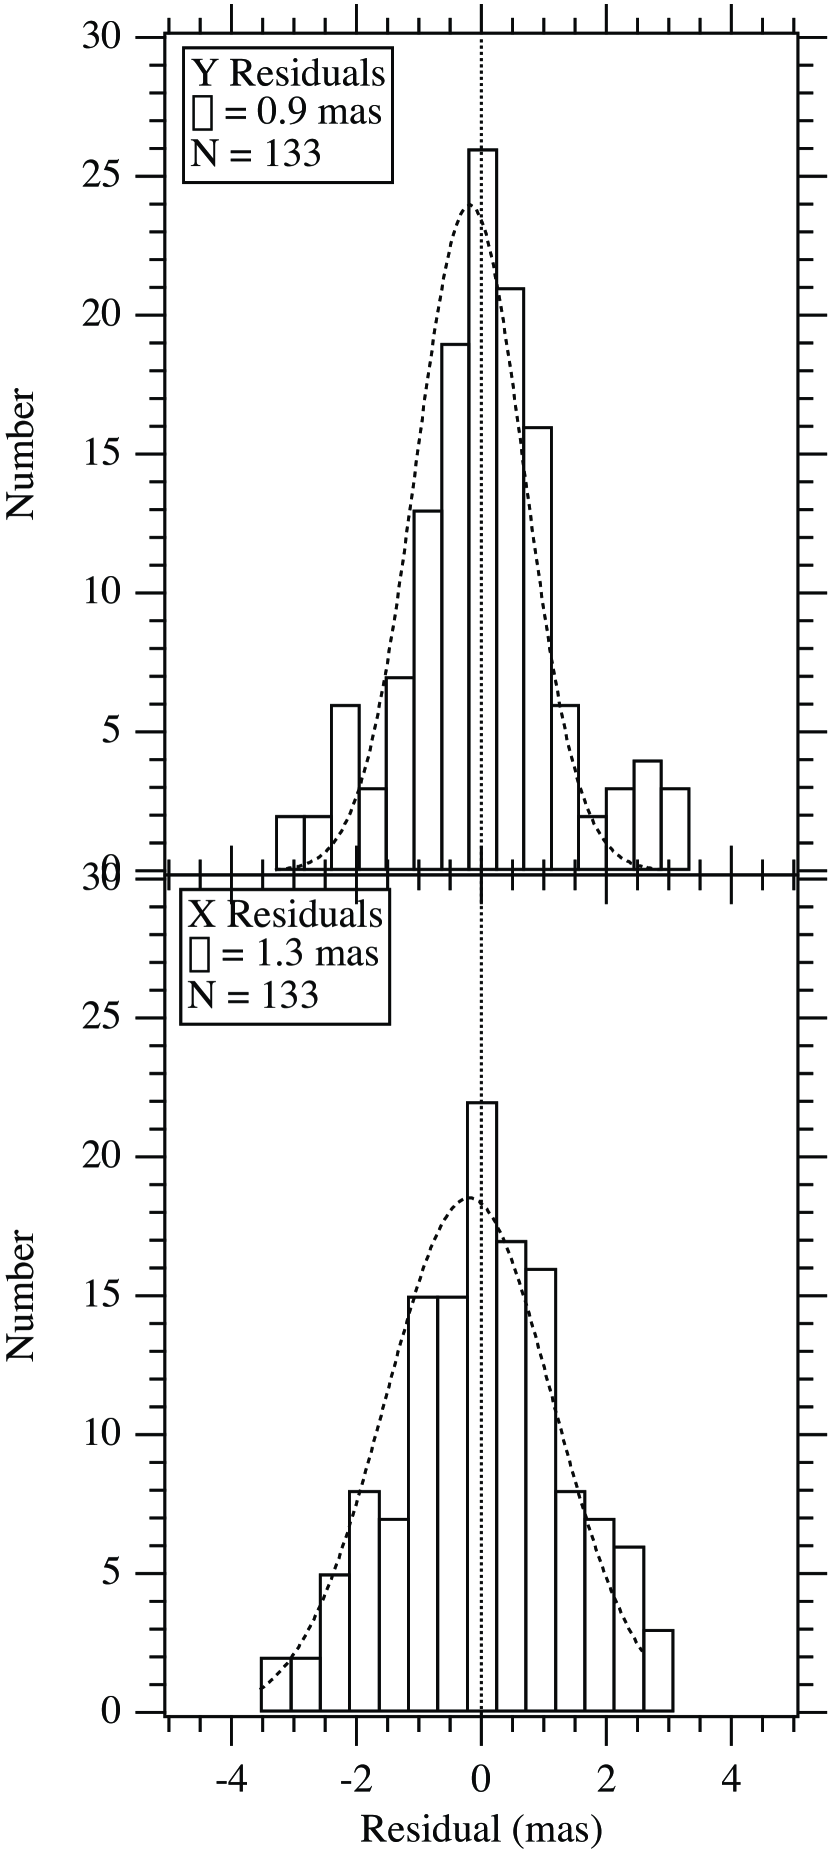
Our initial modeling attempts indicated that three of the original twelve reference stars exhibited significantly larger residuals than average. These reference stars were near the top- and bottom edges of the FGS1r field of regard. The Optical Field Angle Distortion calibration (McArthur et al. (2002)) reduces as-built HST telescope and FGS1r distortions with amplitude to below 2 mas over much of the FGS1r field of regard. However, because the fidelity of correction drops precipitously near the edge of the field of regard, we removed these three stars from the solution. From histograms of the remaining reference star astrometric residuals (Figure 4) we conclude that we have obtained satisfactory correction. The resulting reference frame ‘catalog’ in and standard coordinates (Table 5) was determined with and mas.
To determine if there might be unmodeled—but possibly correctable—systematic effects at the 1 mas level, we plotted the Pleiades reference frame and residuals against a number of spacecraft, instrumental, and astronomical parameters. These included and position within the FGS “pickle”; radial distance from the pickle center; reference star magnitude and color; and epoch of observation. We saw no obvious trends, other than an expected increase in positional uncertainty with reference star magnitude.
4.4. The Absolute Parallax of The Pleiades
| Input (UCAC2) | Final (HST) | ||||
|---|---|---|---|---|---|
| ID | V | aa and are relative motions in arcsec yr-1 | aa and are relative motions in arcsec yr-1 | aa and are relative motions in arcsec yr-1 | aa and are relative motions in arcsec yr-1 |
| 3179 | 10.08 | ||||
| 3063bb and from Schilbach et al. (1995). | 13.47 | ||||
| 3030bb and from Schilbach et al. (1995). | 14.00 | ||||
| ref-4 | 15.68 | ||||
| ref-6 | 14.57 | ||||
| ref-8 | 14.47 | ||||
| ref-9 | 13.61 | ||||
| ref-10 | 15.85 | ||||
| ref-11 | 14.63 | ||||
| ref-12 | 14.24 | ||||
| ref-13 | 12.14 | ||||
| ref-14 | 15.48 |
| ID | aa from ‘Final’ in Table 6 | bbFinal from modeling HST data with equations 2–5, employing the constraints summarized in Section 4.2 | ccAverage of 3030, 3063, and 3179 from Table 6, ‘Final.’ Proper motion error is the standard deviation of the individual measures. |
|---|---|---|---|
| mas yr-1 | mas | km s-1 | |
| 3179 | 32 | ||
| 3063 | 29 | ||
| 3030 | 28 | ||
| 4 | 18 | ||
| 6 | 38 | ||
| 8 | 13 | ||
| 9 | 61 | ||
| 10 | 122 | ||
| 11 | 17 | ||
| 12 | 5 | ||
| 13 | 36 | ||
| 14 | 39 |
| Parameter | Value |
|---|---|
| HST study duration | 3.51 y |
| number of observation sets | 6 |
| reference star | |
| reference star | |
| HST Absolute Parallax bb | 7.43 0.17 mas |
| HST Relative Proper Motion ccAverage of 3030, 3063, and 3179 from Table 6, ‘Final.’ Proper motion error is the standard deviation of the individual measures. | mas y-1 |
| in pos. angle | 158°° |
| Method | Abbr. | (pc) | Reference | ||
|---|---|---|---|---|---|
| HST/FGS parallax | HST | this paper | |||
| Hipparcos all-sky | HIP | van Leeuwen (1999) | |||
| Allegheny Obs. | AO | Gatewood, de Jonge, & Han (2000) | |||
| interferometric orbit | Pan | Pan, Shao & Kulkarni (2004) | |||
| dynamical parallax | Mun | Munari et al. (2004) | |||
| main sequence fitting | MS | Pinsonneault et al. (1998) |
| Object | (mas) | (mas) | HST Reference |
|---|---|---|---|
| Proxima Cen | Benedict et al. (1999) | ||
| Barnard’s Star | Benedict et al. (1999) | ||
| Gliese 876 | Benedict et al. (2002c) | ||
| Feige 24 | Benedict et al. (2000) | ||
| Wolf 1062 | Benedict et al. (2001) | ||
| Pleiades | this paper | ||
| RR Lyrae | Benedict et al. (2002a) | ||
| Cephei | Benedict et al. (2002b) | ||
| HD 213307 | Benedict et al. (2002b) |
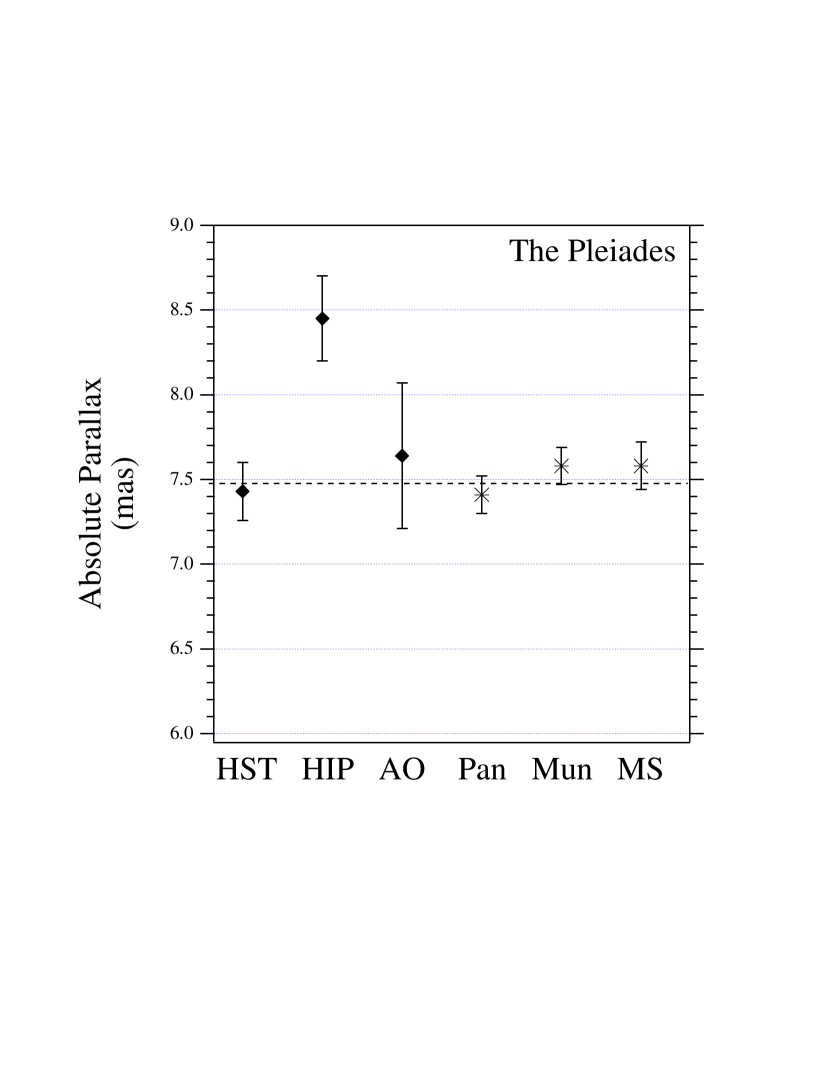
Note that we do not measure the parallax of these Pleiads relative to a reference frame with unknown parallax and then apply a correction to absolute parallax, assuming some model of the Galaxy. In a quasi-Bayesian approach, the reference star spectrophotometric absolute parallaxes, UCAC2 and Schilbach et al. (1995) proper motions, and an estimated cluster depth were input as observations with associated errors, not as hard-wired quantities known to infinite precision. Parallaxes and relative proper motion results from HST are collected in Tables 6 and 7. We obtain for the Pleiades members an average absolute parallax 7.43 0.17 mas (Table 8). Because we employ a cluster depth constraint, the three Pleiades member parallaxes are not independent measurements. Hence, we cannot use the standard deviation of the mean to reduce our final error by . Along with our result, other recent Pleiades parallaxes are listed in Table 9 and compared in Figure 5. The most discrepant of these is clearly and only the Hipparcos result.
Our absolute parallax for the Pleiades contains one last systematic uncertainty: where in the cluster do our three Pleiades members lie? In Section 4.2 we estimated a ‘depth’ in parallax of mas. Our final parallax result should be stated 7.43 0.17 0.20 mas with the error having both a random and systematic component. We point out that each of the astrometric results in Figure 5 suffers from the same systematic error. In the next Section we reduce that error by averaging those results. Inspecting Tables 6 and 7 we note that ref-14, identified as Cl* Melotte 22 CALAR 7, is in fact not a Pleiad, disagreeing in parallax and proper motion with the first three stars in these Tables, all identified members.
5. Discussion and Summary
5.1. HST Parallax Accuracy
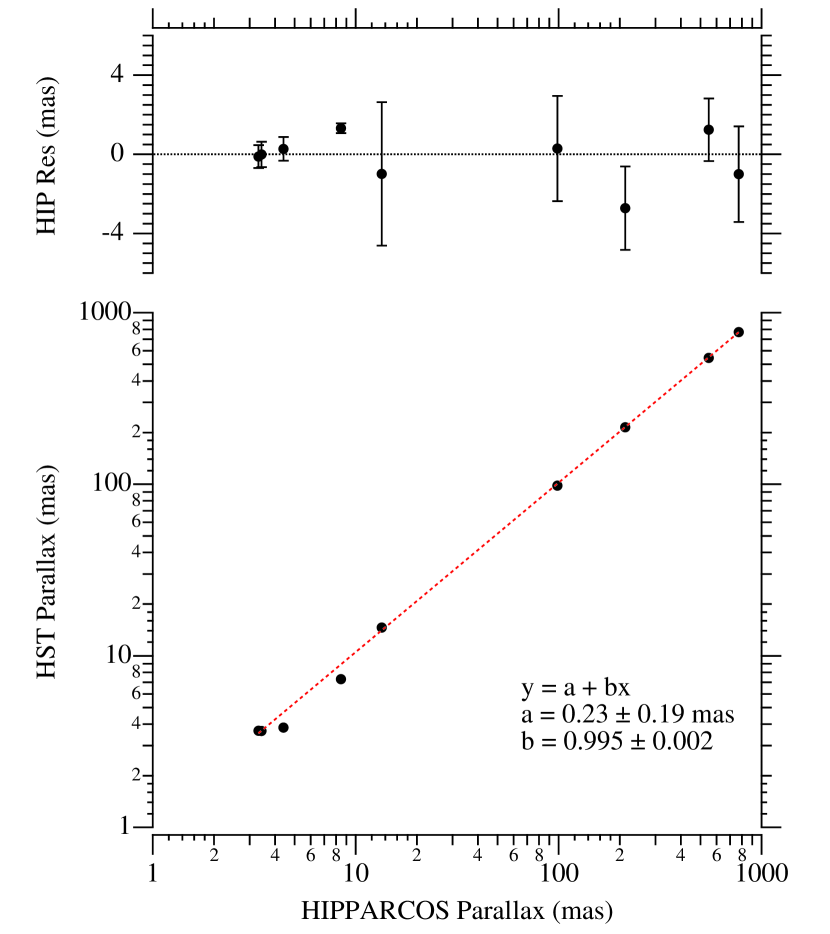
Our parallax precision, an indication of our internal, random error, is often less than 0.3 mas. To assess our accuracy, or external error, we must compare our parallaxes with results from independent measurements. Following Gatewood, Kiewiet de Jonge, & Persinger (1998) and extending the analysis presented in Benedict et al. (2002b) with the addition of a recent parallax for Gl 876 (Benedict et al., 2002c), we plot eight parallaxes obtained by the HST Astrometry Science Team with FGS 3 and, now FGS 1r, against those obtained by Hipparcos. Data for these objects are collected in Table 10 and shown in Figure 6. The dashed line is a weighted regression that takes into account errors in both input data sets and excludes the Pleiades. Figure 6 indicates no statistically significant scale difference compared to Hipparcos. However, for this fit, which excludes the Pleiades, we obtain a reduced . Including the Pleiades, we obtain a significantly poorer fit with reduced , again, suggesting a problem with the Hipparcos Pleiades parallax.
Our result, in and of itself, does not lead to the conclusion that the Hipparcos parallax for the Pleiades is wrong, but that conclusion cannot be avoided once all the results are examined together. Especially important for making this case are the two recent determinations of visual binary orbits for Pleiades members. Pan, Shao & Kulkarni (2004) used the Palomar Testbed Interferometer to determine very precise relative positions of the two stars comprising Atlas, one of the Seven Sisters. Without having a radial velocity orbit they could not determine all the parameters, but a solution is possible by assuming masses for the stars, and the masses enter in the cube root. By doing this they concluded that the distance to the Pleiades cannot be less than 127 pc and that the most likely distance lies between 133 and 137 pc. Munari et al. (2004) analyzed light- and radial velocity curves for HD 23642, an eclipsing binary in the Pleiades, and determined a distance of pc. (This would decrease to if the assumed reddening were increased to as much as magnitude).
5.2. The Distance to the Pleiades
There now exist three completely independent determinations of the Pleiades distance that use completely independent techniques and data, and they all yield the same answer to within their errors. Our traditional parallax determination leads to pc, a visual binary orbit leads to , and an eclipsing binary orbit results in . For comparison, recent estimates from main sequence fitting include (Stello & Nissen, 2001) and (Pinsonneault et al., 1998), and Gatewood, de Jonge, & Han (2000) has determined at Allegheny Observatory. Narayanan & Gould (1999) derived pc from the gradient in the radial velocities of Pleiades members in the direction of the cluster’s proper motion.
Clearly the Hipparcos result, , is discrepant. This can be seen graphically in Figure 6, and a summary of these distance determinations is given in Table 9. Understanding this discrepancy is crucial. Astrometry is arguably the one branch of astronomy where accurate and precise knowledge of uncertainties cannot be overlooked. The Hipparcos team has been well aware of this and has put considerable effort into examining potential sources of systematic error. Their most recent papers (van Leeuwen & Fantino (2003a), Dalla Torre & van Leeuwen (2003), van Leeuwen & Penston (2003), Fantino & van Leeuwen (2003), van Leeuwen & Fantino (2003b)) show, for instance, that noise in the along-scan attitude dominates for (where is the apparent magnitude as directly measured by Hipparcos) and that this may be especially important for the Pleiades, inter alia (van Leeuwen & Fantino, 2003b). This possibility was examined by Makarov (2002), who reanalyzed Hipparcos data to derive , a value that is substantially less discrepant than that reported by van Leeuwen (1999) and Robichon et al. (1999).
The answer certainly does not lie in an unusual shape or physical properties for the Pleiades. Stello & Nissen (2001) suggested that the Hipparcos distance could be reconciled with traditional measures if the bright stars—the Seven Sisters—that dominate the Hipparcos result happen to lie at the near end of an elongated cluster. This is disproved by the fact that Pan, Shao & Kulkarni (2004) find Atlas itself to lie at the traditional distance. Grenon (2001) suggested that the luminosities of Pleiades stars could be accounted for by a low cluster metallicity of , determined from Geneva photometry. The exact metallicity of the Pleiades remains uncertain, but it is unlikely to be as low as that since analyses from high-resolution spectra yield values that are essentially solar (e.g., Boesgaard & Friel (1990) get [Fe/H] = ). Hainline et al. (2001) have likewise refuted the Grenon (2001) metallicity on several grounds.
To summarize, HST astrometry yields an absolute trigonometric parallax for three members of the Pleiades, 7.43 0.17 mas with a 0.20 mas systematic error due to cluster depth. A weighted average with previous ground-based astrometric determinations (HST, AO, Pan and Munari, Table 9) provides mas. This average result should reduce the contribution of the cluster depth systematic error, presuming that the stars measured by these techniques are randomly distributed within the cluster. With %, any Lutz-Kelker-Hanson bias correction (Lutz & Kelker (1973), Hanson (1979)) to an absolute magnitude would be less than 0.01 magnitude (e.g., Benedict et al. (2002b)). This net parallax of mas corresponds to pc, or magnitude. This is likely to be the best available distance for the Pleiades until observations of substantially better precision can be made with a mission such as SIM or GAIA.
References
- Adams et al. (2001) Adams, J. D., Stauffer, J. R., Monet, D. G., Skrutskie, M. F., & Beichman, C. A. 2001, AJ, 121, 2053
- Allen (1973) Allen, C. W. 1973, London: University of London, Athlone Press, 3rd ed.
- van Altena, Lee, & Hoffleit (1995) van Altena, W. F., Lee, J. T., & Hoffleit, E. D. 1995, Yale Parallax Catalog (4th ed. ; New Haven, CT: Yale Univ. Obs.) (YPC95)
- Benedict et al. (1998) Benedict, G. F., McArthur, B., Nelan, E., Story, D., Whipple, A. L., Shelus, P. J., Jefferys, W. H., Hemenway, P. D., Franz, O. G., Wasserman, L. H., Duncombe, R. L., van Altena, W., & Fredrick, L. W. 1998, AJ, 116, 429
- Benedict et al. (1999) Benedict, G. F., McArthur, B., Chappell, D. W., Nelan, E., Jefferys, W. H., van Altena, W., Lee, J., Cornell, D., Shelus, P. J., Hemenway, P. D., Franz, O. G., Wasserman, L. H., Duncombe, R. L., Story, D., Whipple, A., & Fredrick, L. W. 1999, AJ, 118, 1086
- Benedict et al. (2000) Benedict, G. F., McArthur, B. E., Franz, O. G., Wasserman, L. H., Nelan, E., Lee, J., Fredrick, L. W., Jefferys, W. H., van Altena, W., Robinson, E. L., Spiesman, W. J., Shelus, P. J., Hemenway, P. D., Duncombe, R. L., Story, D., Whipple, A. L., & Bradley, A. 2000, AJ, 119, 2382
- Benedict et al. (2001) Benedict, G. F., McArthur, B. E., Franz, O. G., Wasserman, L. H., Henry, T. J., Takato, T., Strateva, I. V., Crawford, J. L., Ianna, P. A., McCarthy, D. W., Nelan, E., Jefferys, W. H., van Altena, W., Shelus, P. J., Hemenway, P. D., Duncombe, R. L., Story, D., Whipple, A. L., Bradley, A. J., & Fredrick, L. W. 2001, AJ, 121, 1607
- Benedict et al. (2002a) Benedict, G. F., McArthur, B. E., Fredrick, L. W., Harrison, T. E., Lee, J., Slesnick, C. L., Rhee, J., Patterson, R. J., Nelan, E., Jefferys, W. H., van Altena, W., Shelus, P. J., Franz, O. G., Wasserman, L. H., Hemenway, P. D., Duncombe, R. L., Story, D., Whipple, A. L., & Bradley, A. J. 2002a, AJ, 123, 473
- Benedict et al. (2002b) Benedict, G. F., McArthur, B. E., Fredrick, L. W., Harrison, T. E., Slesnick, C. L., Rhee, J., Patterson, R. J., Skrutskie, M. F., Franz, O. G., Wasserman, L. H., Jefferys, W. H., Nelan, E., van Altena, W., Shelus, P. J., Hemenway, P. D., Duncombe, R. L., Story, D., Whipple, A. L., & Bradley, A. J. 2002b, AJ, 124, 1695
- Benedict et al. (2002c) Benedict, G. F., McArthur, B. E., Forveille, T., Delfosse, X., Nelan, E., Butler, R. P., Spiesman, W., Marcy, G., Goldman, B., Perrier, C., Jefferys, W. H., & Mayor, M. 2002c, ApJ, 581, L115
- Bessell (1979) Bessell, M. S. 1979, PASP, 91, 5
- Bessell & Brett (1988) Bessell, M. S. & Brett, J. M. 1988, PASP, 100, 1134
- Boesgaard & Friel (1990) Boesgaard, A. M., & Friel, E. D. 1990, ApJ, 351, 467
- Bradley et al. (1991) Bradley, A., Abramowicz-Reed, L., Story, D., Benedict, G. & Jefferys, W. 1991, PASP, 103, 317
- Carpenter (2001) Carpenter, J. M. 2001, AJ, 121, 2851
- Cox (2000) Cox, A. N. 2000, Allen’s Astrophysical Quantities, 4th ed. Publisher: New York: AIP Press, Springer, 2000. Edited by Arthur N. Cox. (AQ2000)
- Dalla Torre & van Leeuwen (2003) Dalla Torre, A., & van Leeuwen, F. 2003, Sp. Sci. Rev., 108, 451
- Fantino & van Leeuwen (2003) Fantino, E., & van Leeuwen, F. 2003, Sp. Sci. Rev., 108, 499
- Gatewood, Kiewiet de Jonge, & Persinger (1998) Gatewood, G., Kiewiet de Jonge, J., & Persinger, T. 1998, AJ, 116, 1501
- Gatewood, de Jonge, & Han (2000) Gatewood, G., de Jonge, J. K., & Han, I. 2000, ApJ, 533, 938
- Gould & Morgan (2003) Gould, A. & Morgan, C. W. 2003, ApJ, 585, 1056
- Grenon (2001) Grenon, M. 2001, in 11th Cool Stars, Stellar Systems, and the Sun, eds. R. J. García López, R. Rebolo, and M. R. Zapatero Osorio, A.S.P. Conf. Ser., v. 223, 359
- Hainline et al. (2001) Hainline, L. J., Deliyannis, C. P., & Margheim, S. 2001, BAAS, 33, 1387
- Hanson (1979) Hanson, R. B. 1979, MNRAS, 186, 87
- Harrison et al. (2004) Harrison,
- Hertzsprung (1947) Hertzsprung, E. 1947, Ann. Leiden Obs., 19, Part 1A
- Jefferys et al. (1987) Jefferys, W., Fitzpatrick, J., and McArthur, B. 1987, Celest. Mech. 41, 39.
- van Leeuwen (1999) van Leeuwen, F. 1999, A&A, 341, L71
- van Leeuwen (2002) van Leeuwen, F. 2002, in Highlights of Astron., ed. H. Rickman, 12, 657
- van Leeuwen & Fantino (2003a) van Leeuwen, F., & Fantino, E. 2003, Sp. Sci. Rev., 108, 447
- van Leeuwen & Fantino (2003b) van Leeuwen, F., & Fantino, E. 2003, Sp. Sci. Rev., 108, 537
- van Leeuwen & Penston (2003) van Leeuwen, F., & Penston, M. 2003, Sp. Sci. Rev., 108, 471
- Lutz & Kelker (1973) Lutz, T. E. & Kelker, D. H. 1973, PASP, 85, 573
- Makarov (2002) Makarov, V. V. 2002, AJ, 124, 3299
- McArthur et al. (2002) McArthur, B., Benedict, G. F., Jefferys, W. H., & Nelan, E. 2002, The 2002 HST Calibration Workshop : Hubble after the Installation of the ACS and the NICMOS Cooling System, Proceedings of a Workshop held at the Space Telescope Science Institute, Baltimore, Maryland, October 17 and 18, 2002. Edited by Santiago Arribas, Anton Koekemoer, and Brad Whitmore. Baltimore, MD: Space Telescope Science Institute, 2002, p.373
- McArthur et al. (2001) McArthur, B. E. et al. 2001, ApJ, 560, 907
- Mermilliod et al. (1992) Mermilliod, J.-C., Rosvick, J. M., Duquennoy, A., & Mayor, M. 1992, A&A, 265, 513
- Munari et al. (2004) Munari, U., Dallaporta, S., Siviero, A., Soubiran, C., Fiorucci, M., and Girard, P. 2004, A&A, 418, L31
- Narayanan & Gould (1999) Narayanan, V. K., & Gould, A. 1999, ApJ, 523, 328
- Nelan et al. (2002) Nelan, E., & Makidon, R., in HST FGS Data Handbook, version 4.0, ed. B. Mobasher, Baltimore, STScI
- Nelan et al. (2003) Nelan, E., et al., “Fine Guidance Sensor Instrument Handbook,” version 12.0, Baltimore, STScI
- Nelan & Makidon (2001) Nelan, E., & Makidon, R. 2001, Fine Guidance Sensor Instrument Handbook (version 10; Baltimore: STScI)
- Pan, Shao & Kulkarni (2004) Pan, X., Shao, M., & Kulkarni, S., 2004, Nature, 427, 326
- Percival, Salaris, & Kilkenny (2003) Percival, S. M., Salaris, M., & Kilkenny, D. 2003, A&A, 400, 541
- Pinsonneault et al. (1998) Pinsonneault, M. H., Stauffer, J., Soderblom, D. R., King, J. R., & Hanson, R. B. 1998, ApJ, 504, 170
- Robichon et al. (1999) Robichon, N., Arenou, F., Mermilliod, J.-C., & Turon, C. 1999, A&A, 345, 471
- Savage & Mathis (1979) Savage, B. D. & Mathis, J. S. 1979, ARA&A, 17, 73
- Schilbach et al. (1995) Schilbach, E., Robichon, N., Souchay, J., & Guibert, J. 1995, A&A, 299, 696
- Schlegel et al. (1998) Schlegel, D. J., Finkbeiner, D. P., & Davis, M. 1998, ApJ, 500, 525
- Soderblom et al. (1998) Soderblom, D. R., King, J. R., Hanson, R. B., Jones, B. F., Fischer, D., Stauffer, J. R., & Pinsonneault, M. H. 1998, ApJ, 504, 192
- Soderblom et al. (1993) Soderblom, D. R., Stauffer, J. R., Hudon, J. D., & Jones, B. F. 1998, ApJS, 85, 315
- Standish (1990) Standish, E. M., Jr. 1990, A&A, 233, 252
- Stello & Nissen (2001) Stello, D. & Nissen, P. E. 2001, A&A, 374, 105
- Yong & Lambert (2003) Yong, D. & Lambert, D. L. 2003, PASP, 115, 796
- Zacharias et al. (2003) Zacharias, N., Urban, S. E., Zacharias, M. I., Wycoff, G. L., Hall, D. M., Germain, M. E., Holdenried, E. R., & Winter, L. 2003, VizieR Online Data Catalog, 1289