An S-shaped outflow from IRAS 03256+3055 in NGC 1333
Abstract
The IRAS source 03256+3055 in the NGC 1333 star forming region is associated with extended sub-millimeter emission of complex morphology, showing multiple clumps. One of these is found to coincide with the driving source of a bipolar jet of S-shaped morphology seen in the emission lines of H and [SII] as well as in the H2 emission lines in the K-band. Detailed images of the driving source at the wavelengths of H and [SII] and in the I, J, H, and K-bands as well as a K-band spectrum and polarimetry are discussed. The near-infrared morphology is characterized by a combination of line emission from the jet and scattered light from a source with a steep continuum spectrum. The morphology and proper motion of the jet are discussed in the context of a binary system with a precessing disk. We conclude that the molecular core associated with IRAS 03256+3055 consists of several clumps, only one of which shows evidence of recent star formation at optical and near-infrared wavelengths. We also briefly discuss a second, newly found near-infrared source associated with a compact sub-millimeter continuum source near IRAS 03256+3055, and conclude that this source may be physically unrelated the cluster of molecular clumps.
1 Introduction
Young low-mass stars form by accretion of material through a disk, a process accompanied by outflow activity. Objects in their main accretion phase (class 0) are usually associated with powerful outflows that manifest themselves in shock-excited emission.
NGC 1333 is one of the youngest regions of clustered low-mass star formation and contains a relatively large population of class 0 sources (Lada & Lada, 2003) and numerous outflows, as was pointed out by Hodapp & Ladd (1995) and Bally, Devine, & Reipurth (1996). This paper focuses on a region of far-infrared and extended sub-millimeter emission in the southern part of the NGC 1333 star forming region that was first cataloged as IRAS 03256+3055. We assume NGC 1333 to be at the same distance of 316 pc that Herbig (1998) determined for the IC 348 cluster located in the same Per OB2 molecular cloud complex.
Bally, Devine, & Reipurth (1996) discovered a system of Herbig-Haro objects associated with IRAS 03256+3055, indicating outflow activity and thus recent star formation in the region. This paper reports new near-infrared images, spectroscopy, and polarimetry of the young stellar object (YSO) responsible for this outflow activity. Morphologically, the outflow associated with IRAS 03256+3055 is remarkable for its S-shaped symmetry. A number of possible explanations for deviations from a straight jet were discussed by Eislöffel & Mundt (1997). The changes in the IRAS 03256+3055 jet are smooth without discontinuities or kinks. Jets with this morphology are usually interpreted as precessing. The precession of the accretion disk, and therefore of the jet, is caused by the misalignment of the disk plane and the orbital plane of a binary system.
We also present new sub-millimeter images at 450m and 850m that confirm the results of Young et al. (2003) and show a new compact sub-millimeter object.
2 Observations and Data Reduction
2.1 Infrared Imaging
The S-shaped molecular hydrogen jet in the area of IRAS 03256+3055 was included in a wide field image of the NGC 1333 region in the H2 1–0 S(1) emission line obtained in the nights of July 30 to August 3, 1996 using the QUIRC camera (Hodapp et al., 1996) at the University of Hawaii (UH) 2.2m telescope. The individual integration time was 300 s. Three frames were co-added at the position of the jet’s driving source (Fig. 3, 1996 image).
A deep K-band image of this region was subsequently obtained with QUIRC at the UH 2.2m telescope, on the night of February 7, 1998 (UT). The individual integration time was 120 s per frame and a total of 30 frames were co-added to form the image shown in Fig. 1.
For proper motion studies, additional images in the H2 S(1) line were obtained August 1, 2004 with QUIRC at the UH 2.2m telescope. These observations were carried out with an integration time of 60 s per frame and 56 such frames were co-added into the final image (Fig. 3, 2004 image).
The 1996 and 2004 H2 1–0 S(1) images of the jet do not show any detail beyond what is visible in the broad-band K-band image in Fig. 1 and are therefore not presented in their full extent in a figure. Only the central areas of these images are shown in Fig. 3.
The coordinates of the flux maximum in the K-band near the apparent origin of the S-shaped jet were measured on a Two Micron All Sky Survey (2MASS) image where this feature is very faintly visible: 03:28:45.3 +31:05:42 (J2000). To distinguish this near-infrared object from the larger IRAS source we will refer to the near-infrared (K-band) manifestation of the driving source of the S-shaped outflow as NGC1333 J032845.3+310542 (K).
Higher spatial resolution near-infrared images of this central source of the outflow were obtained in the night of October 20, 2003 with the United Kingdom Infrared Telescope (UKIRT) using the UKIRT Fast Track Imager (UFTI) (Roche et al., 2003). These J, H, and K images are shown as part of Fig. 2. The total integration time in the H and K bands was 18 minutes, while we integrated for a total of 36 minutes in the J band. The filter bandpasses are the Mauna Kea Observatories standard filters as defined by Tokunaga, Simons, & Vacca (2002). The infrared magnitudes of the bright knot of emission visible primarily in the H and K bands were measured using the IRAF “apphot” package with an object aperture diameter of 2.2 , and a very wide sky annulus to avoid the extended, mostly line emission from the rest of the nebula. Calibration is based on the faint UKIRT standard P247-U. The knot of continuum emission has the magnitudes J=19.9 (18Jy), H=17.0 (165Jy), K=14.9 (712Jy).
K-band imaging polarimetry was obtained with UFTI and the IRPOL polarimetry module. IRPOL consists of a rotating halfwave retarder and, internal to UFTI, a Wollaston prism. A warm focal plane mask isolates two horizontal strips so the ordinary and extra-ordinary beams from each strip can be projected onto the array simultaneously. A measurement of the degree and angle of polarization takes a minimum of two halfwave plate settings. For our K-band polarization value for this source, 72 individual exposures of 40 s integration time were used. Due to the faintness of the object, only an integral value for the polarization in an aperture of 2.2 diameter centered on the flux maximum in the K band could be obtained. The polarization of this flux maximum is p = 10.4 % 2 % at an angle of = 110∘ 5∘. The polarization vector is indicated in the K-band frame of Fig. 2.
2.2 Archival Images
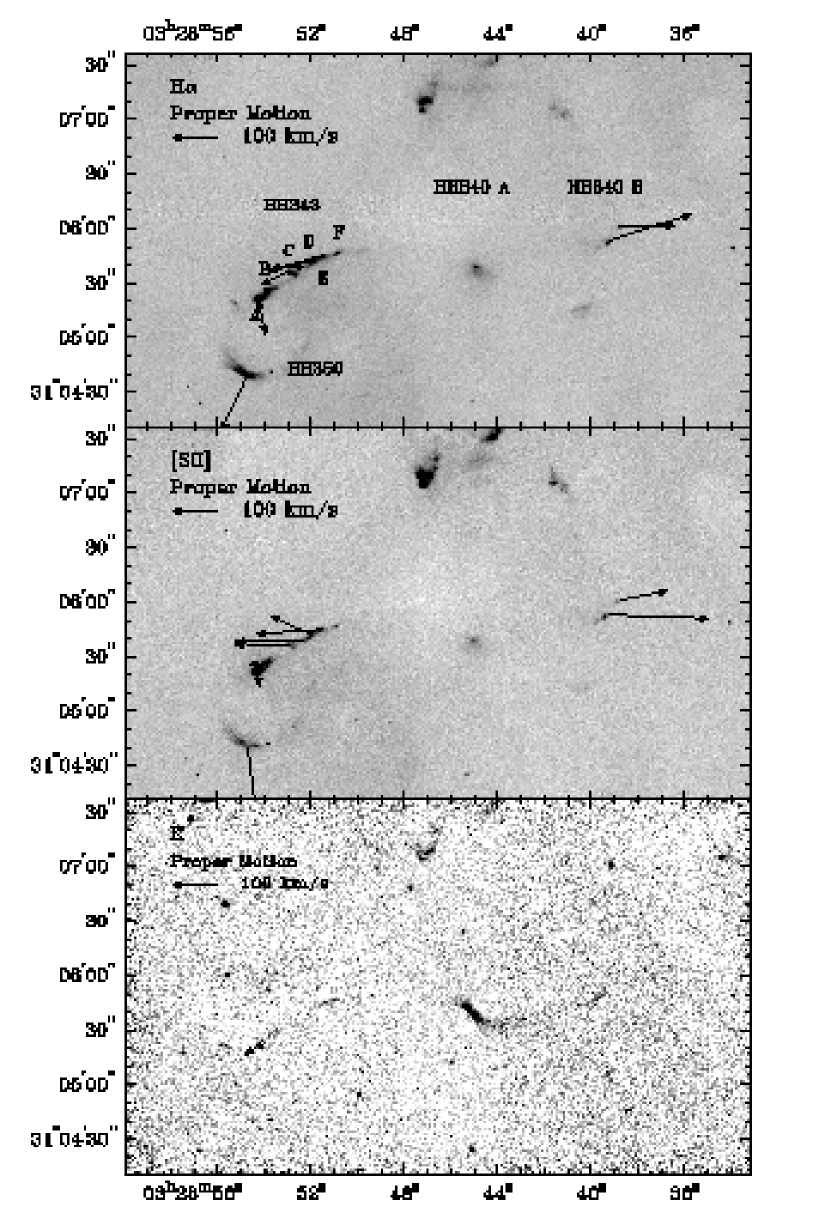
We also use optical images of the NGC 1333 star forming region at the wavelengths of H and [SII] as well as in the I band obtained on October 29, 1997 by Bally & Reipurth (2001) at the Kitt Peak National Observatory (KPNO) 4m Mayall telescope, and additional images using the same equipment, but better CCDs, obtained by the same team on October 13 and 14, 2001. Individual integration times were 400s and 600s for the narrow-band filters, and 60 s for the I-band, and sets of 5 dithered exposures were combined into the final archival images. The images at the wavelength of H and [SII] are shown in Fig. 1 for comparison with the K-band image. The proper motion of the HH objects was measured by comparison of the 1997 and 2001 images and the resulting proper motion vectors are included in Fig. 1 and listed in Table 1.
2.3 Astrometry
The optical H and [SII] images in Fig. 1 were registered to the wide-field QUIRC K-band image using the IRAF tasks “geomap” and “geotran” on a set of 11 stars common to all images. The registration of the images has rms residuals of 0.1 and is sufficiently precise to allow detailed discussion of the relative position of features at different wavelengths. This is particularly important since hardly any of the outflow features in the H and [SII] images coincide with features in the K band.
The optical KPNO images, the near-infrared wide-field QUIRC image, and the UKIRT images in Fig. 2 were all astrometrically referenced to the same star near the driving source of the outflow, but outside of the field shown in Fig. 2. The coordinates of this star were measured on the 2MASS image.
2.4 Proper Motion of Herbig-Haro Knots
Two sets of H2 1–0 S(1) images taken 8 years apart were used to measure the proper motion of the eastern bow shock. The proper motion was measured by first registering the two images using the IRAF tasks “geomap” and “geotran” on a set of field stars, and then measuring the proper motion of the bow shock and the motion of a control sample of stars using the task “xregister”. The small residual average displacement of the stars was treated as a residual alignment error between the two images and was subtracted from the bow shock proper motion.
Individual HH knots are better defined in H and [SII] than at infrared wavelengths. Therefore the proper motions of the emission knots outside of the bow shock were measured by comparison of KPNO Mayall 4m telescope prime focus images obtained in 1997 and 2001, using the methods described in Bally & Reipurth (2001).
The resulting proper motion vectors are shown in Fig. 1 and are tabulated in Table 1. In contrast to the result obtained from H and [SII] emission, the H2 1–0 S(1) bow shock has a proper motion direction parallel to the jet axis. The difference between these measurements may be caused by the more complex morphology of the excitation in the H and [SII] lines where the emission appears composed of individual knots rather than a smooth bow shock. This point will be discussed in more detail in section 3.1.
| RA | Dec | Name | H V | H PA | [SII] V | [SII] PA | H2 S(1) V | H2 S(1) PA |
|---|---|---|---|---|---|---|---|---|
| V (kms-1) | PA (∘) | V (kms-1) | PA (∘) | V (kms-1) | PA (∘) | |||
| 03:28:38.8 | +31:06:01 | HH 340 B1 | 122 36 | 271 | 111 21 | 281 | - | - |
| 03:28:39.3 | +31:05:53 | HH 340 B2 | 196 21 | 288 | 224 13 | 268 | - | - |
| 03:28:51.5 | +31:05:45 | HH 343 E | 119 17 | 105 | 148 13 | 94 | - | - |
| 03:28:52.0 | +31:05:42 | HH 343 D | 97 12 | 104 | 99 13 | 64 | - | - |
| 03:28:52.3 | +31:05:39 | HH 343 D | 29 35 | 88 | 151 19 | 91 | - | - |
| 03:28:53.0 | +31:05:36 | HH 343 C | 66 13 | 116 | 118 14 | 88 | - | - |
| 03:28:53.9 | +31:05:26 | HH 343 B | 55 10 | 156 | 38 11 | 90 | - | - |
| 03:28:54.3 | +31:05:21 | HH 343 A | 81 07 | 194 | 32 8 | 192 | 34 | 124 |
| 03:28:54.9 | +31:04:43 | HH 350 | 141 32 | 155 | 102 70 | 187 | - | - |
2.5 Subaru IRCS Spectroscopy
Long-slit, low-resolution spectroscopy of NGC 1333 J032845.3+310542 (K) was obtained using the Infrared Camera and Spectrograph (IRCS) (Kobayashi et al., 2000) at the Subaru telescope on December 15, 2003 (UT). We used IRCS in low resolution grism spectroscopy mode in the K band with a pixel scale of 58 mas/pixel and 0.6 slit width. The slit was oriented along the extended emission at a position angle of 40∘ as indicated in Fig. 3. The K-band seeing during the observation was poor, about 1.2″ FWHM. Sky frames were taken separately at a position outside the extended emission associated with IRAS 03256+3055. Atmospheric absorption was measured by repeatedly observing the A0V star HR 1026, near NGC 1333.
The data were flat-fielded using a continuum lamp spectrum and were sky subtracted. Residuals of the OH airglow lines after sky subtraction were further reduced by measuring them on the object frame, outside of the area affected by object emission lines, and subtracting them from the full spectral frame. The spectral frame was divided by the spectrum of the atmospheric absorption standard, and multiplied by a black body spectrum of T = 9480 K, the effective temperature of an A0V star. The resulting spectrum (Fig. 4, lower panel) is therefore relative Fλ units.
Emission lines of H2 are seen both north east (above) and south west (below) of the strong continuum source (Fig. 4 upper panel), the emission being more extended in the south west direction. The spectrum of the continuum source was extracted from the spectral frame and is presented in the lower panel of Fig. 4. No effort was made to subtract the H2 emission lines from the continuum, since they show spatial structure along the slit and any attempt to subtract them would be model dependent. Aside from the superposed H2 emission lines and Br emission, the spectrum is a featureless continuum, rising steeply toward longer wavelengths. This is the characteristic appearance of a very young star whose emission is dominated by the continuum emission from hot dust, with added components of Br emission from disk accretion and shock-excited H2 emission from a jet.
2.6 Sub-Millimeter Imaging
We observed NGC 1333 IRAS 03256+3055 with the JCMT Sub-Millimeter Common User Bolometer Array (SCUBA) (Holland et al., 1999) on January 28, 1998 under exceptionally good atmospheric conditions, with 450m opacity of 0.67 and 850m opacity of 0.13. The SCUBA jiggle-map procedure was used to obtain maps at 450 m and 850 m (Fig. 5) of the extended emission and multiple sources in IRAS 03256+3055. Calibration was based on repeated measurements of Mars as the primary calibrator and CRL 618 as an unresolved secondary standard source (Sandell, 1994), for which we adopt the flux values 11.2 Jy at 450m and 4.56 Jy at 850m, consistent with Young et al. (2003). To obtain information about the local but extended flux maxima in the sub-millimeter emission of IRAS 03256+3055, we performed sky-subtracted aperture photometry on the maps. We used an object aperture radius of 15” and a sky annulus between 20 and 25 radius and calibrated directly against the maps of CRL 618. The results are listed in Table 2.
| Knot | RA | Dec | 450m | 850m |
|---|---|---|---|---|
| (mJy) | (mJy) | |||
| A | 03:28:34.5 | +31:07:04 | 756 140 | 271 12 |
| B | 03:28:39.0 | +31:05:55 | 635 140 | 110 12 |
| C | 03:28:42.6 | +31:06:14 | 584 140 | 139 12 |
| D | 03:28:45.1 | +31:05:48 | 552 140 | 102 12 |
3 Results and Discussion
3.1 The Jet
The string of Herbig-Haro objects outlining the curved jet was first noted on optical images by Bally, Devine, & Reipurth (1996). What we now recognize as the eastern half of the outflow was called HH 343, with knots labeled A through F in order from east to west (see Fig. 1). This string of prominent knots is redshifted. The diffuse nebulosity at the position of the central source, detected in H and [SII] was called HH 340 A, while the brightest knot in the western outflow lobe was called HH 340 B. Apparently, the relationship of these objects and the fact that HH 340 A is associated with the driving source of the outflow was not noted by Bally, Devine, & Reipurth (1996).
In our infrared images, more extended flux is visible near the central source and it becomes clear that the HH knots 343 and 340 B form the two lobes of a S-shaped bipolar jet. Figure 2 shows that the central driving source NGC1333 J032845.3+310542 (K) is close to but slightly to the north-east of HH 340 A as seen in H and [SII]. This diffuse H and [SII] emission seen near the position of the central source coincides with the south-western (blueshifted) lobe, as it is expected in a bipolar structure where the receding (north-eastern) lobe is more obscured by dust. We will discuss the driving source of the outflow in detail in section 3.2.
The K-band morphology of the jet is very different from that at the wavelengths of H and [SII] (Fig. 1). The H and [SII] lines trace much higher excitation levels than the H2 emission lines that dominate the emission in the K band. The H and [SII] images show well defined knots that led to the original naming HH 343 A-F, while on the K-band image, the distinction between the individual knots is not discernable. Rather, the molecular hydrogen emission consists of lines of enhanced emission that outline the outflow cavity. Similarly, the western lobe shows two distinct knots in H and [SII] while the K-band image shows a contiguous emission region that outlines an outflow cavity.
The eastern jet ends in a typical bow shock. The images in H and [SII] show two maxima of flux, separated in an east-west direction, and connected by fainter extended flux. One maximum is located east (ahead) of the bow shock traced in the lower excitation K-band image dominated by H2 lines, while the other maximum is behind the bow shock. This morphology matches the predictions of shock models. The highest excitations are found at the apex of the shock, and in the jet shock (the Mach disk). Lower excitations are found in the bow shock wings formed by material flowing sideways away from the main shock region. Other examples of this morphology have been discussed by Smith, Khanzadyan, & Davis (2003).
The diffuse emission in the western jet near the central source coincides with a ridge of sub-millimeter emission (Fig. 5, lower panel). The position of the optical knots HH 340 B and the corresponding H2 emission coincides with the edge of sub-millimeter clump B. This does not prove, but suggests that the western jet interacts with molecular clump B, and may play a role in triggering future star formation there.
The proper motion vectors are consistent with a curved jet for the system of Herbig-Haro knots in HH 343 and HH 340. Approximating the jet by an arc of a circle and dividing by the proper motion of the bow shock in the near-infrared, a kinematic age of the jet of 6000 years is obtained, which represents a lower limit to the true age of the jet. The projected jet axis has precessed by almost 90∘ in this time interval.
The more extended bow shock HH 350 (Bally, Devine, & Reipurth, 1996) lies to the south of the tip of HH 343 A, and is seen in H and [SII], but is not detected in the K band. Both its large size and lack of infrared emission suggest that it is not driven by the same source as HH 343 and 340. Rather, HH 350 is more likely part of the extended larger system of shock fronts possibly originating from IRAS 2 and containing HH 350, HH 14, and HH 351 (Bally, Devine, & Reipurth, 1996).
While a number of effects can cause an outflow to deviate from a straight line (Eislöffel & Mundt, 1997), a jet with S-shaped morphology and smooth curvature without discontinuities or kinks is most likely the result of a precessing driving source. Precessing jets have been discussed by Terquem (1998); Terquem et al. (1999), and Bate et al. (2000) in the context of disks in binary systems that are misaligned with the orbital plane. Bate et al. (2000) conclude that, typically, the disk will be forced into alignment with the orbital plane in approximately one precession period, which in turn is an order of magnitude longer (by about a factor of 20) than the binary orbital period. This view is supported by the fact that, to date, no precessing jets with multiple turns have been observed. The object discussed here is no exception. From the central driving source to the main bow shock, presumably the end of the jet, it has precessed by about one quarter turn. The kinematic age of 6000 years provides an estimate for the jet’s age under the assumption that this bow shock is the surface of first interaction with previously undisturbed molecular cloud material. The lack of any indication of other shock fronts farther away from the driving source makes this a plausible assumption.
Having observed roughly a quarter turn of the jet in 6000 years gives an estimate of the precession period of 24000 years, and therefore an estimate of the disk alignment time of the order of 2104 years, i. e., of order of the main accretion time on the protostar. Following Bate et al. (2000) a binary period of the order of 1000 years is implied, corresponding to a binary separation of 100 AU for a total mass of 1 M⊙ of the two components, a reasonable upper limit given the overall faintness of this source. For any plausible total mass, the binary orbit major axis is of the order of the size of our own Solar System. At the distance of 316 pc assumed here for NGC 1333, this corresponds to angular separations of the order of 0.1″to 0.3″. Direct detection of the two components in the sub-millimeter requires better spatial resolution than provided by existing interferometers.
3.2 The Driving Source of the Outflow
Figure 2 shows detailed images of NGC1333 J032845.3+310542 (K) at wavelengths from H to the K band and illustrates the dramatic changes in morphology with wavelength. The images at short wavelengths (H, [SII], I) show an object of cometary morphology with an apex in the north-east. At longer wavelengths, in the J, H, and K bands a northern lobe and a relatively concentrated flux maximum begins to be visible. The broad flux minimum that separates the north-eastern and south-western lobe is most pronounced in the J and H bands, but is less visible in the K band. This is the typical appearance of a bipolar nebula where direct radiation from the central star is blocked by an extended, possibly flared disk seen close to edge-on. The disk plane in NGC1333 J032845.3+310542 (K) is not precisely oriented edge-on to the observer, however. The south-western lobe is pointing toward the observer, consistent with the redshift found by Bally, Devine, & Reipurth (1996) in the HH 343 knots, and is therefore the only lobe visible at optical wavelengths. Due to the inclination of the disk we begin to see scattered light and possibly some direct light from the central star (or stars) in the H and K bands.
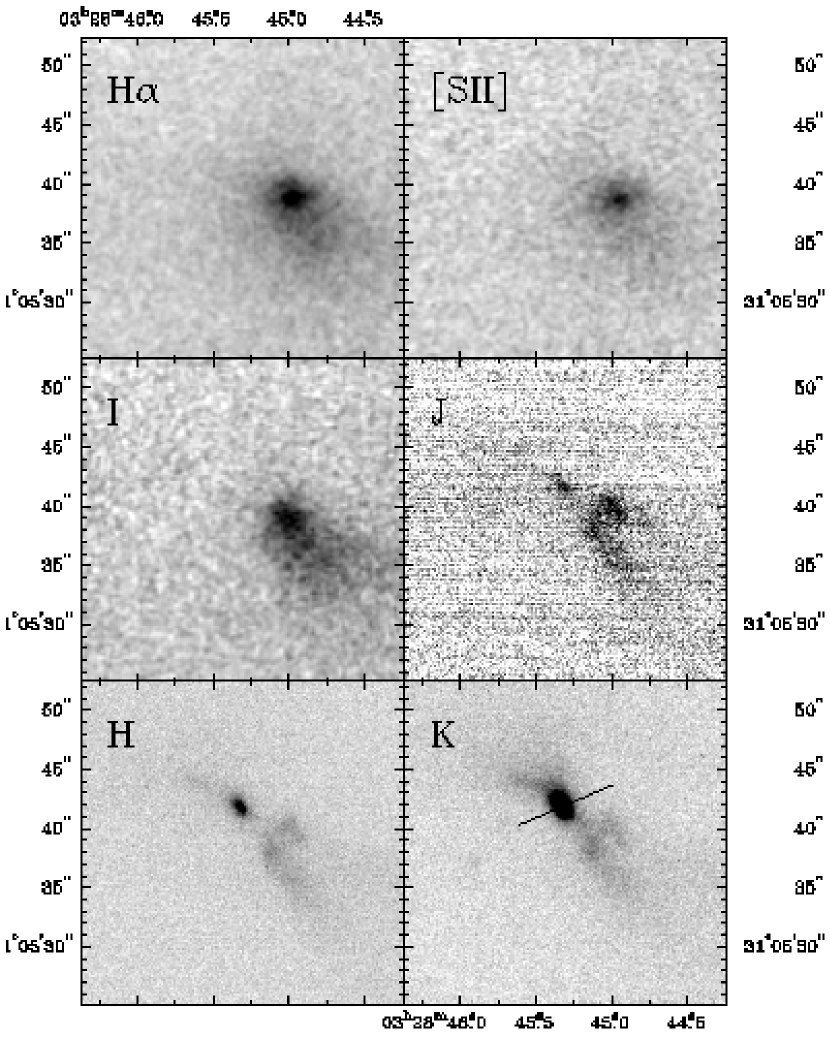
The flux maximum in the K-band has a polarization degree of p = 10.4% 2% at an angle of = 110∘ 5∘. The polarization angle is indicated in the K-band panel of Fig. 2. Its orientation perpendicular to the outflow axis is consistent with a strong component of scattered light contributing to the emission in this region, and is typical of deeply embedded class I outflow sources with bipolar morphology (Hodapp, 1984).
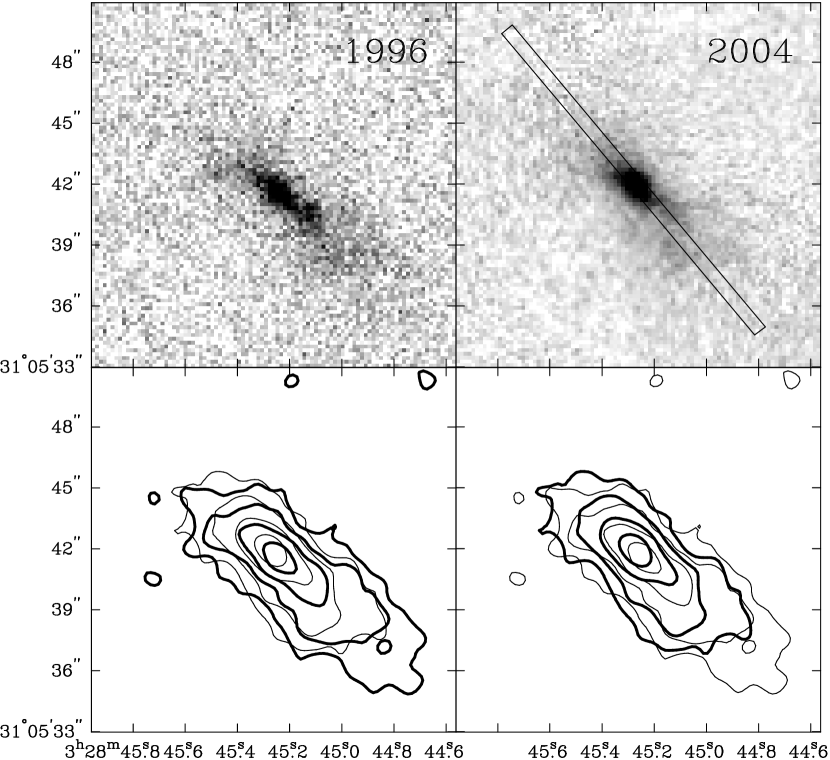
The morphology of NGC1333 J032845.3+310542 (K) has changed over the 8 years since we obtained the first infrared image. Fig. 3 shows images in the H2 1-0 S(1) emission line and adjacent continuum, taken 8 years apart with the same telescope, instrument, and filter. The flux maximum that spectroscopy and polarimetry shows to be scattered continuum radiation is more prominent in the 2004 image and has shifted by 0.5 to the north-east. Emission to the south of the brightest knot has diminished over these 8 years.
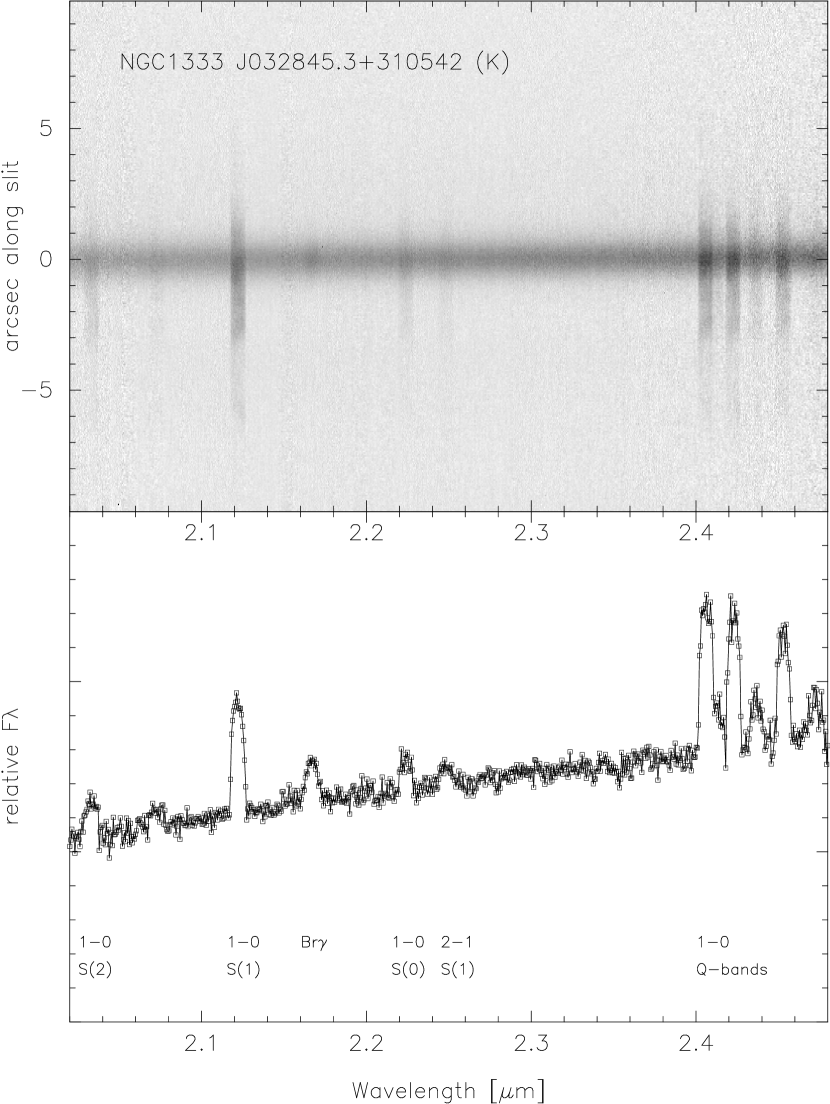
The K-band spectrum (Fig. 4) shows continuum emission only from the bright knot, and shows that the other features in the extended nebula are line emission from molecular hydrogen. While we do not have spectra of the object at wavelengths other than the K band, we suspect that most of the flux seen in the extended nebula at shorter wavelengths is also line emission. It is therefore likely that the driving source of the outflow is located within the knot of continuum emission at 03:28:45.3 +31:05:42 (J2000) that dominates the K-band image.
The K-band spectrum of NGC1333 J032845.3+310542 (K) is typical for a SED class I source. emission associated with the jet is superposed on the continuum spectrum of the central source. There are no detectable atomic or molecular absorption features, but emission of Br is observed. In low resolution spectra of late type stars, including low mass class II and class III YSOs, the NaI doublet at 2.206m and 2.209m and the CaI triplet at 2.261m, 2.263m, and 2.266m should be detectable in addition to the most prominent spectral feature in such stars, the CO bandheads (Hodapp & Deane, 1993). In their sample of spectra from stars in the L1641 cluster, the deeply embedded stars have pure continuum spectra, rising toward longer wavelengths. The most deeply embedded star in their sample shows H2 hydrogen emission lines in the same way as NGC1333 J032845.3+310542 (K) does. In the larger study by Greene & Lada (1996) it was confirmed that featureless, pure continuum near-infrared spectra are usually found in accreting protostars of SED class I, and are far less common in later SED classes. H2 emission is mostly associated with class I objects, where it is observed at the base of jets (Davis et al., 2001), and is much less prevalent in class II and III. Note that in our spectrum the line emission is extended along the IRCS slit, which is aligned with the outflow direction at the source.
In the sample studied by Greene & Lada (1996), Br emission was found in class I and class II objects. The Br emission in NGC1333 J032845.3+310542 (K) is more localized to the continuum source than the H2 lines. Br emission is in general more likely associated with the accretion than the outflow, as discussed by Muzerolle, Calvet, & Hartmann (1998) and Davis et al. (2001). It is consistent with our object being a class I source, but does not in itself strengthen this conclusion.
3.3 Sub-Millimeter Emission and Evolutionary Status
Fig. 5 shows the SCUBA map of IRAS 03256+3055 and its surroundings. As was noted by Young et al. (2003) this object is an extended sub-millimeter source consisting of several clumps. The position of the near-infrared flux peak closely coincides with clump D (Fig. 4) of sub-millimeter emission farthest to the south east of the complex emission associated with IRAS 03256+3055. This clump is clearly extended compared to the sub-millimeter point source A (see section 4) in our images. Extended sub-millimeter emission from star forming molecular clumps is characteristic of objects still surrounded by a substantial mass of dust and gas, i. e. class 0 sources (André, Ward-Thompson & Barsony, 1993).
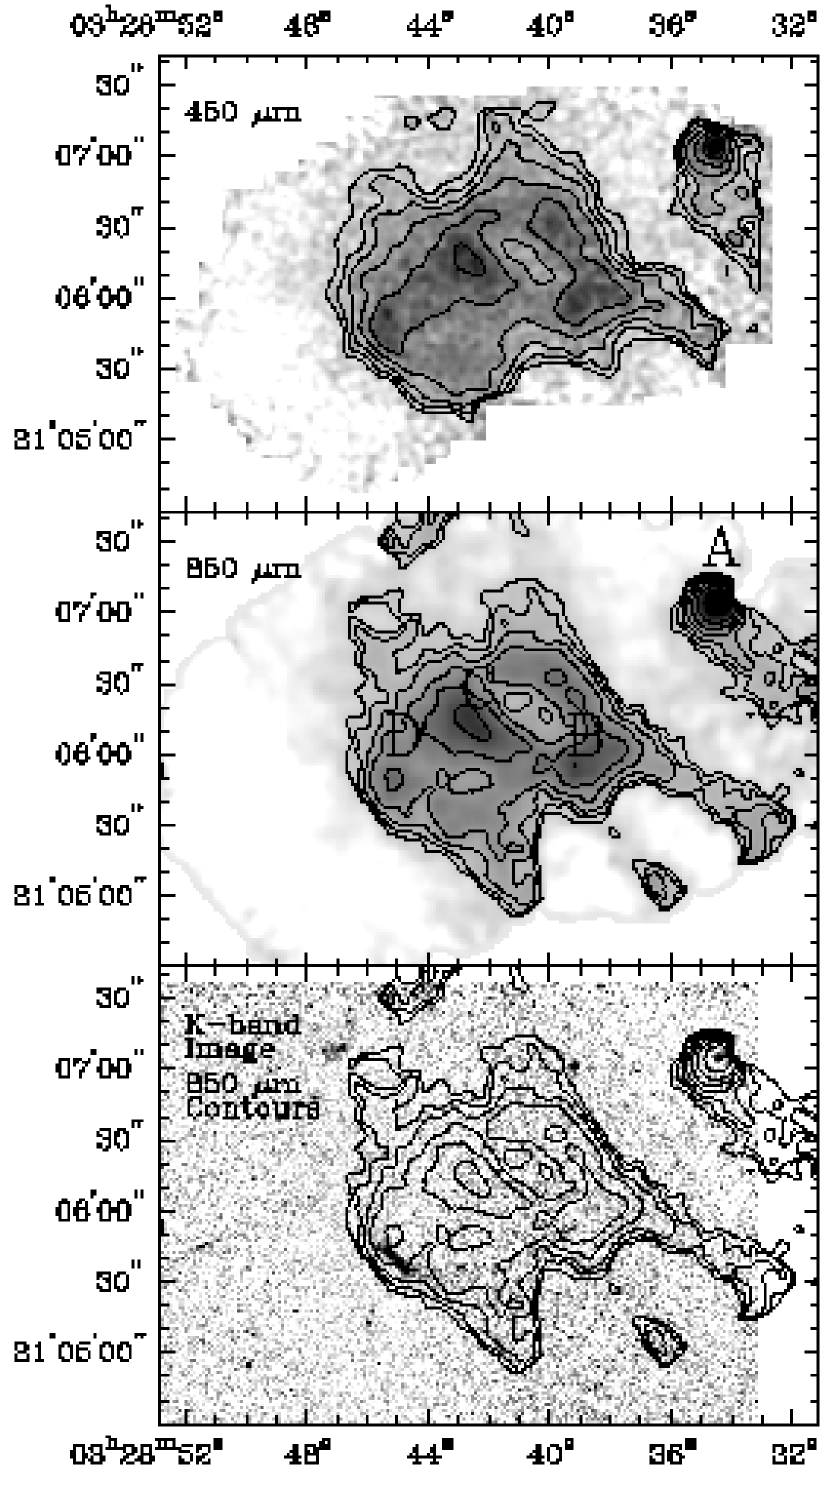
The bolometric temperature, integrated over all three clumps and the extended emission, is 16 K (Young et al., 2003), placing this object into the SED class 0. This value, however, is only based on 60m IRAS, and 450m and 850m SCUBA data and is therefore quite uncertain. They estimated the total luminosity to be only 0.7L⊙ and the total envelope mass to be 1.7 M⊙. The molecular core associated with IRAS 03256+3055 is fragmented into three individual clumps (B, C, and D in Fig. 5) and some extended emission. The molecular mass of clump D, which coincides with the driving source of the outflow, is therefore estimated to be about 1/3 of the total envelope mass estimated by Young et al. (2003).
Additional far-infrared fluxes of IRAS 03256+3055 have been measured by Clark (1991) from IRAS co-added scans. He reports fluxes of 0.02 Jy at 12 m, 0.15 Jy at 25 m, 1.6 Jy at 60 m, and 6 Jy at 100 m. The position of the IRAS source is consistent with the flux distribution seen in the sub-millimeter maps, i. e., the IRAS flux is not concentrated on the near-infrared source. At the resolution of the IRAS data no extension of the object is detectable. These additional data, showing some mid-IR flux from the object, point toward a slightly more advanced state of evolution than class 0. However, the IRAS data combine the flux from NGC1333 J032845.3+310542 (K) with the other near-infrared source NGC1333 J032834.5+310705 (K), that will be discussed below in section 4. This source is most likely a class I source and may have contaminated the low resolution IRAS data with mid-infrared flux.
The near-infrared spectrum of NGC1333 J032845.3+310542 (K) closely resembles that of an object of SED class I. Therefore, since class 0 and I sources in nearby star forming regions are readily detectable at sub-millimeter wavelength, we conclude that NGC1333 J032845.3+310542 (K) is the counterpart of the extended clump D of sub-millimeter emission, and not just a chance superposition. The well-defined H2 jet with a young kinematic age and the very low bolometric temperature point to possibly an even earlier evolutionary state. The low total luminosity of this region indicates a very low mass star or multiple system at the center of the outflow. The precession of the jet is best explained by a binary system with at least one accretion disk. With the caveat that better data, in particular higher spatial resolution FIR data, are needed to firm up this conclusion, we suggest that NGC1333 J032845.3+310542 (K) is a low mass binary system of protostars in or near the end of their main accretion activity phase.
Based on their sub-millimeter observations of the central part of NGC 1333 Knee & Sandell (2000) and Sandell & Knee (2001) concluded that secondary star formation in NGC 1333 is triggered in dense shells of gas swept up by a previous generation of outflows. The powerful outflows associated with the well known class 0 and I sources IRAS 1 - 9 in NGC 1333 (Bally, Devine, & Reipurth, 1996), all located 1 pc north of the IRAS 03256+3055 group, may have collectively triggered the formation of these dense molecular clumps. NGC1333 J032845.3+310542 (K) is the first (binary) protostar in IRAS 03256+3055 to reach the class 0 outflow stage, where it develops a jet readily detectable in the optical and near infrared. The jet from NGC1333 J032845.3+310542 (K) appears to impinge on molecular clump B (Fig. 5), suggesting this may be the next step in jet-induced triggered star formation in this region.
The IRAS 03256+3055 group of molecular clumps is not unique. In their extensive studies of the molecular cores in the Ophiuchus cloud, Motte, André & Neri (1998) find that most cores contain typically of order 10 dense molecular clumps. The typical linear extent of cores, and the projected separation of the individual clumps, are similar to that found in the IRAS 03256+3055 group. Due to the proximity of Ophiuchus (about half the distance of NGC 1333) and better resolution of their data, they are able to identify a larger number of individual clumps in each core. They also find that in the core Oph-A, star formation appears to have progressed from the outside in, presumably in response to an external trigger. Similarly the cluster of protostellar sources in Serpens NW was studied by Williams & Myers (2000). They identify 7 continuum millimeter emission sources in an area of roughly 0.2 pc extent, some of which are associated with outflow sources and therefore are protostars, and some that are probably pre-stellar.
4 The newly identified YSO NGC1333 J032834.5+310705 (K)
On our sub-millimeter maps, we found a compact, fairly bright sub-millimeter source west of the extended emission (labeled A in Fig. 5). This source was not included in the field recorded by Young et al. (2003). The compact component of this source has a flux of 650 mJy at 450m and 274 mJy at 850m, measured by comparing the peak flux in the map to maps of the calibration standard CRL618. The compact source is surrounded by extended emission that is mostly visible at 450 m, while it is not clearly distinguishable from the PSF at 850m. When integrating the extended emission by sky-subtracted aperture photometry, the net flux (as listed in Table 2) is 756 mJy at 450m and 271 mJy at 850m. The sub-millimeter source coincides with a faint, slightly extended source on our K-band image (Fig. 5, bottom panel) at position 03:28:34.5 +31:07:05 (J2000). The source, which we will refer to as NGC1333 J032834.5+310705 (K) is also faintly visible on the 2MASS K-band image. It can be seen in our S(1) image, albeit significantly fainter, indicating a very red color. It is invisible on the optical CCD images by Bally, Devine, & Reipurth (1996) and their later CCD data. NGC1333 J032834.5+310705 (K) has a cometary morphology, with the apex of the conical shape pointing to the east. On the basis of the strong compact sub-millimeter flux, and its near-infrared detectability and morphology we tentatively identify this source as a class I object. It cannot be determined if this object is physically close to the IRAS 03256+3055 group of sub-millimeter clumps or whether it is farther away along the line of sight.
5 Summary
We have presented optical and near-infrared images of the system of Herbig-Haro objects 340 B, 343 A-F, and their driving source, NGC1333 J032845.3+310542 (K) in NGC 1333. The Herbig-Haro objects and the H2 emission seen in the K band outline a jet of centro-symmetric S-shaped morphology, suggesting a precessing driving source. At wavelengths shorter than 2.2m, the central driving source is dominated by line emission from the south-western part of the jet, which is moving toward the observer. In the K-band, the flux is dominated by continuum radiation, polarized and therefore partly scattered, from the central source. The spectrum of this source is a steep continuum with some Br emission, characteristic of a class I source. The SED of the region based on sub-millimeter and IRAS data, suggests an evolutionary state of class 0 or I. The sub-millimeter maps at 450 and 850 m confirm the existence of a region of extended emission, probably a cluster of pre-stellar clumps. Clump D associated with the near-infrared object NGC1333 J032845.3+310542 (K) is probably the first in this cluster to begin forming a star.
References
- André, Ward-Thompson & Barsony (1993) André, P., Ward-Thompson, D., & Barsony, M. 1993, ApJ, 406, 122
- Bally & Reipurth (2001) Bally, J., & Reipurth, B. 2001, ApJ, 546, 299
- Bally, Devine, & Reipurth (1996) Bally, J., Devine, D., & Reipurth, B. 1996, ApJ, 473, L49
- Bate et al. (2000) Bate, M. R., Bonnell, I. A., Clarke, C. J., Lubow, S. H., Ogilvie, G. I., Pringle, J. E., Tout, C. A. 2000, MNRAS, 317, 773
- Clark (1991) Clark, F. O. 1991, ApJSuppl. Ser., 75, 611
- Davis et al. (2001) Davis, D. J., Ray, T. P., Desroches, L., & Aspin, C. 2001, MNRAS, 326, 524
- Eislöffel & Mundt (1997) Eislöffel, J. & Mundt, R. 1997, AJ, 114, 280
- Greene & Lada (1996) Greene, T. P. & Lada, C. J. 1996, AJ, 112, 2184
- Herbig (1998) Herbig, G. H. 1998, ApJ, 497, 736
- Hodapp (1984) Hodapp, K.-W. 1984, A&A, 141, 255
- Hodapp & Deane (1993) Hodapp, K.-W. & Deane, J. 1993, ApJSuppl., 88, 119
- Hodapp & Ladd (1995) Hodapp, K.-W. & Ladd, E. F. 1995, ApJ, 453, 715
- Hodapp et al. (1996) Hodapp, K.-W., et al. 1996, New Astronomy, 1, 177
- Holland et al. (1999) Holland, W. S., Robson, E. I., Gear, W. K., Cunningham, C. R., Lightfoot, J. F., Jenness, T., Ivison, R. J., Stevens, J. A., Ade, P. A. R., Griffin, M. J., Duncan, W. D., Murphy, J. A., & Naylor, D. A. 1999, MNRAS, 303, 659
- Knee & Sandell (2000) Knee, L. B. G. & Sandell, G. 2000, A&A 361, 671
- Kobayashi et al. (2000) Kobayashi, N., Tokunaga, A. T., Terada, H., Goto, M., Weber, M., Potter, R., Onaka, P., Ching, G., Young, T., Fletcher, K., Douglas, N., Robertson, L., Cook, D., Imanishi, M. & Warren, D. 2000, SPIE, 4008, 1056
- Lada & Lada (2003) Lada, C. J. & Lada, E. A. 2003, ARA&A 41, 57
- Motte, André & Neri (1998) Motte, F., Andre, P., & Neri, R. 1998, A&A, 336, 150
- Muzerolle, Calvet, & Hartmann (1998) Muzerolle, J., Calvet, N., & Hartmann, L. 1998, ApJ, 116, 2965
- Roche et al. (2003) Roche, P. F., Lucas, P. W., Mackay, C. D., Ettedgui-Atad, E., Hastings, P. R., Bridger, A., Rees, N. P., Leggett, S. K., Davis, C., Holmes, A. R., & Handord, T. 2003, SPIE, 4841, 901
- Sandell (1994) Sandell, G. 1994, MNRAS, 271, 75
- Sandell & Knee (2001) Sandell, G. & Knee, L. B. G. 2001, ApJ, 546, L49
- Smith, Khanzadyan, & Davis (2003) Smith, M. D., Khanzadyan, T., & Davis, C. J. 2003, MNRAS, 339, 524
- Terquem (1998) Terquem, C. 1998, ApJ, 509, 819
- Terquem et al. (1999) Terquem, C., Eislöffel, J., Paploizou, J. C. B., & Nelson, R. P. 1999, ApJ, 512, L31
- Tokunaga, Simons, & Vacca (2002) Tokunaga, A. T., Simons, D. A., & Vacca, W. D. 2002, PASP, 114, 180
- Williams & Myers (2000) Williams, J. P. & Myers, P. C. 2000, ApJ, 537, 891
- Young et al. (2003) Young, C. H., Shirley, Y. L., Evans II, N. J., & Rawlings, J. M. C. 2003, ApJSuppl. Ser., 145, 111