High-Resolution Measurements of the Halos of Four Dark Matter-Dominated Galaxies: Deviations From a Universal Density Profile11affiliation: Based on observations carried out at the WIYN Observatory. The WIYN Observatory is a joint facility of the University of Wisconsin-Madison, Indiana University, Yale University, and the National Optical Astronomy Observatory.
Abstract
We derive rotation curves for four nearby, low-mass spiral galaxies and use them to constrain the shapes of their dark matter density profiles. This analysis is based on high-resolution two-dimensional H velocity fields of NGC 4605, NGC 5949, NGC 5963, and NGC 6689 and CO velocity fields of NGC 4605 and NGC 5963. In combination with our previous study of NGC 2976, the full sample of five galaxies contains density profiles that span the range from to , where is the power law index describing the central density profile. The scatter in from galaxy to galaxy is 0.44, three times as large as in Cold Dark Matter (CDM) simulations, and the mean density profile slope is , shallower than that predicted by the simulations. These results call into question the hypothesis that all galaxies share a universal dark matter density profile. We show that one of the galaxies in our sample, NGC 5963, has a cuspy density profile that closely resembles those seen in CDM simulations, demonstrating that while galaxies with the steep central density cusps predicted by CDM do exist, they are in the minority. In spite of these differences between observations and simulations, the relatively cuspy density profiles we find do not suggest that this problem represents a crisis for CDM. Improving the resolution of the simulations and incorporating additional physics may resolve the remaining discrepancies. We also find that four of the galaxies contain detectable radial motions in the plane of the galaxy. We investigate the hypothesis that these motions are caused by a triaxial dark matter halo, and place lower limits on the ellipticity of the orbits in the plane of the disk of 0.043-0.175.
Subject headings:
dark matter — galaxies: dwarf — galaxies: halos — galaxies: individual (NGC 2976; NGC 4605; NGC 5949; NGC 5963; NGC 6689) — galaxies: kinematics and dynamics — galaxies: spiral1. INTRODUCTION
Over the last several years, one of the most persistent problems confronting the Cold Dark Matter (CDM) model has been the dichotomy between observed galaxy density profiles and those seen in cosmological simulations. The simulations generate dark matter halos with central density cusps of or steeper (e.g., Navarro, Frenk, & White, 1996; Moore et al., 1999). Observations of dwarf and low surface-brightness (LSB) galaxies, though, have usually shown that density profiles with shallow central cores, where the density is nearly constant with radius, fit the data better than cuspy profiles (Moore, 1994; Burkert, 1995; Blais-Ouellette et al., 1999; Blais-Ouellette, Amram, & Carignan, 2001; de Blok et al., 2001a; Borriello & Salucci, 2001; de Blok, McGaugh, & Rubin, 2001b; de Blok & Bosma, 2002; Salucci, Walter, & Borriello, 2003; Weldrake, de Blok, & Walter, 2003; Simon et al., 2003). This disparity is important because density profiles represent some of the strongest available constraints on the CDM simulations at small spatial scales.
Because most observational errors tend to make density profiles look shallower than they actually are, whether this disagreement is real or only apparent has been a point of contention. Recently, van den Bosch et al. (2000) and van den Bosch & Swaters (2001) put forth the argument that most existing rotation curves have neither the spatial resolution nor the velocity resolution necessary to test the simulations adequately. Swaters et al. (2003) extended this argument with simulations showing that even high-resolution data may be subject to numerous systematic effects that can make density profiles appear artificially shallow. However, de Blok & Bosma (2002) and de Blok, Bosma, & McGaugh (2003) use observations and simulations to reach the opposite conclusion: that systematic uncertainties do not significantly affect most observed rotation curves. In an attempt to resolve this debate, we began an effort to measure the density profiles of a sample of nearby dark matter-dominated galaxies at very high spatial and velocity resolution, using improved techniques to minimize the importance of systematic uncertainties.
In two previous papers, we reported on our results for the dwarf spiral galaxies NGC 4605 (Bolatto et al., 2002) and NGC 2976 (Simon et al., 2003). We found that NGC 2976 contains a nearly constant density core, while NGC 4605 has a density profile that is intermediate between the usually observed constant density cores and the cusps predicted by simulations. In this paper, we present similar analyses of three more nearby galaxies, NGC 5949, NGC 5963, and NGC 6689. Since our earlier study of NGC 4605 did not include a two-dimensional H velocity field, which prevented us from confirming the existence of the radial motions suggested by the CO data, we also update that work with an H velocity field, additional CO mapping, and new optical imaging. As before, we use high-resolution two-dimensional velocity fields to constrain the overall mass distribution, and optical and near-infrared imaging to model and remove the baryonic contribution to the rotation curve.
In the following section, we describe our observations and data reduction. We briefly explain our methods of modeling stellar disks and constructing tilted-ring models of the velocity fields, and refer the reader to Simon et al. (2003) for additional details. In §3, we present the results of our rotation curve analysis and fit the rotation curves with various functional forms. In §4 we discuss the most important implications of this work. We consider the effect on the derived density profiles of relaxing the assumption that dark matter halos are spherical in §5 and we present our conclusions in §6.
2. OBSERVATIONS, DATA REDUCTION, AND METHODOLOGY
The primary objective of this study is to derive very accurate rotation curves (and hence density profiles) of low-mass,111We refrain from using the term dwarf galaxy here to avoid confusion caused by the range of definitions of the term in the literature. We instead refer to our targets as low-mass galaxies, by which we mean that they are significantly less massive than giant galaxies like the Milky Way and thus can be expected to be dark matter-dominated. dark matter-dominated spiral galaxies. We use two-dimensional velocity fields to measure the rotation curves in order to avoid the systematic problems associated with long-slit spectroscopy (Swaters et al., 2003; Simon et al., 2003). Where possible, we obtain velocity fields at multiple wavelengths (e.g., H and CO) as a further guard against systematic errors. Modeling and removing the stellar disk is an important step in the derivation of the dark matter density profile, so we use multicolor imaging to obtain the best available estimate of the stellar mass-to-light ratio.
Our target galaxies were originally selected from the CO survey of nearby dwarf galaxies by Leroy et al. (in preparation) in the hope that we could map the CO emission in the centers of the galaxies with the BIMA interferometer. Only three galaxies in the survey (NGC 2976, NGC 4605, and NGC 5963) contained enough CO to produce useful interferometer maps, so we also added two more galaxies that were similar in mass (with rotation velocities of approximately 100 km s-1), distance (approximately 10 Mpc), inclination, and luminosity to the CO-rich dwarfs.
2.1. Target Galaxies and Observations
The properties of NGC 4605 are described by Bolatto et al. (2002). This late type galaxy has an absolute magnitude of M and it is located Mpc away (M. Pierce 2001, private communication). While NGC 4605 is classified as a barred galaxy (SBc), detailed images do not reveal evidence for the presence of a bar.
NGC 5949 is an Sbc galaxy of similar luminosity (M) at a larger distance. Since this galaxy was included in the Spiral Field I-band (SFI) Tully-Fisher survey, we can use the observed parameters given by Haynes et al. (1999a, b), corrected for Galactic and internal extinction and for turbulent broadening of the H I line, and the Tully-Fisher Relation determined by Giovanelli et al. (1997) to calculate a distance of Mpc.
NGC 5963 is an Sc galaxy associated with the NGC 5866 group (Fouqué et al., 1992). The nearest large galaxy in the group is NGC 5907, at a projected distance of 430 kpc, so it is unlikely that NGC 5963 is currently interacting with its neighbors. It has a heliocentric recession velocity of km s-1. There are no photometric distance determinations for this galaxy in the literature, so it is reasonable to assume that it lies at the distance of 13 Mpc implied by the Hubble flow222We use the Hubble Space Telescope Key Project value of km s-1 Mpc-1 (Freedman et al., 2001) for the Hubble constant. after correcting for the motion of the Local Group towards Virgo. The uncertainty on this distance is probably of order 3 Mpc. At 13 Mpc, NGC 5963 has an absolute magnitude of M.
NGC 6689 (also called NGC 6690) is listed as SBcd in NED and SBc in LEDA, but it is classified as an unbarred Sc galaxy in the UGC (Nilson, 1973), and Sd in the Third Reference Catalog of Bright Galaxies (de Vaucouleurs et al., 1991, hereafter RC3). No bar is evident in any of our optical or near-infrared images. We conclude that the conflicting classifications are due to the relatively high inclination of the galaxy and that NGC 6689 does not contain a bar. The galaxy is rather similar to the others (but more inclined), with a distance of 11 Mpc (again using the Virgocentric-flow-corrected velocity) and an absolute magnitude of M.
2.1.1 H Observations and Reductions
Our H observations were obtained on 2002 March 20-21, 2002 May 25-28, and 2003 April 15 at the 3.5 m WIYN telescope with the DensePak fiber array. See Barden, Sawyer, & Honeycutt (1998) and Simon et al. (2003) for details about the instrument and spectrograph setup, respectively.
We observed the galaxies at five to eleven positions, depending on the spatial extent of their H emission. These observations resulted in 350-650 independent velocity measurements for each galaxy. Exposure times ranged from 10 minutes to 60 minutes per position. The angular resolution of these data is 4″ and the velocity resolution is 13 km s-1.
The DensePak data were reduced as described by Simon et al. (2003). The only significant change in the data reduction resulted from the replacement of the CuAr comparison lamp with a ThAr lamp in 2002 May. The very bright Th lines near the wavelength of H allowed us to improve the accuracy of the wavelength solution by about a factor of two (to km s-1).
2.1.2 CO Observations and Reductions
Our 12CO () observations of NGC 4605 and NGC 5963 were acquired using the B, C, and D configurations of the 10-element BIMA array (Welch et al., 1996) between April 2001 and March 2002. The total integration time for each galaxy was hours, much of which was in the most extended (B) configuration. The CO emission in NGC 4605 extends beyond the BIMA primary beam diameter of , so we constructed a mosaic of observations made at several positions along the major axis of the galaxy. (The CO observations of the central field used in this paper are the same as those of Bolatto et al. 2002, and the other major axis fields are from the new mosaic.) Because of the greater distance of NGC 5963, the CO emission in that galaxy is much more compact and fits easily inside the primary beam. Observational setup and data reduction were identical to that described by Simon et al. (2003). Beamsizes and sensitivities were ( pc) and 24 mJy beam-1 for the NGC 4605 central field, and ( pc) and 70 mJy beam-1 for the outlying fields of the mosaic. For NGC 5963, the beamsize was ( pc) and the sensitivity was 31 mJy beam-1. We detected CO in NGC 5949 and NGC 6689 with observations at the UASO 12 m telescope (Leroy et al., in preparation), but the emission was not bright enough to map with BIMA.
2.1.3 Optical and Near-IR Imaging and Reductions
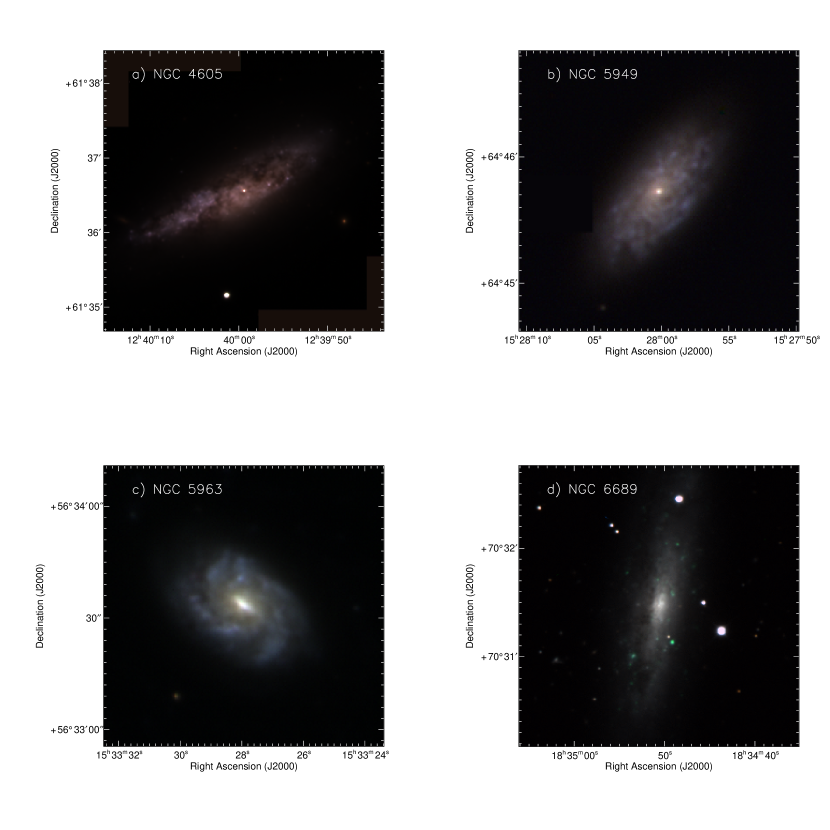
We observed NGC 4605 and NGC 5963 with , , , and filters at the 1.8 m Perkins Telescope at Lowell Observatory on 2002 February 11. NGC 5963 was also observed with much longer exposure times in and with the 1 m Nickel Telescope at Lick Observatory on 2003 June 23-24 in order to probe farther out into the LSB disk of the galaxy. NGC 5949 was imaged in , , , and at the Nickel on 2003 September 11, and NGC 6689 was observed in Sloan and bands with the Mosaic camera on the 4 m Mayall Telescope at Kitt Peak on 2003 October 20. All imaging took place under photometric conditions. Reduction and photometric calibration of these images followed the description of Simon et al. (2003). To extend our set of images to the near-infrared, we used the 2MASS , , and Atlas images of each galaxy. Three-color optical images of all four galaxies are displayed in Figure 1.
2.2. Isophotal fits and Stellar Disk Rotation Curves
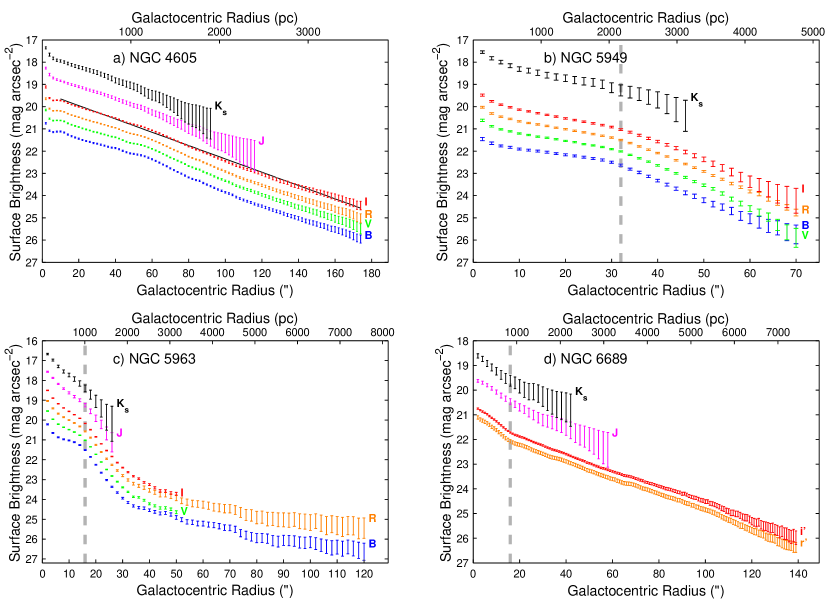
We used the optical/near-IR images of these galaxies to place reasonable limits on the contributions of their stellar disks to their rotation curves. We extracted surface brightness profiles from the images with the IRAF task ellipse, as described in Simon et al. (2003). For each image of each galaxy, we ran ellipse allowing the center position, position angle (PA), and ellipticity of the isophotes to vary with radius. We then defined the isophotal center of the galaxy in that band to be the weighted average of the ellipse centers. Ellipse was then run again with the center fixed, and we measured the weighted averages of the PA and ellipticity. We then averaged the isophotal centers333For the two galaxies with visually obvious nuclei (NGC 4605 and NGC 5949), we found that the isophotal centers were located quite close to the nuclei. In these cases, we fixed the ellipse centers on the nuclei instead of the formal isophotal centers., position angles, and ellipticities for each galaxy in every available band to define fiducial values. In cases where a trend as a function of wavelength was noticed for any of the parameters, values for the redder bands were given preference to minimize the importance of extinction. Finally, we ran ellipse one more time with all three parameters fixed in order to determine the final surface brightness profiles, which are shown in Figure 2. The measured isophotal parameters for each galaxy are listed in Table 1. Discussion of the various surface brightness profiles can be found in §3.5.
| Galaxy | (J2000.0) | (J2000.0) | PA | ellipticity | inclination |
|---|---|---|---|---|---|
| NGC 4605 | 12h39m5927 | 61°36′333 | 119° | 0.630 | 71.5° |
| NGC 5949 | 15h28m0069 | 64°45′477 | 144° | 0.535 | 64.6° |
| NGC 5963 | 15h33m2790 | 56°33′350 | 54° | 0.320 | 48.4° |
| NGC 6689 | 18h34m5018 | 70°31′271 | 170° | 0.690 | 76.0° |
Bell & de Jong (2001) showed that the color and stellar mass-to-light ratio () of a galaxy are correlated. In order to obtain an estimate at the mass-to-light ratios of our targets, we used the observed colors and the updated color-M/L relations given by Bell et al. (2003) to compute expected band mass-to-light ratios. For NGC 6689, since we do not have any optical observations in the Johnson-Cousins system, we instead used the relations Bell et al. (2003) defined for the Sloan magnitude system. Measured colors and mass-to-light ratios are given in Table 2. Two apparent flaws in the Bell et al. (2003) models are evident from our calculations: 1) the and colors do not predict consistent band mass-to-light ratios, and 2) the predicted band mass-to-light ratios appear to be significantly too high.
| Mean Inner | |||
|---|---|---|---|
| Disk ColoraaThese colors have been corrected for Galactic extinction and internal extinction. The Galactic extinction corrections were taken from Schlegel et al. (1998) and the internal extinction corrections were derived with the method of Sakai et al. (2000) using the axis ratios from our isophotal fits and H I velocity widths extracted from LEDA. | [] | [] | |
| NGC 4605 | |||
| Predictions from colorbbCalculated from the relations given in Appendix A of Bell et al. (2003). | 0.45ccNGC 4605 colors were measured for . | 0.94 | 0.72 |
| Predictions from colorbbCalculated from the relations given in Appendix A of Bell et al. (2003). | 0.82ccNGC 4605 colors were measured for . | 1.09 | 0.71 |
| Observed maximum disk values | 1.36 | 0.37 | |
| NGC 5949 | |||
| Predictions from colorbbCalculated from the relations given in Appendix A of Bell et al. (2003). | 0.63ddNGC 5949 colors were measured for . | 1.48 | 0.76 |
| Predictions from colorbbCalculated from the relations given in Appendix A of Bell et al. (2003). | 1.14ddNGC 5949 colors were measured for . | 1.80 | 0.78 |
| Observed maximum disk values | 2.07 | 0.49 | |
| NGC 5963 | |||
| Predictions from colorbbCalculated from the relations given in Appendix A of Bell et al. (2003). | 0.51eeNGC 5963 colors were measured for . | 1.09 | 0.73 |
| Predictions from colorbbCalculated from the relations given in Appendix A of Bell et al. (2003). | 0.97eeNGC 5963 colors were measured for . | 1.38 | 0.74 |
| Observed maximum disk values | 2.09 | 0.61 | |
| NGC 6689 | |||
| Predictions from colorbbCalculated from the relations given in Appendix A of Bell et al. (2003). | 0.22ffNGC 6689 colors were measured for . | 1.96ggNote that this mass-to-light ratio is actually calculated for the Sloan band, not the Kron-Cousins band. | 0.78 |
| Observed maximum disk values | 3.14 | 1.07 |
Stellar rotation curves were calculated via numerical integration of the stellar surface mass densities (derived from the observed surface brightness profiles) using the NEMO software package (Teuben, 1995). The primary assumption required by the NEMO implementation of this method is that the disks are infinitesimally thin. Removing this assumption leaves the shape of the stellar rotation curve unchanged but modestly lowers its amplitude.
2.3. Velocity Field Fitting
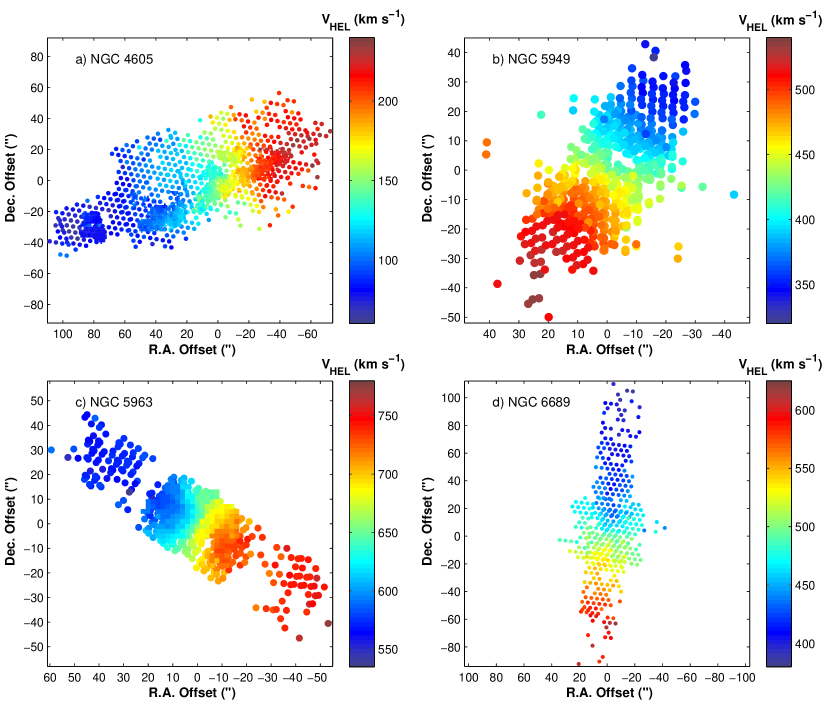
The velocity fields of the four galaxies are shown in Figure 3. The circles represent fiber-based H measurements, and the filled-in regions show CO measurements. In general, the velocity fields appear quite regular, with only NGC 4605 showing any sign that its kinematic and photometric minor axes might not be aligned.
2.3.1 Comparison of H and CO Data
For NGC 4605 and NGC 5963, we have resolved CO velocity fields in addition to the H observations. To check for agreement between these different data sets, we compared the H and CO velocities at every position where emission is visible from both species. In the case of NGC 5963, we find a mean offset of less than 1 km s-1, with a scatter of 7.8 km s-1, indicating excellent agreement between the H and CO velocities. For NGC 4605, only the westernmost molecular cloud has a velocity that agrees exactly with the velocity of the surrounding ionized gas. Elsewhere in the galaxy there is a small but consistent offset of 4.8 km s-1, in the sense that the H velocities are smaller. The scatter between the two velocity fields is 8.4 km s-1. Nevertheless, tilted-ring models based only on the CO velocity field match H-only tilted-ring models quite closely, so this velocity offset does not affect our results. Velocity differences of this magnitude are expected to arise from flows of the ionized gas away from molecular clouds (Fich, Treffers, & Blitz, 1982; Fich, Dahl, & Treffers, 1990). Since the H and CO data appear to be both reliable and consistent with each other, the velocity field fitting described in the following section was performed on the combined velocity data for these two galaxies.
2.3.2 Tilted-Ring Modeling and Error Analysis
We derived rotation curves for each galaxy in the same way as in Simon et al. (2003). Using the geometric parameters measured from the photometry (and listed in Table 1), we ran the tilted-ring modeling routine ringfit to extract the rotational, radial, and systemic velocities as a function of radius from the velocity fields. As detailed in Simon et al. (2003), ringfit is similar to the standard rotcur algorithm (Begeman, 1987) in that it includes both rotation and radial motions in its ring fits, but it does not allow the PA, inclination angle, or center to vary from ring to ring. Next, we applied a bootstrap technique to estimate the uncertainties in the PA, center position, and inclination angle. Typical bootstrap uncertainties were 1″ in RA and Dec, in PA, and in inclination. For all four galaxies, we found that the kinematic and photometric values of the PA, center, and inclination angle agreed within the errors.
After running the bootstrap, we constructed Gaussian distributions of each of the geometric parameters, assuming that the full width at half maximum of the Gaussian was equal to the bootstrap uncertainty. We then created 1000 Monte Carlo realizations of each rotation curve by randomly selecting a PA, center position, and inclination angle from the Gaussian distributions and running ringfit with the selected parameters as inputs. This process resulted in 1000 Monte Carlo rotation velocities at each radius. We then defined our final rotation curves to be the means of the Monte Carlo rotation velocities, and the uncertainties on the rotation curves to be the standard deviations of the Monte Carlo rotation velocities. The final radial velocity curves were derived in the same manner. By incorporating the uncertainties of the PA, inclination, and center position, this technique yields more realistic rotation curve error bars than simply propagating the very small velocity uncertainties from each spectrum through the analysis. The Monte Carlo uncertainties (which we refer to as systematic uncertainties) are always much larger than the statistical uncertainties calculated by standard error propagation. The uncertainties we use for the remainder of the paper are the sum in quadrature of the systematic and statistical uncertainties.
2.3.3 Higher Order Harmonic Fits
In addition to the standard use of ringfit described in the previous section, the algorithm can also be used to decompose the velocity field into Fourier components up to third order ( and ). If present, these higher order terms strongly suggest the existence of a bar or other non-axisymmetric perturbation to the gravitational potential. With enough S/N, the unique signatures of a bar, spiral arms, an elliptical potential, or lopsidedness can be detected (Schoenmakers, Franx, & de Zeeuw, 1997). We find weak evidence for nonzero higher order components in the velocity fields of NGC 4605, NGC 5949, and NGC 5963. Each galaxy has several adjacent rings in which the fits deviate from zero by (all four higher-order terms for NGC 4605, and for NGC 5949, and and for NGC 5963). Typical amplitudes of the higher order components are km s-1, which should not be large enough to affect our derivation of the density profiles in the following section. Although the significance of these components does not generally exceed 2.5 in a given ring, we argue that these detections are probably real because 1) a number of consecutive rings have consistent Fourier components, and 2) the rotation curve uncertainties appear to be overestimated (see §3.3). NGC 6689 does not have enough data points in most of its rings to obtain reliable higher-order fits. For comparison, we find km s-1 , , and components over small ranges of radii in the NGC 2976 velocity field studied by Simon et al. (2003). Including terms up to third order in the tilted-ring models (seven free ringfit parameters instead of three) does significantly improve the reduced value of the fits in many cases, but this is often because the number of data points in the ring is not much larger than seven so that the fit can go through every point. More detailed descriptions of the higher order motions in each galaxy can be found in §3.5.
3. Results
In this section we fit the rotation curves with a variety of functional forms to ascertain the shapes of the density profiles. We first consider the likely contribution of the stellar disk to the rotation curve, and then remove it from the data to reveal the rotation curve of the dark matter halo.
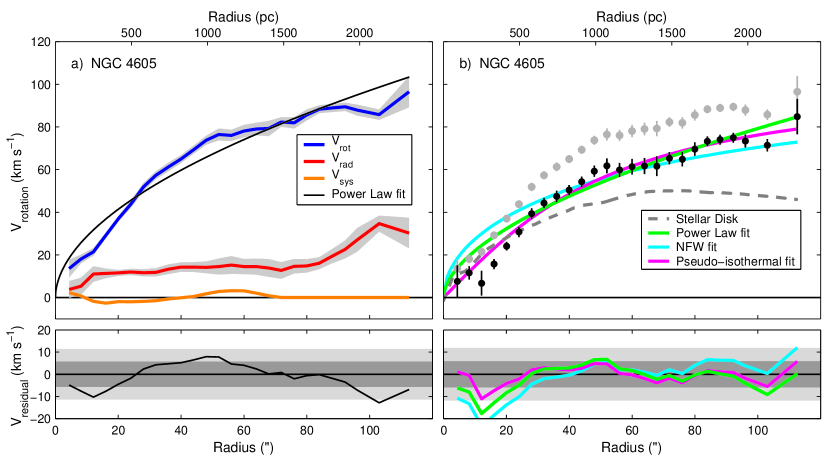
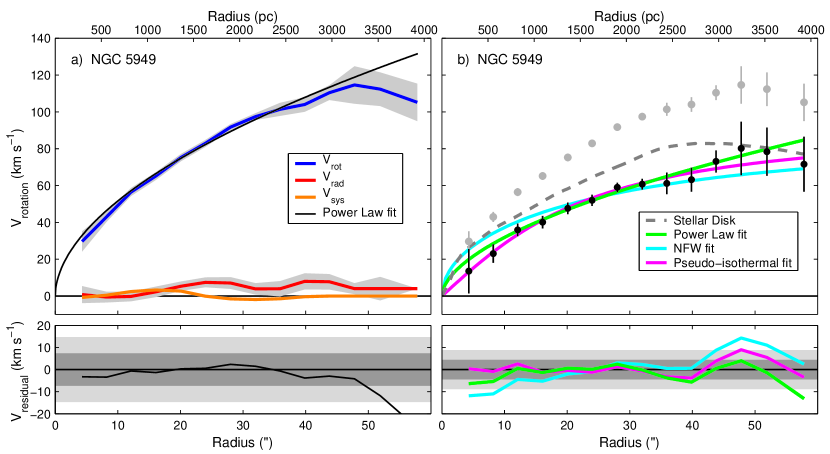
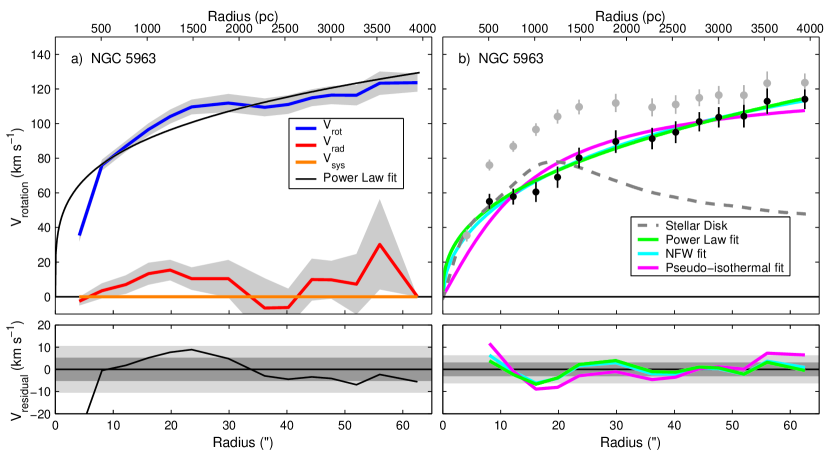
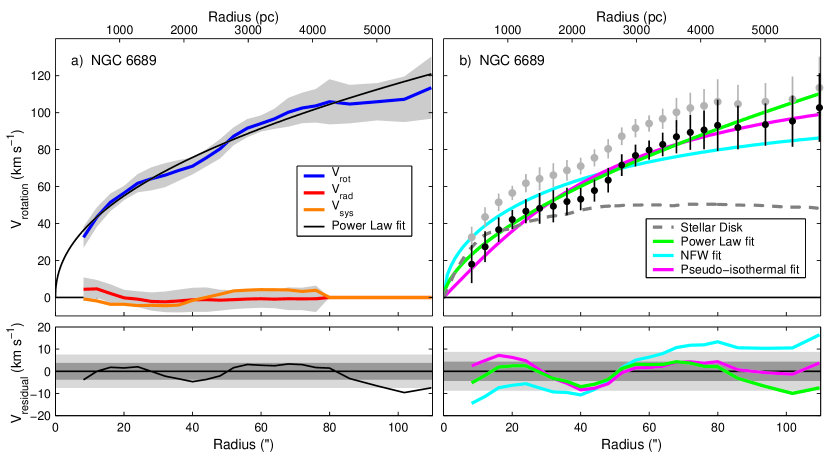
The rotation curves produced by the tilted-ring models in §2.3.2 are displayed in Figures 4a - 7a. Radial velocity curves and the uncertainties on both the rotation velocities and the radial velocities are also plotted in the same figures.
3.1. Removing the Baryons
What we are actually interested in are the rotation curves of the dark matter halos of these galaxies, which are only equivalent to the total rotation curves shown in Figures 4a - 7a in the minimum disk scenario (). We therefore need to account for the contribution of the baryons to the rotation curves. An upper limit on the dark matter rotation curve (and also the slope of the density profile) can be found if the disk mass is zero, and a lower limit to the dark matter rotation curve and density profile slope is obtained for a maximum disk. In general, for galaxies of normal surface brightness, the minimum disk solution is physically unrealistic and the actual mass distribution is likely to be closer to the maximum disk case.
We used the stellar disk rotation curves calculated in §2.2 to construct maximum disk models444 With the possible exception of NGC 6689, these galaxies do not appear to contain bulges, so the stellar disk is the only baryonic component that we model. Including the gas disk as well would increase the effective mass-to-light ratio of the disk somewhat, but does not affect our results (see following paragraph).. In order to avoid being unduly influenced by a single unrepresentative point in any of the observed rotation curves, we fit the inner five points of each rotation curve with a smooth function (a power law). We then incrementally increased the stellar mass-to-light ratio (the stellar rotation curve scales as ) until the stellar rotation curve exceeded the fit to the observed points. Because of the influence of the nucleus on the stellar rotation curve of NGC 4605, we ignored the innermost point of the fit to the observed rotation curve for that galaxy. With this procedure we defined the following maximum disk mass-to-light ratios: (NGC 4605), (NGC 5949), (NGC 5963), and (NGC 6689). Typical uncertainties on these values are %. For all of the galaxies, these kinematic mass-to-light ratios are significantly higher than the mass-to-light ratios predicted from the galaxy colors by the Bell et al. (2003) population synthesis models (see Table 2). We conclude the disks of these galaxies are probably somewhat submaximal. For the remainder of this paper, we adopt the following mass-to-light ratios (the average predicted from the and colors shown in Table 2): (NGC 4605), (NGC 5949), (NGC 5963), and (NGC 6689).
Note that since we do not have H I data, we are neglecting the contribution of the gas to the rotation curve in this analysis. In galaxies the size of our targets, however, the stellar disk almost always contributes significantly more mass at the center of the galaxy than the gas does and the effect of including the gas is similar to a change in the stellar mass-to-light ratio (Bolatto et al., 2002; Simon et al., 2003). If we arbitrarily increase to simulate this effect, the slope of the dark matter density profile (see below) decreases by %. Allowing the stellar disk to have a nonzero thickness (see §2.2) would offset this decrease.
3.2. Power Law Density Profile Fits
We can now consider the central density profile slopes of the dark matter halos of each galaxy. Following the notation of Simon et al. (2003), we parameterize the rotation curve by , which corresponds to a power law density profile: . Allowing the stellar mass-to-light ratios to vary from zero up to the maximum disk values determined in the previous paragraph, the limits we place on are given in Table 3. Obviously, the impact of changing the mass-to-light ratio on the density profiles is minimal for NGC 4605 and NGC 5949. These galaxies have very similar dark matter density profiles in the maximum and minimum disk cases, so their density profile slopes are tightly constrained.
| Galaxy | maximum disk | minimum disk |
|---|---|---|
| NGC 2976 | ||
| NGC 4605 | ||
| NGC 5949 | ||
| NGC 5963 | ||
| NGC 6689 |
The rotation curve fits for these limiting cases are displayed in Figures 4 - 7. In the left panel of each figure, a minimum disk power law fit is displayed, with the residuals from the fit in the lower panel. The right panel of each figure contains a power law fit to the dark matter halo in the maximum disk case, again with residuals shown in the lower panel. In all cases a power law provides a reasonable fit to the rotation curve at least out to the radius at which the rotation curve begins to flatten significantly (at which point the density profile slope is obviously changing with radius and a single power law cannot be expected to accurately represent the rotation curve). The numerical parameters of the power law fits for the disk-subtracted rotation curves are listed in Table 4, and for the total rotation curves (with no disk subtraction) in Table 5. The dark matter density profile slopes we derive after subtracting the stellar disks are for NGC 4605, NGC 5949, NGC 5963, and NGC 6689, respectively. If we fit the velocity fields without allowing radial motions, we find density profile slopes of . These changes are small (comparable to or less than the uncertainties) and go in different directions for different galaxies. We conclude that including radial motions in our tilted-ring models does not systematically affect the density profile slopes we derive.
| Power law | NFW | Pseudo-isothermal | ||||||||||
|---|---|---|---|---|---|---|---|---|---|---|---|---|
| fit parameters | fit parameters | fit parameters | ||||||||||
| Galaxy | c | ddAll values listed here actually represent the reduced ( per degree of freedom in the fits). | ddAll values listed here actually represent the reduced ( per degree of freedom in the fits). | ddAll values listed here actually represent the reduced ( per degree of freedom in the fits). | ddAll values listed here actually represent the reduced ( per degree of freedom in the fits). | |||||||
| [km s-1] | [kpc] | [kpc] | [km s-1] | [g cm-3] | [kpc] | |||||||
| NGC 2976aaUsing data from Simon et al. (2003). | 43.0 | 0.01 | bbNo meaningful NFW fits could be made for NGC 2976, even with only one parameter free. The “best” fit had . | bbNo meaningful NFW fits could be made for NGC 2976, even with only one parameter free. The “best” fit had . | bbNo meaningful NFW fits could be made for NGC 2976, even with only one parameter free. The “best” fit had . | bbNo meaningful NFW fits could be made for NGC 2976, even with only one parameter free. The “best” fit had . | 2.5 | 0.27 | 0.43 | 1.00 | ||
| NGC 4605 | 51.4 | 0.78 | 0.8 | 3.74 | 1.53 | 2.88 | ||||||
| NGC 5949 | 39.3 | 0.88 | 1.2 | 0.38 | 0.24 | 0.27 | ||||||
| NGC 5963 | 66.4 | 1.20 | 114.3 | 0.8 | 0.34 | 1.36 | 0.64 | |||||
| NGC 5963ccUsing the rotation curve presented in this paper plus the rotation velocities measured by Bosma et al. (1988) at . | 74.5 | 1.50 | 90.7 | 0.9 | 2.19 | 0.98 | 0.57 | |||||
| NGC 6689 | 37.8 | 0.79 | 2.1 | 0.30 | 0.46 | 0.30 | ||||||
| Power law | NFW | Pseudo-isothermal | ||||||||||
|---|---|---|---|---|---|---|---|---|---|---|---|---|
| fit parameters | fit parameters | fit parameters | ||||||||||
| Galaxy | c | ddAll values listed here actually represent the reduced ( per degree of freedom in the fits). | ddAll values listed here actually represent the reduced ( per degree of freedom in the fits). | ddAll values listed here actually represent the reduced ( per degree of freedom in the fits). | ddAll values listed here actually represent the reduced ( per degree of freedom in the fits). | |||||||
| [km s-1] | [kpc] | [kpc] | [km s-1] | [g cm-3] | [kpc] | |||||||
| NGC 2976aaUsing data from Simon et al. (2003). | 52.1 | 0.27 | bbNo meaningful NFW fits could be made for NGC 2976, even with only one parameter free. The “best” fit had . | bbNo meaningful NFW fits could be made for NGC 2976, even with only one parameter free. The “best” fit had . | bbNo meaningful NFW fits could be made for NGC 2976, even with only one parameter free. The “best” fit had . | bbNo meaningful NFW fits could be made for NGC 2976, even with only one parameter free. The “best” fit had . | 1.5 | 0.33 | 0.48 | 0.93 | ||
| NGC 4605 | 65.0 | 0.89 | 0.7 | 8.28 | 1.53 | 4.92 | ||||||
| NGC 5949 | 63.3 | 0.93 | 1.1 | 1.50 | 1.00 | 0.64 | ||||||
| NGC 5963 | 87.8 | 1.41 | 72.9 | 0.4 | 6.88 | 1.22 | 3.04 | |||||
| NGC 5963ccUsing the rotation curve presented in this paper plus the rotation velocities measured by Bosma et al. (1988) at . | 89.5 | 1.62 | 78.0 | 0.4 | 6.52 | 1.07 | 1.82 | |||||
| NGC 6689 | 53.1 | 1.07 | 203.6 | 1.1 | 0.32 | 0.95 | 0.42 | |||||
3.3. Alternative Density Profile Fits
In order to obtain a more complete understanding of the allowed shapes of the inner density profiles of the galaxies in our sample, we also fit the rotation curves with several other functional forms. The two most commonly used profiles in the literature are the pseudo-isothermal profile (an isothermal sphere with a central core) and the NFW profile555For our NFW fits, we chose the scale radius and the virial radius to be the two free parameters.. The functional form for the pseudo-isothermal density profile is
| (1) |
where is the central density and is the core radius (e.g., Kent, 1986).
Since pseudo-isothermal density profiles are not expected on theoretical grounds, and there is little observational support for NFW profiles, it is important not to limit ourselves to only these possibilities. Fitting the data with other density profiles can help to elucidate the physical meaning of the fits. We therefore also used a profile we defined to have characteristics intermediate between those of the pseudo-isothermal and NFW profiles:
| (2) |
where and are the characteristic radius and density. The inner slope of this profile is , giving it a shallow inner cusp. At large radii the slope is (corresponding to a flat rotation curve), so the fact that our observations only just reach the flat part of the rotation curve should not adversely affect the fits. Note that the values for fits to this function are given in Tables 4 - 5 even though we do not list and for each galaxy.
We used a -minimization routine to find the best fit parameters for each of these functions. With the exception of NGC 4605, in which small-scale bumps and wiggles in the rotation curve inflate , typical reduced values for the best fits were , suggesting that the systematic uncertainties on our rotation curves have been overestimated by a factor of about 1.7. Dutton et al. (2003) similarly inferred that our rotation curve error bars for NGC 2976 were overestimated, indicating that the bootstrap and Monte Carlo analysis described in §2.3.2 may be excessively conservative.
The results of these fits after removing the contribution of the stellar disk of each galaxy are summarized in Table 4, and fits without removing the stellar disk rotation velocities are given in Table 5. The best power law, NFW, and pseudo-isothermal fits (after subtracting the stellar disk) are displayed in Figures 4b - 7b by the green, cyan, and magenta curves, respectively. Residuals from each fit are shown in the same colors in the lower right panels of each figure.
With the exception of NGC 5963 (and NGC 6689 in the minimum disk case), we were unable to obtain reasonable NFW fits to the rotation curves. Since our data generally do not extend well into the flat part of the rotation curve, and are highly covariant. To prevent both parameters from running away to unphysically large values for NGC 4605, NGC 5949, and NGC 6689, we held fixed and only fit for . An infinite number of such fits are possible, with decreasing as and increase. The NFW fits listed in Tables 4 and 5 are for values chosen to keep low ( relative to the best fitting power law) without allowing to become completely unreasonable.
3.3.1 Fit Results
NGC 5963, strikingly, is best fit by a very steep () power law or an NFW profile unless its stellar mass-to-light ratio is unrealistically high. The formal best fit for NGC 4605 is a pseudo-isothermal profile, although none of the profiles have good values. The best power law (which does not describe the full rotation curve very accurately) still has a relatively steep slope. NGC 5949 is also best fit by pseudo-isothermal density profile, but power laws with slopes slightly shallower than NFW, and the modified pseudo-isothermal profile given in Equation 2, fit very well. NGC 6689 is better described by a power law than a pseudo-isothermal profile, and in the case of a low stellar M/L can even be fit by an NFW profile, although the scale radius and virial velocity suggested by the NFW fit are unrealistically large. For every galaxy except NGC 4605, Equation 2 (the modified pseudo-isothermal profile with a shallow central cusp) provides fits that are comparable to or better than the pseudo-isothermal profile.
3.3.2 Navarro et al. (2004) Density Profile
In addition to the profiles described above, we also fit the rotation curves (after removing the stellar disks) with the new density profile proposed by Navarro et al. (2004):
| (3) |
where and are the density and radius at which the logarithmic density profile slope equals and is an additional free parameter666Navarro et al. (2004) use instead of , but since we have defined to be the slope of a power-law density profile we adopt a different symbol here for clarity. that controls how fast the density profile slope changes with radius. The rotation curve associated with this density profile is
| (4) |
where is the lower incomplete gamma function. With the extra free parameter afforded by this function, we are able to achieve very good fits to the rotation curves of each of our five targets. In Table 6 we present the results of these fits and compare them to the fits Navarro et al. (2004) performed to four simulated dwarf galaxies that have total masses similar to our targets. Only for NGC 5963 are the fit parameters we derive remotely close to those measured by Navarro et al. (2004) in their simulations.
| Galaxy | aa values listed here actually represent the reduced ( per degree of freedom in the fits) | |||
|---|---|---|---|---|
| [kpc] | [g cm-3] | |||
| NGC 2976bbUsing data from Simon et al. (2003). | 1.65 | 8.99 | 0.26 | |
| NGC 4605 | 1.34 | 1.84 | 1.37 | |
| NGC 5949 | 3.85 | 0.67 | 0.25 | |
| NGC 5963 | 6.44 | 0.28 | 0.62ccThe three-parameter fit using only our data for NGC 5963 is degenerate. Better values than shown here can be achieved, but only when and run away to unrealistic values. We therefore fixed to the value obtained when the Bosma et al. (1988) data are included as well (see the following line of this table) and ran the fit with only two free parameters. | |
| NGC 5963ddUsing the rotation curve presented in this paper plus the rotation velocities measured by Bosma et al. (1988) at . | 6.04 | 0.28 | 0.43 | |
| NGC 6689 | 3325 | 0.12 | 0.31 | |
| D1eeSimulated dwarf galaxy halos from Navarro et al. (2004). | 4.55 | 0.164 | ||
| D2eeSimulated dwarf galaxy halos from Navarro et al. (2004). | 4.28 | 0.211 | ||
| D3eeSimulated dwarf galaxy halos from Navarro et al. (2004). | 3.62 | 0.122 | ||
| D4eeSimulated dwarf galaxy halos from Navarro et al. (2004). | 3.62 | 0.166 |
.
3.4. Comparison to Previously Published Rotation Curve Data
In the remainder of this section, we discuss details of our analysis of each galaxy. Readers who are primarily interested in the more general results of our work may wish to skip to §4.
Each of the four galaxies we observed have existing H or H I rotation curve data in the literature. Our new data should improve on previous measurements in velocity resolution, control of systematics, angular resolution (in the case of H I measurements), and sensitivity, but it is useful as a first-order test of the accuracy of our data to compare the rotation curves we obtain with previous measurements.
NGC 4605 has been the subject of several rotation curve studies (Rubin, Thonnard, & Ford, 1980; Sofue et al., 1998; Bolatto et al., 2002). All three of those studies derived very similar rotation curve shapes and amplitudes. While our methodology is different from that employed by the previous authors (we do not produce separate fits for the approaching and receding sides of the galaxy), our results are qualitatively in agreement. In particular, the break in the rotation curve at a radius of 40″ is quite apparent in the two recent data sets (the Rubin et al. 1980 rotation curve does not have enough angular resolution), and the maximum rotation velocities match well. The primary quantitative discrepancy is the result of the incorrect plate scale assumed by Bolatto et al. (2002) for the H spectrum they obtained. In that paper, we used a value of arcsec pixel-1, but subsequent measurements showed that the actual plate scale is arcsec pixel-1. Correcting this error reduces the extent of the H rotation curve by 30%, but should not substantially change the power law indices measured for the rotation curve and density profile. Indeed, our new rotation curve matches the old one near the center of the galaxy () and at large radii (). From 10″ to 30″ our rotation curve is a few km s-1 lower than the old one, and from 30″ to 65″ our rotation curve exceeds the old one by km s-1. The net effect of these changes777Note that the stellar disk we use is not the same as that of Bolatto et al. (2002). Bolatto et al. calculated the stellar rotation curve for an exponential disk and we use the actual surface brightness profile to determine the stellar rotation curve. Although the resulting stellar disks are not quite identical, the differences do not significantly affect the density profile results. is to modestly steepen the maximum disk density profile from (Bolatto et al., 2002) to . Given typical uncertainties on of 0.1 in our analysis (Simon et al., 2003), these results are marginally consistent. The earlier study by Persic & Salucci (1990) found a density profile of , also consistent with our results. The best fitting power law rotation curve at large radii still overestimates the rotation velocities in the inner region of the galaxy, as seen in Bolatto et al. (2002) and Figure 4a.
The rotation curve of NGC 5949 has previously been measured by Karachentsev & Petit (1990) and Courteau (1997) with long-slit spectra. The Karachentsev & Petit data are consistent with the rotation curve we derive, although our rotation velocities are somewhat larger and our measurements extend to larger radii. Our rotation curve matches that of Courteau within the uncertainties of the data.
The kinematics of NGC 5963 have been investigated in detail in two previous papers (Romanishin, Strom, & Strom, 1982; Bosma, Athanassoula, & van der Hulst, 1988). The shape of the H rotation curve measured by Romanishin et al. (1982) is very similar to the shape of our rotation curve; the amplitude they derive is slightly larger (asymptotic rotation velocity of 131 km s-1), but this appears to be the result of the smaller inclination angle they used. The H I rotation curve presented by Bosma et al. (1988) is perfectly consistent with our rotation curve over the common range of radii, except that the inner two points of their rotation curve are affected by beam smearing. For the fits presented in Tables 4 - 6, we give results for both our data alone, and our data with the Bosma, Athanassoula, & van der Hulst (1988) points at large radii added.
The H velocity field of NGC 6689 was observed by the GHASP survey (Garrido et al., 2003). Those authors found a decidedly asymmetric rotation curve, but the filter they used for the observations may have cut off the emission line profiles on the approaching side of the galaxy. The receding side of the rotation curve presented by Garrido et al. (2003) is consistent with the overall rotation curve we derive out to a radius of 45″, but at larger radii our rotation curve shows significantly smaller rotation velocities.
3.5. Comments on Individual Galaxies
3.5.1 NGC 4605
Of our four target galaxies, NGC 4605 is the only one that appears to deviate significantly from axisymmetry. The non-axisymmetric structures are visible both photometrically and kinematically. In broadband optical images, the galaxy contains a pronounced elongated region that is offset from its nucleus to the east. This feature, which has a somewhat higher ellipticity and a different position angle than the rest of the galaxy, persists out to K-band although it weakens with increasing wavelength. In Figure 8, we plot the isophotal fit parameters as a function of radius (where we now allow the isophotal center, PA, and ellipticity to vary from ring to ring), and the impact of the asymmetry is easily visible out to a radius of 70″. Since this lopsidedness is also apparent in our H image (the galaxy’s H emission extends to twice as large a radius on its eastern side as on the western side) and CO map, it may be associated with recent star formation.

The kinematic effects of this asymmetry are twofold: 1) the kinematic center of the galaxy is offset from the nucleus, and 2) the galaxy contains relatively large (and significant) noncircular motions. Tilted-ring models of the galaxy centered on the nucleus result in a systematic trend of the systemic velocity with radius. Moving the center position around so as to remove this trend and simultaneously minimize the scatter of the systemic velocities about their mean value, we found that the preferred kinematic center is southeast of the nucleus by 10″. Offsets of the kinematic center of this magnitude do not significantly change the slope of the density profile. Irrespective of the center position, the models also show a clear detection of radial motions in NGC 4605. The amplitude of these motions increases to 8 km s-1 at a radius of 20″, and then stays constant out to 80″. At larger radii (the outermost six rings) the radial motions begin to increase again, reaching 20 km s-1 at the edge of the galaxy (). However, this increase is not very well constrained due to the poor angular coverage of the velocity data at large radii. Unsurprisingly, we find small ( km s-1) but consistently nonzero , , , and terms in the velocity field of NGC 4605 at various ranges of radii between 16″ and 68″.
The combination of photometric and kinematic lopsidedness suggests that the mass distribution of the galaxy indeed is lopsided, as opposed to the possibility of asymmetric star formation mentioned earlier. Despite the lopsidedness of NGC 4605, the stellar disk is described well by an exponential profile, as shown in Figure 2a.
In order to determine the potential impact of these asymmetries on our density profile analysis, we considered the maximum changes they could cause. The photometric structure makes it difficult to choose an ellipticity and position angle that are representative of the whole galaxy. In §2.2 we used a weighted mean of the ellipticity and PA at radii between the outer edge of the asymmetric structure (at ) and the edge of the galaxy. As an alternative, we tried setting the ellipticity to its maximum and minimum values over the whole galaxy, and repeated the tilted-ring modeling and isophotal fitting. We found that the rotation curve and density profile shape are largely insensitive to changes in the inclination angle. Even for ellipticities as small as 0.56 () and as large as 0.73 (), the largest change in the derived value of is . We therefore conclude that our analysis is robust to the uncertainties introduced by the asymmetry of NGC 4605.
3.5.2 NGC 5949
The surface brightness profiles of NGC 5949 are very similar to those of NGC 2976 (Simon et al., 2003). Both galaxies contain a nucleus, a shallow (large scale length) inner disk, and a steep (small scale length) outer disk. Although other disk galaxies are known to have similar structures (e.g., Pohlen et al., 2002), the origin and physical significance of these two apparently distinct disks are not understood. Nevertheless, there is no reason to doubt that our thin-disk approximation is valid for this galaxy, so the shape of the stellar rotation curve we calculated should be accurate. Due to the high level of symmetry of NGC 5949 in all bands, the photometric inclination and PA are extremely well constrained, leading to very small systematic uncertainties on the rotation curve. It is worth noting that NGC 5949 is the only galaxy in our sample in which the shape of the stellar rotation curve is very similar to the shape of the observed rotation curve. Therefore, it is possible to model this galaxy with essentially only a stellar disk and barely any contribution from dark matter. The stellar mass-to-light ratio required to accomplish this is , 30 % higher than the derived maximum disk value.
Our tilted-ring modeling of NGC 5949 reveals a small radial component to the velocity field with modest significance. These radial motions are detected beginning at a radius of 20″, and remain present out to the edge of the galaxy. The maximum amplitude is 8 km s-1, and there are a total of six consecutive rings that have radial motions deviating from zero by at least . Since the radial motions are of the rotation speed at all radii, they should not affect our mass models of the galaxy. Note that because we do not know which side of the galaxy is closer to us, we cannot determine whether the detected radial motions correspond to inflowing or outflowing material. We also detect a km s-1 term from 24″ to 36″ and a km s-1 term from 12″ to 32″.
3.5.3 NGC 5963
Unlike the other three galaxies, the luminous component of NGC 5963 does not contain an easily identifiable exponential disk. At the center of the galaxy is a bright, elongated bar-like feature about 4″ across. Outside this source is a small disk-like region (500 pc in radius) with four tightly wound spiral arms. At a radius of 15″ (950 pc) the surface brightness profile begins a steep decline, falling by nearly 3 magnitudes over 18″. Surrounding this region is an LSB, nearly exponential disk that extends out to a radius of at least 120″ (see Figure 2c). The inner spiral arms can be traced out into this outer disk at very low surface brightness levels.
It is difficult to interpret this surface brightness profile in terms of the standard model of a disk galaxy. Ordinarily, one might assume that the bright central region of NGC 5963 is a bulge that just happens to be at the center of an unusually faint disk. The clear presence of spiral arms in this region, however, suggests that even here the galaxy is highly flattened. One possibility is that this structure is a pseudobulge that has formed via secular evolution of the galaxy (e.g., Kormendy & Kennicutt, 2004). The most sensible way to derive the stellar rotation curve in this case is to apply our standard assumption that the disk can be treated as infinitesimally thin. The assumption that the stellar mass-to-light ratio remains constant throughout this galaxy may not be correct, but since the stars are far from dominating the gravitational potential for reasonable mass-to-light ratios this should not substantially change our results.
NGC 5963 also contains noncircular motions. The radial term in the tilted-ring fits deviates from zero by more than in five rings, from 12″ to 30″. The radial motions reach as high as 15 km s-1 in this region, before beginning to oscillate about zero (with large uncertainties) at larger radii. The second-order Fourier terms in this galaxy both have amplitudes of km s-1 from radii of () and ().
3.5.4 NGC 6689
The high inclination of NGC 6689 makes our images and surface brightness profiles less revealing of details of its structure. Nevertheless, it is clear that this galaxy contains an exponential disk and a central light excess that could be attributable to a bulge or a bar. No bar is evident in our images, but as we noted in §2.1, some catalogs classify the galaxy as barred.
Despite the large inclination angle, the observed H emission lines from NGC 6689 are well represented by Gaussian fits. This implies that sightlines through NGC 6689 generally only intersect a single H II region, which is consistent with the appearance of the galaxy in a narrow band H image. Therefore, it is not necessary to use an envelope-tracing method (e.g., Sofue, 1996; Gentile et al., 2004) instead of Gaussian fits to extract rotation velocities from the spectra.
Neither our standard tilted-ring model nor the higher order harmonic fits detected any deviations from circular rotation in NGC 6689. To some degree, this is likely due to the inclination of the galaxy, which limits our resolving power along the minor axis where radial motions are most prominent. Nevertheless, a radial component of km s-1 as we found in the other three galaxies should have been detected if present.
4. DISCUSSION
4.1. Is There a Universal Density Profile?
The primary goal of this study is to determine as accurately as possible the inner density profiles of the dark matter halos of the galaxies we observed. At radii of kpc, does the dark matter density continue to increase, as predicted by NFW and numerous other theoretical studies? Or are the density profiles flat, with constant density cores, as most previous observers have concluded? Are the variations in density profile shape from galaxy to galaxy as small as the simulations suggest?
4.1.1 Observational Results
For two of the galaxies in our sample (note that for the remainder of the paper we include NGC 2976 in our analysis so that we have a total sample of five galaxies), these questions are easy to answer. NGC 2976, as Simon et al. (2003) showed, unambiguously contains a constant density core. An power law (constant density) provides an excellent fit to the rotation curve. A pseudo-isothermal profile with a core comparable to the optical size of the galaxy also produces a good fit. NGC 5963, on the other hand, quite clearly has a very steep central density profile. A power law with a slope of fits the rotation curve very well, and an NFW fit with kpc and a concentration parameter of 14.9 is nearly as good. A pseudo-isothermal fit is significantly inferior.
For the remaining three galaxies, the interpretation of the fit results is not nearly as straightforward. NFW fits to the disk-subtracted rotation curves can be carried out, but the fit parameters are not usefully constrained. Power laws with slopes between (NGC 4605) and (NGC 5949) fit the rotation curves well, but they are matched in each case by pseudo-isothermal profile fits with comparable or better reduced values.
How can a rotation curve be simultaneously consistent with both a pseudo-isothermal halo and an power law density profile? As shown by van den Bosch & Swaters (2001), the difference between the rotation curves associated with these density profiles tends to be smaller than typical observational uncertainties, even with the high velocity resolution of our data. The pseudo-isothermal profile has a slope that varies continuously from 0 (constant density) at its center to -2 (isothermal) at large radii. A power law, of course, has a constant slope that (for our fits) is intermediate between these two values. That both profiles fit the data suggests that 1) the mean density profile slope over the observed region is equal to the value preferred by the power law, but that 2) the slope changes with radius, which is better described by the pseudo-isothermal profile. Previous studies have often assumed that if a pseudo-isothermal rotation curve fits the data, then the galaxy in question must contain a constant-density core. Our successful fits with the modified pseudo-isothermal profile (Equation 2) show that this assumption is not correct. Even when a pseudo-isothermal profile fits well, other density profiles with steeper central slopes may provide equally good fits.
Taken together, these observational results argue against the proposition that all galaxies share a universal density profile. Common two-parameter profiles other than a power law cannot fit all of the galaxies in our sample, and even for power law fits the solutions span the range from constant-density to very cuspy. If a universal density profile exists, the scatter from halo to halo is large.
4.1.2 Simulation Results
The idea of a universal dark matter density profile traces back to NFW, and the most recent simulations continue to support this picture (Navarro et al., 2004; Diemand, Moore, & Stadel, 2004; Stoehr, 2004). The favored functional form of the universal profile, however, has not been agreed upon. For several years the debate focused on the exact value of the central cusp slope, but with the increasing resolution of the simulations it now seems that this question may be the wrong one to ask. The highest resolution CDM simulations reveal that dark matter density profiles do not converge to an asymptotic central slope (Power et al., 2003; Navarro et al., 2004; Diemand et al., 2004). Instead, the logarithmic slope continues to get shallower at smaller radii, and the best procedure for extrapolating the profiles to radii below the resolution limits888Note that the highest-resolution simulations currently have a resolution limit of pc, so another factor of improvement in the resolution is needed before the simulations reach the scales probed by observations. of the simulations is not clear.
The new density profile proposed by Navarro et al. (2004) (Equation 3) fits simulated dark matter halos more accurately and over a wider radial range than does the original NFW profile. All of the halos presented by Navarro et al. (2004) are well described by the new profile. A key difference between this profile and the classic NFW or Moore et al. (1999) profiles is that there is no well-defined central cusp. The density reaches a finite central value rather than diverging. On observationally relevant scales (100 to 1000 pc), though, the density profiles remain rather steep. Observations like ours with a resolution of tens or hundreds of parsecs would be expected to find density cusps only marginally shallower than an NFW profile. Only on sub-parsec scales does the logarithmic slope of this profile reach even (Navarro et al., 2004).
When the fits to Equation 3 for various halos are rescaled by the characteristic density () and radius () of each halo, they are all essentially identical, corroborating the hypothesis of a universal density profile. Diemand et al. (2004) confirm the ability of this functional form to fit their own independently simulated halos. However, Diemand et al. also show that a generalized three-parameter NFW profile with a formal central cusp is able to fit the halos nearly as well. Note that our observations still probe well below the scales that are resolved by the simulations, and it is unknown which, if any, of the profiles motivated by the simulations provides the most accurate extrapolation to smaller radii.
4.1.3 Comparison
Despite our lack of knowledge about the precise functional form of simulated density profiles at small radii, we can still compare our observational results with the profiles that fit the simulations best. In a general sense, it is obvious merely from inspection of Figures 4 to 7 (and Figure 10 in Simon et al. 2003) that the five rotation curves have rather different shapes. This visual impression is confirmed by the fits we performed in §3. If we use power laws to describe the density profiles, the mean slope is , with a dispersion of 0.44. By comparison, Diemand et al. (2004) find for the generalized NFW profile fits that the central power law index is . A more dramatic (although less intuitive) illustration of the difference between the observed and simulated density profiles is provided by our fits with the new Navarro et al. (2004) density profile. Although this formula fits our data well, as shown in §3.3.2 and Table 6, we derive values of ranging from 0.12 to 8.99. Even if we ignore the clearly absurd results for the flat density profile of NGC 2976, we find a mean value of , with a dispersion of 0.78. From the simulations, Navarro et al. (2004) measure and Diemand et al. (2004) are in agreement, finding . With the exception of NGC 5963, our fits are seriously discrepant with these results. If we force to lie within the range preferred for the simulated halos, the scale radius and scale density run away to unreasonable values (as can be seen in Table 6 for NGC 6689).
Thus, there are two notable differences between our results and the most recent CDM simulations: 1) the halo-to-halo scatter is times larger than the simulations, and 2) the observed central slopes are on average shallower than the simulations. Both of these differences present challenges for future simulations.
Although the shapes of the central density profiles we derive disagree with the theoretical predictions, the actual values of the central densities are relatively consistent with the simulation results. In Table 7 we give measured values for the dimensionless quantity introduced by Alam, Bullock, & Weinberg (2002) to parameterize halo central densities. In a CDM cosmology, the galaxies in our sample should have values between and (assuming NFW density profiles), similar to the values we observe. The galaxies do have a tendency to lie somewhat below the predicted level, but the difference is within the scatter expected for CDM.
| Galaxy | Distance | aaExtrapolated central surface brightness of the disk. | bbWe calculate the dynamical mass as , where is the maximum observed rotation velocity and is the largest radius our observations reach. Since the galaxies extend to much larger radii, these numbers clearly represent lower limits to the actual masses of each galaxy. | ccThe maximum rotation velocity of the dark matter halo after removing the stellar disk. | ddThe radius at which the dark matter rotation curve reaches half of , as defined by Alam et al. (2002). | eeThe mean dark matter density within , in units of the critical density. | |||||
|---|---|---|---|---|---|---|---|---|---|---|---|
| [Mpc] | [mag] | [mag arcsec-2] | [mag] | [] | [] | [deg] | [km s-1] | [pc] | |||
| NGC 2976ffUsing data from Simon et al. (2003). | 3.45 | 19.73 | 0.87 | 0.53 | 61.4 | 74 | 900 | 0.01 | |||
| NGC 4605 | 4.26 | 19.36 | 0.75 | 1.01 | 71.5 | 74 | 560 | 0.78 | |||
| NGC 5949 | 14.0 | 19.75 | 0.95 | 1.64 | 64.6 | 74 | 880 | 0.88 | |||
| NGC 5963 | 13.0 | 18.10 | 0.85 | 1.24 | 48.4 | 114 | 660 | 1.20 | |||
| NGC 6689 | 11.0 | 21.25 | 1.96ggThis mass-to-light ratio is calculated for the Sloan band, not the Kron-Cousins band. | 76.0 | 94 | 1330 | 0.79 |
4.2. The Significance of NGC 5963
Despite these differences from the simulations, the density profile of NGC 5963 appears to be in good agreement with the theoretical models. The rotation curve of this galaxy rises so rapidly than an NFW profile fits the data very well. A power law with a slope steeper than NFW provides an even better fit. To our knowledge, NGC 5963 is the only low-mass disk galaxy for which a CDM-like central density cusp is confirmed and shallow density profiles are ruled out.
Since NGC 5963 represents the exception rather than the rule, the question is, are all galaxies formed with cuspy density profiles and most lose them, or did an unusual event during the evolution of NGC 5963 caused its density profile to become so steep? The key to answering this question is identifying what about NGC 5963 makes it unique.
A number of galaxy properties from our sample are summarized in Table 7. Among these galaxies, NGC 5963 has the highest central surface brightness, despite its very low surface brightness outer disk. It also has the most unusual surface brightness profile (see §3.5.3), although the significance of this is not clear. NGC 5963 is at the brighter end of the luminosity range of our targets, but the total span between the five galaxies is only magnitude. It does have the largest rotation velocity, and therefore the highest mass, among our sample. Other than mass, the most obvious distinction between NGC 5963 and the other galaxies is the sharp transition between the inner and outer surface brightness profiles. This causes the derived stellar disk rotation curve to peak at small radii () and then drop steeply, making the outer parts of the galaxy highly dark matter dominated (see Figure 6b). Although this photometric structure may be related to the steep density profile of NGC 5963, we do not know its physical origin. If the galaxy really does contain a pseudobulge, then the processes that have funneled baryons toward the center of the galaxy could also have caused the dark matter to become more centrally concentrated.
It is also noteworthy that high resolution two-dimensional velocity fields and deep multicolor imaging are not necessary to recognize the unique dark matter density profile of NGC 5963. Using lower resolution H I data, a long-slit spectrum of modest resolution, and photographic and band imaging more than 15 years ago, Bosma et al. (1988) already concluded that this galaxy probably contains “an unusually centrally concentrated and massive halo”. Since high-resolution CDM simulations of galaxy structure had not yet been done Bosma et al. could not generalize this result into any broader implications for dark matter or galaxy formation.
4.3. NFW and Pseudo-Isothermal Fits to Rotation Curves
Our study is not alone in finding that pseudo-isothermal profiles fit many rotation curves better than do NFW profiles. A number of previous authors have reached similar conclusions (e.g., de Blok et al., 2001a; Borriello & Salucci, 2001; de Blok, McGaugh, & Rubin, 2001b; de Blok & Bosma, 2002; Salucci, Walter, & Borriello, 2003; Simon et al., 2003). We emphasize, however, that the observation that pseudo-isothermal fits produce lower reduced values than NFW or Moore profiles does not demonstrate the presence of a constant-density core. We showed in §3.3 that in many cases power law density profiles with intermediate () slopes provide comparable fits. A modified pseudo-isothermal profile with an central cusp (Equation 2) also fits these rotation curves as well as a true pseudo-isothermal profile with a constant-density core does. Since current theories of galaxy formation do not lead naturally to either cores or pseudo-isothermal density profiles, a preference for constant-density cores over shallow density cusps is not justified. Whether these galaxies actually contain a central region of constant density or if they have shallow cusps cannot be determined from the present data despite the high resolution of our measurements.
We do agree with past studies that for most galaxies the NFW form does not fit the inner density profile very effectively (see Figures 4b-7b). When and are constrained to stay roughly in the range expected from simulations, the values for NFW fits are generally rather high. We also point out, however, that the NFW fit parameters are quite poorly constrained unless the observations extend well into the flat part of the rotation curve. If there are only a few data points on the flat part of the rotation curve (especially when these data points have the largest uncertainties, as is often the case), they do not provide significant leverage on the fit. In such cases, the NFW scale radius and virial radius (or any other pair of parameters that can be used to describe an NFW profile) become completely degenerate. In order to obtain accurate estimates of the NFW fit parameters, our results suggest that % of the observed part of a galaxy must have a nearly flat rotation curve.
4.4. Implications for CDM
Combining this study with our previous analysis of NGC 2976, we have shown that the five galaxies in our sample have density profiles with a wide range of central slopes. If we fit the data with power laws, we find that three galaxies have central cusps of , while the other two galaxies have very different central slopes ( and ). Of the outliers, NGC 2976 is a satellite of M 81, and thus may have been subject to tidal stripping. There are suggestions in the literature that tidal stripping acts to remove density cusps (Stoehr et al., 2002; Hayashi et al., 2003), but the most recent simulations find that the central density slope is not altered by tidal effects (Kazantzidis et al., 2004b). It is not clear why NGC 5963 differs so strongly from the other galaxies. These fits demonstrate that while galaxies with steep central density cusps do exist, they are not shared by all galaxies. Furthermore, no single value of the central slope can describe all five of the rotation curves in our sample.
On the other hand, if we consider the pseudo-isothermal fit results (as most previous observational studies have done), we find that good fits can be obtained for four of the five galaxies (see Table 4). It is interesting to note that these galaxies all have central densities within a factor of seven of each other. Only for NGC 5963 is the quality of the pseudo-isothermal fit sufficiently poor that a constant-density core can be excluded. The rotation curves of the other four galaxies are consistent with cores, but all except NGC 2976 are also consistent with cusps. The implication of these findings is that some previous studies may have overestimated the disagreement between their data and the CDM simulations.
Based on these results, we reach the following conclusions:
-
•
First, the observed variation in density profile slopes from halo to halo is much larger than expected from the simulations. We also find that none of the commonly used density profile functional forms can describe all five galaxies.
-
•
Second, most galaxies have density profiles significantly shallower than the central cusps preferred by the simulations. Nevertheless, the difference between the central slopes we measure and the theoretical values is much smaller than suggested by most previous studies.
-
•
And third, some galaxies do contain cusps with an overall density profile that follows the NFW form, hinting that it may still be possible to reconcile the results of the pure dark matter cosmological simulations with observations.
Do these differences between the observations and the simulations indicate a fundamental problem with the CDM paradigm? Probably not. A great many plausible theoretical explanations have been proposed in attempts to understand this problem, and a few of the recent ideas are mentioned below. Taylor & Navarro (2001) suggested based on phase-space arguments that CDM density profiles should have cusps, very similar to the average we measure. Ricotti (2003) found that the dark matter halos of simulated dwarf galaxies have shallower cusps than those of massive galaxies. In a similar experiment, however, Colín et al. (2004) reached the opposite conclusion, so the degree to which dwarf galaxy density profiles are expected to match those of large galaxies has not yet been settled. Boylan-Kolchin & Ma (2004) showed that major mergers leave cuspy remnants unless both precursors had cores, so at least in the case of pure dark matter halos, mergers cannot destroy cusps. Baryonic processes, however, probably can (e.g., Weinberg & Katz, 2002). Even the dark matter itself may be able to flatten cuspy density profiles; Ma & Boylan-Kolchin (2004) argued that energy deposition by merging dark matter substructures can puff up central cusps into shallower density profiles. This effect might have escaped notice in previous simulations due to insufficient resolution or overmerging (unrealistic destruction of subhalos in dense regions). Finally, Hayashi et al. (2004) have shown that if dark matter halos are significantly triaxial (see §5), for some viewing angles the derived density profiles can appear much shallower than the actual density profiles.
Since we have shown that cuspy density profiles are consistent with a large fraction of our sample, and in light of the variety of potential effects not currently accounted for in the simulations that could change the predicted density profiles, there is little reason to conclude at this point that the density profile controversy represents a crisis for CDM.
5. THE EFFECTS OF HALO TRIAXIALITY
Almost every previous observational study of density profiles and rotation curves has assumed that dark matter halos are spherical. CDM simulations, however, suggest that dark matter halos are triaxial (Dubinski & Carlberg, 1991; Warren et al., 1992; Cole & Lacey, 1996; Jing & Suto, 2002). Unfortunately, very few observations of individual galaxies are available to test this prediction. Several polar-ring galaxies have been studied, with results ranging from axis ratios as small as 0.3-0.4 up to axis ratios of 1 (spherical halos) (Schweizer, Whitmore, & Rubin, 1983; Whitmore, McElroy, & Schweizer, 1987; Sackett & Sparke, 1990; Sackett et al., 1994; Combes & Arnaboldi, 1996; Iodice et al., 2003). A variety of techniques suggest that the gravitational potential of the dark matter halo of the Milky Way is close to spherical (Kuijken & Tremaine, 1994; Olling & Merrifield, 2000). Despite the scarcity of reliable constraints on individual halo ellipticities, statistical arguments provide a way to determine the average shape of galaxy halos. Franx & de Zeeuw (1992) show that the observed scatter in the Tully-Fisher (TF) relation places a strong upper limit on the allowed ellipticities of spiral galaxy disks. Even if all of the TF scatter is caused by elongated disks, the mean disk ellipticity is required to be less than 0.1. More likely, the scatter is a result of a combination of effects, indicating that on average disk ellipticities are 0.05 or smaller. In this section we consider the effects triaxial halos could have on the velocity fields we observe.
5.1. Halo Oblateness
Galaxy disks are expected to be oriented such that the disk lies in the plane described by the major and intermediate axes of the halo, with the -direction pointing along the halo minor axis (Sharma & Steinmetz, 2004; Bailin & Steinmetz, 2004). We first consider the effect of this flattening of the halo, under the assumption that halo shape in the disk plane is circular.
The rotation velocity of a disk in such an oblate spheroidal halo is given by Equation 2-91 in Binney & Tremaine (1987):
| (5) |
where is the density profile of the halo in the spheroidal coordinate (defined by ) and is the eccentricity of the spheroid. For any density profile, this integral can be evaluated numerically to give the rotation curve for various degrees of oblateness. We performed this calculation for spheroidal power laws () and NFW profiles (). The change from a spherical halo to an oblate one could affect both the shape of the rotation curve and its amplitude. We find that as the halo becomes flatter () the amplitude of the rotation curve increases (as expected, since the mass becomes concentrated closer to the disk). We also find that the shape of the rotation curve is completely independent of the halo flattening for a power law; the same power law index for the rotation curve (and density profile) is derived for any value of . For an NFW density profile the shape of the rotation curve changes very subtly with eccentricity (the peak of the rotation curve shifts to smaller radii as the halo becomes flatter), but the inner slope of the rotation curve is essentially unaffected.
5.2. Disk Ellipticity
In the previous subsection, we showed that the flattening of the halo does not alter the observed density profile for a circular disk. We now remove the assumption that the disk is circular and study the effects of disk ellipticity on the observed velocity field.
5.2.1 Are Noncircular Motions Common in Disk Galaxies?
Four of the five galaxies in our sample show evidence for a radial component to their velocity fields. In two of these, the radial motions are detected very strongly; for the other two the significance of the radial term is lower, although it is still confirmed at % confidence. Other recent studies have also begun to find significant numbers of galaxies with noncircular motions (Schoenmakers et al., 1997; Swaters et al., 2003; Coccato et al., 2004; Blais-Ouellette et al., 2004; Wong, Blitz, & Bosma, 2004). A large majority of the galaxies studied by these authors (and us) are not barred. However, of the galaxies in which observations could have detected radial motions, nearly all indeed appear to contain them. Are radial components to the velocity fields ubiquitous in late-type spiral galaxies? What is the cause of these motions?
5.2.2 Measuring Disk Ellipticity With Noncircular Motions
Since there is no strong evidence for bars in the four galaxies where we detect noncircular motions, other sources of these motions should be considered. First, we note that the observed noncircular motions are dominated by the radial component. The simplest possibility is that the galaxies contain strong radial flows directed towards their centers. Given the observed magnitude of the radial motions at a radius of kpc and an assumed volume density for the gas (1 H atom cm-3), if the radial motions actually represent a net inflow of gas we conservatively estimate that all of the gas would accumulate within a kpc radius of the galaxy centers in 1-3 Gyr. The star formation rate over the same region is at least an order of magnitude too small to consume the inflowing gas. We therefore conclude that this interpretation is not viable. The most intriguing remaining explanation is that the gas is moving on elliptical orbits, which could result from the influence of a triaxial dark matter halo.
In a disk galaxy with a triaxial dark matter halo, the potential in the plane of the disk will in general be elliptical. The closed orbits in such a potential are also ellipses, which means that the observed line-of-sight velocities of an elliptical disk will differ from pure circular rotation. This problem has been considered in detail by Binney (1978), Teuben (1991), Franx, van Gorkom, & de Zeeuw (1994), Schoenmakers et al. (1997), and Schoenmakers (1998). Franx et al. (1994) showed that an elliptical potential induces components in the velocity field proportional to the ellipticity and the angle between the long axis of the ellipse and the observer’s line of sight. Adopting their formalism (Franx et al. 1994, Equation A10), we have the following relations:
| (6) | |||
| (7) |
where and are the (rotation) and (radial) components of the tilted-ring model, respectively. The hat symbols indicate that these quantities are derived under the assumption of circular orbits, and will therefore differ systematically from the true values if the potential is elliptical. These formulae are valid when the rotation curve, , can be represented as a power-law with index , which we have shown is a reasonable assumption for these galaxies. is related to by . is the axis ratio of the galaxy, which we take from the photometry, is the angle between the long axis of the potential and the line of sight, and is the ellipticity of the orbit. The relationship between the ellipticity of the potential, , and that of the orbit, , is given by Franx et al. (1994):
| (8) |
In order for us to make the simplifying assumption that the apparent rotation velocities are equal to the true rotation velocities (i.e., that the orbits are nearly circular), the following condition must be met:
| (9) |
In this case, Equation 6 reduces to . Substituting this expression into Equation 7 and solving for the potential ellipticity yields
| (10) |
Thus, if the observed noncircular motions are indeed due to an elliptical potential in the plane of the disk, the amplitudes of the circular and radial motions put a direct constraint on the ellipticity. Note that since this constraint is actually a lower limit on . Using the known values of and , and the results of our tilted-ring models for and , we calculate as a function of radius for each galaxy. The results are shown in Figure 9. NGC 4605, with its very strongly detected radial motions, has a large and nearly constant ellipticity that deviates significantly from zero beginning at a radius of 20″. The mean value of over the entire galaxy is , making the disk of this galaxy substantially elliptical. From Equation 8, we see that , so the ellipticity of the potential is at least 0.03. is detected at the level in NGC 5949 and NGC 5963. We find that for NGC 5949 and for NGC 5963. We do not detect any evidence for elliptical orbits in NGC 6689: . NGC 2976 is the only galaxy in which the ellipticity is not constant with radius. This could suggest that either the halo structure is more complicated in this galaxy (e.g., the axis ratios of the halo change with radius), or that its radial motions may be caused by something other than triaxiality. If the halo of NGC 2976 is triaxial, the mean ellipticity of the disk orbits is .
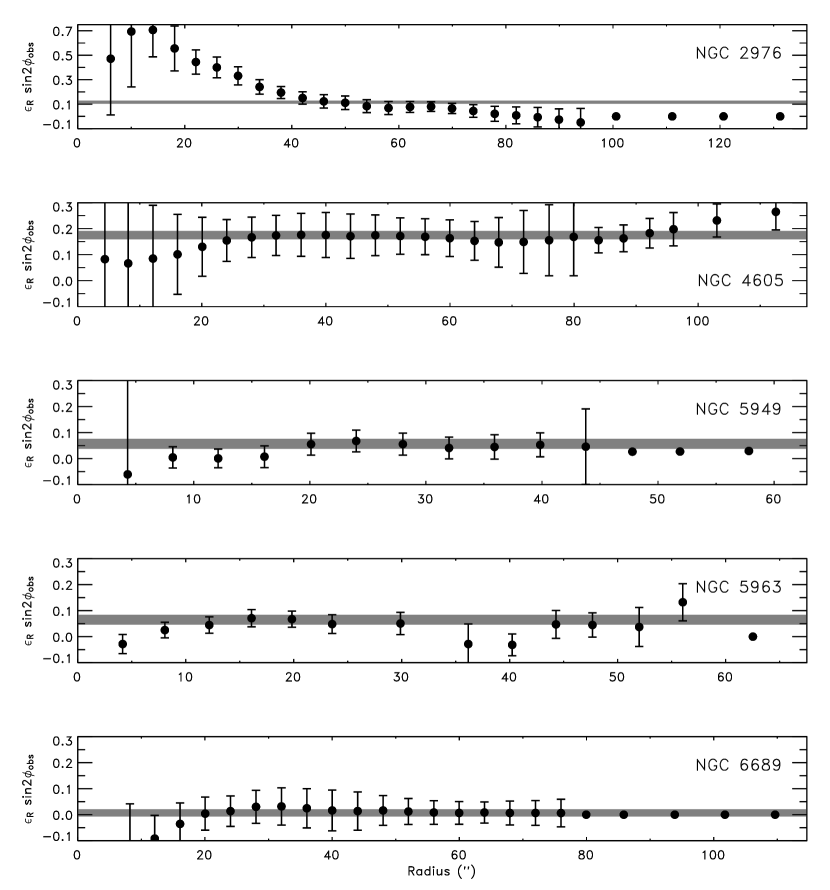
Given the determination of , we can now go back and confirm that the assumption stated in Equation 9 (that the difference between the apparent and true rotation velocities is small) was justified. As long as the ellipticity is modest (, which requires that the viewing angle be larger than for most of these galaxies), this condition will be satisfied. Note, however, that for NGC 4605 may be larger than this value.
These calculations show that, if the observed radial motions are indeed due to halo triaxiality, the lower limit on the mean potential ellipticity is of order a few percent. Since the scatter in the TF relation indicates that the average ellipticity of the potential has a strict upper limit of 0.1 (Franx & de Zeeuw, 1992), the ellipticities are now constrained within a relatively narrow range. CDM simulations predict that the dark matter halos of galaxies similar in mass to our targets should have axis ratios of and (Jing & Suto, 2002), which would suggest larger ellipticities than we measure. Bailin & Steinmetz (2004) find somewhat less triaxial halos with and for halos with masses of . Adding gas cooling to the simulations, however, may make the inner regions of the halo much more spherical (Kazantzidis et al., 2004). With observations of a larger sample of galaxies, it may be possible to obtain robust constraints on the three-dimensional shapes of galaxy halos, which would then provide another strong test of CDM simulations on small scales.
6. SUMMARY AND CONCLUSIONS
We have used two-dimensional CO and H velocity fields, sampled at high spatial resolution and high spectral resolution, to constrain the dark matter density profiles of four nearby, low-mass, late-type galaxies. We obtained rotation curves from the data cubes by constructing tilted-ring models, and found that three of the four galaxies contain radial motions in addition to rotation. Combining these data with the observations of NGC 2976 presented by Simon et al. (2003) gave us a sample of five galaxies to study.
For each galaxy we constructed a model of the stellar disk and investigated the density profile of the dark matter halo under varying assumptions about the stellar mass-to-light ratio. In most cases, over the range of plausible mass-to-light ratios, the dark matter density profiles do not change significantly. For the mass-to-light ratios indicated by the galaxy colors, we found that the five galaxies span a range of central density profile slopes from to . The mean slope is , with a dispersion of 0.44. Neither of the standard density profile functional forms (pseudo-isothermal and NFW) is able to adequately fit all five galaxies. The scatter in slope that we observe is three times larger than that seen in the simulations, and the mean slope is smaller than predicted. We do note, however, that NGC 5963 is the first low-mass disk galaxy in which a cuspy density profile of the predicted form is confirmed, while shallower alternative profile shapes are ruled out.
Although these results still indicate significant disagreements between CDM simulations and the properties of real galaxies, there are also some differences between the findings of this paper and those of previous observational analyses. Many authors have concluded that density profiles with constant-density cores fit the rotation curves of dwarf and LSB galaxies better than cuspy density profiles do (e.g., de Blok et al., 2001a; Borriello & Salucci, 2001; de Blok et al., 2001b; de Blok & Bosma, 2002; Salucci et al., 2003; Simon et al., 2003). Typical results from these studies are that the distribution of density profile slopes is (de Blok et al., 2001a; de Blok & Bosma, 2002; de Blok et al., 2003). Some other studies agreed that cored profiles generally fit the data better, but argued that this effect is primarily the result of systematic uncertainties in the observations (van den Bosch et al., 2000; van den Bosch & Swaters, 2001; Swaters et al., 2003). When we fit power laws to the rotation curves we find significantly steeper density profile slopes on average than previous authors did, although both pseudo-isothermal density profiles (constant-density cores) and relatively cuspy profiles are consistent with our data. Despite our disagreement on the value of the mean slope, we agree with other recent studies that found that dark matter density profiles span a wide range of slopes (e.g., de Blok et al., 2003; Swaters et al., 2003).
What is responsible for the steeper slope that we find? One important element of our study is that the two-dimensional velocity fields, high spatial resolution, and target selection we employed significantly reduce the impact of systematic uncertainties on our results (Simon et al., 2003). As an illustration of this point, van den Bosch & Swaters (2001) showed that to obtain tight constraints on density profile slopes, at least one of the three following conditions must be met: 1) the uncertainties on the rotation curve must be km s-1, 2) the rotation curve must extend out beyond 20% of the virial radius, and 3) the rotation curve must extend inward to radii less than % of the virial radius. While we do not reach the velocity precision of criterion (1), we approach it as closely as feasible, with typical systematic uncertainties as small as km s-1. Although higher velocity resolution spectroscopy is possible, our velocity measurements have already run into the limit imposed by the small-scale random motions of km s-1 that most galaxies appear to contain. Without H I observations at large radii, we also fail to meet criterion (2), but our high spatial resolution does allow us to satisfy criterion (3). Galaxies with masses similar to those studied here may have virial radii of 50 - 75 kpc (Bullock et al., 2001; Navarro et al., 2004), so even for our most distant targets our pc resolution probes well within 2% of the virial radius. In addition, we explored functional forms for the density profiles other than the standard NFW/pseudo-isothermal dichotomy, thereby demonstrating that good pseudo-isothermal fits in general do not rule out cuspy density profiles. Given these new results, we conclude that while the discrepancies between CDM and galaxy rotation curves may not be as severe as previously thought, improved simulations are needed in order to determine whether the theoretical and observational findings can be brought into agreement.
Finally, we considered the origin of the noncircular motions that are now being detected regularly in disk galaxies. A number of previous authors have showed that a triaxial dark matter halo can produce exactly the observed effect on the gas orbits. Under the assumption that halo triaxiality is causing the noncircular motions, we measure lower limits to the orbital ellipticities of 0.02-0.17. These correspond to lower limits on the ellipticities in the potential between 0.005 and 0.03.
References
- Alam, Bullock, & Weinberg (2002) Alam, S. M. K., Bullock, J. S., & Weinberg, D. H. 2002, ApJ, 572, 34
- Bailin & Steinmetz (2004) Bailin, J., & Steinmetz, M. 2004, submitted to ApJ (preprint: astro-ph/0408163)
- Barden, Sawyer, & Honeycutt (1998) Barden, S. C., Sawyer, D. G., & Honeycutt, R. K. 1998, Proc. SPIE, 3355, 892
- Begeman (1987) Begeman, K. G. 1987, Ph.D. thesis, Kapteyn Institute
- Bell & de Jong (2001) Bell, E. F., & de Jong, R. S. 2001, ApJ, 550, 212
- Bell et al. (2003) Bell, E. F., McIntosh, D. H., Katz, N., & Weinberg, M. D. 2003, ApJS, 149, 289
- Binney (1978) Binney, J. 1978, MNRAS, 183, 779
- Binney & Tremaine (1987) Binney, J., & Tremaine, S. 1987, Galactic Dynamics (Princeton, NJ: Princeton University Press)
- Blais-Ouellette, Amram, & Carignan (2001) Blais-Ouellette, S., Amram, P., & Carignan, C. 2001, AJ, 121, 1952
- Blais-Ouellette et al. (2004) Blais-Ouellette, S., Amram, P., Carignan, C., & Swaters, R. 2004, A&A, 420, 147
- Blais-Ouellette et al. (1999) Blais-Ouellette, S., Carignan, C., Amram, P., & Côté, S. 1999, AJ, 118, 2123
- Bolatto et al. (2002) Bolatto, A. D., Simon, J. D., Leroy, A., & Blitz, L. 2002, ApJ, 565, 238
- Borriello & Salucci (2001) Borriello, A., & Salucci, P. 2001, MNRAS, 323, 285
- Bosma, Athanassoula, & van der Hulst (1988) Bosma, A., Athanassoula, E., & van der Hulst, J. M. 1988, A&A, 198, 100
- Boylan-Kolchin & Ma (2004) Boylan-Kolchin, M., & Ma, C. 2004, MNRAS, 349, 1117
- Bullock et al. (2001) Bullock, J. S., Kolatt, T. S., Sigad, Y., Somerville, R. S., Kravtsov, A. V., Klypin, A. A., Primack, J. R., & Dekel, A. 2001, MNRAS, 321, 559
- Burkert (1995) Burkert, A. 1995, ApJ, 447, L25
- Coccato et al. (2004) Coccato, L., Corsini, E. M., Pizzella, A., Morelli, L., Funes, J. G., & Bertola, F. 2004, A&A, 416, 507
- Cole & Lacey (1996) Cole, S., & Lacey, C. 1996, MNRAS, 281, 716
- Colín et al. (2004) Colín, P., Klypin, A., Valenzuela, O., & Gottlöber, S. 2004, ApJ, in press (preprint: astro-ph/0308348)
- Combes & Arnaboldi (1996) Combes, F., & Arnaboldi, M. 1996, A&A, 305, 763
- Courteau (1997) Courteau, S. 1997, AJ, 114, 2402
- de Blok & Bosma (2002) de Blok, W. J. G., & Bosma, A. 2002, A&A, 385, 816
- de Blok, Bosma, & McGaugh (2003) de Blok, W. J. G., Bosma, A., & McGaugh, S. 2003, MNRAS, 340, 657
- de Blok et al. (2001a) de Blok, W. J. G., McGaugh, S. S., Bosma, A., & Rubin, V. C. 2001, ApJ, 552, L23
- de Blok, McGaugh, & Rubin (2001b) de Blok, W. J. G., McGaugh, S. S., & Rubin, V. C. 2001, AJ, 122, 2396
- de Vaucouleurs et al. (1991) de Vaucouleurs, G., de Vaucouleurs, A., Corwin, H. G., Buta, R. J., Paturel, G., & Fouque, P. 1991, Third Reference Catalog of Bright Galaxies (Berlin: Springer-Verlag) (RC3)
- Diemand, Moore, & Stadel (2004) Diemand, J., Moore, B., & Stadel, J. 2004, MNRAS, in press (preprint: astro-ph/0402267)
- Dubinski & Carlberg (1991) Dubinski, J., & Carlberg, R. G. 1991, ApJ, 378, 496
- Dutton et al. (2003) Dutton, A. A., Courteau, S., Carignan, C., & de Jong, R. 2003, submitted to ApJ (preprint: astro-ph/0310001)
- Fich, Dahl, & Treffers (1990) Fich, M., Dahl, G. P., & Treffers, R. R. 1990, AJ, 99, 622
- Fich, Treffers, & Blitz (1982) Fich, M., Treffers, R. R., & Blitz, L. 1982, Astronomy and Space Science Library Vol. 93: Regions of Recent Star Formation, ed. R. S. Roger, & P. E. Dewdney (Dordrecht: Reidel), 201
- Fouqué et al. (1992) Fouqué, P., Gourgoulhon, E., Chamaraux, P., & Paturel, G. 1992, A&AS, 93, 211
- Franx & de Zeeuw (1992) Franx, M., & de Zeeuw, T. 1992, ApJ, 392, L47
- Franx, van Gorkom, & de Zeeuw (1994) Franx, M., van Gorkom, J. H., & de Zeeuw, T. 1994, ApJ, 436, 642
- Freedman et al. (2001) Freedman, W. L., et al. 2001, ApJ, 553, 47
- Garrido et al. (2003) Garrido, O., Marcelin, M., Amram, P., & Boissin, O. 2003, A&A, 399, 51
- Gentile et al. (2004) Gentile, G., Salucci, P., Klein, U., Vergani, D., & Kalberla, P. 2004, MNRAS in press (preprint: astro-ph/0403154)
- Giovanelli et al. (1997) Giovanelli, R., Haynes, M. P., Herter, T., Vogt, N. P., da Costa, L. N., Freudling, W., Salzer, J. J., & Wegner, G. 1997, AJ, 113, 53
- Haynes et al. (1999a) Haynes, M. P., Giovanelli, R., Salzer, J. J., Wegner, G., Freudling, W., da Costa, L. N., Herter, T., & Vogt, N. P. 1999, AJ, 117, 1668
- Haynes et al. (1999b) Haynes, M. P., Giovanelli, R., Chamaraux, P., da Costa, L. N., Freudling, W., Salzer, J. J., & Wegner, G. 1999, AJ, 117, 2039
- Hayashi et al. (2003) Hayashi, E., Navarro, J. F., Taylor, J. E., Stadel, J., & Quinn, T. 2003, ApJ, 584, 541
- Hayashi et al. (2004) Hayashi, E., et al. 2004, submitted to ApJ (preprint: astro-ph/0408132)
- Iodice et al. (2003) Iodice, E., Arnaboldi, M., Bournaud, F., Combes, F., Sparke, L. S., van Driel, W., & Capaccioli, M. 2003, ApJ, 585, 730
- Jing & Suto (2002) Jing, Y. P., & Suto, Y. 2002, ApJ, 574, 538
- Karachentsev & Petit (1990) Karachentsev, I., & Petit, M. 1990, A&AS, 86, 1
- Kazantzidis et al. (2004) Kazantzidis, S., Kravtsov, A. V., Zentner, A. R., Allgood, B., Nagai, D., & Moore, B. 2004, ApJ, 611, L73
- Kazantzidis et al. (2004b) Kazantzidis, S., Mayer, L., Mastropietro, C., Diemand, J., Stadel, J., & Moore, B. 2004, ApJ, 608, 663
- Kent (1986) Kent, S. M. 1986, AJ, 91, 1301
- Kormendy & Kennicutt (2004) Kormendy, J., & Kennicutt, R. C. 2004, ARA&A, in press (preprint: astro-ph/0407343)
- Kuijken & Tremaine (1994) Kuijken, K., & Tremaine, S. 1994, ApJ, 421, 178
- Lupton et al. (2004) Lupton, R., Blanton, M. R., Fekete, G., Hogg, D. W., O’Mullane, W., Szalay, A., & Wherry, N. 2004, PASP, 116, 133
- Ma & Boylan-Kolchin (2004) Ma, C., & Boylan-Kolchin, M. 2004, Phys. Rev. Lett., in press (preprint: astro-ph/0403102)
- Moore (1994) Moore, B. 1994, Nature, 370, 629
- Moore et al. (1999) Moore, B., Quinn, T., Governato, F., Stadel, J., & Lake, G. 1999, MNRAS, 310, 1147
- Navarro, Frenk, & White (1996) Navarro, J. F., Frenk, C. S., & White, S. D. M. 1996, ApJ, 462, 563 (NFW)
- Navarro et al. (2004) Navarro, J. F., et al. 2004, MNRAS, 349, 1039
- Nilson (1973) Nilson, P. 1973, Acta Universitatis Upsaliensis. Nova Acta Regiae Societatis Scientiarum Upsaliensis - Uppsala Astronomiska Observatoriums Annaler (Uppsala: Astronomiska Observatorium)
- Olling & Merrifield (2000) Olling, R. P., & Merrifield, M. R. 2000, MNRAS, 311, 361
- Persic & Salucci (1990) Persic, M., & Salucci, P. 1990, MNRAS, 245, 577
- Pohlen et al. (2002) Pohlen, M., Dettmar, R.-J., Lütticke, R., & Aronica, G. 2002, A&A, 392, 807
- Power et al. (2003) Power, C., Navarro, J. F., Jenkins, A., Frenk, C. S., White, S. D. M., Springel, V., Stadel, J., & Quinn, T. 2003, MNRAS, 338, 14
- Ricotti (2003) Ricotti, M. 2003, MNRAS, 344, 1237
- Romanishin, Strom, & Strom (1982) Romanishin, W., Strom, S. E., & Strom, K. M. 1982, ApJ, 258, 77
- Rubin, Thonnard, & Ford (1980) Rubin, V. C., Thonnard, N., & Ford, W. K. 1980, ApJ, 238, 471
- Sackett et al. (1994) Sackett, P. D., Rix, H., Jarvis, B. J., & Freeman, K. C. 1994, ApJ, 436, 629
- Sackett & Sparke (1990) Sackett, P. D., & Sparke, L. S. 1990, ApJ, 361, 408
- Salucci, Walter, & Borriello (2003) Salucci, P., Walter, F., & Borriello, A. 2003, A&A, 409, 53
- Sakai et al. (2000) Sakai, S., et al. 2000, ApJ, 529, 698
- Schlegel, Finkbeiner, & Davis (1998) Schlegel, D. J., Finkbeiner, D. P., & Davis, M. 1998, ApJ, 500, 525
- Schoenmakers (1998) Schoenmakers, R. H. M. 1998, ASP Conf. Ser. 136: Galactic Halos, 240
- Schoenmakers, Franx, & de Zeeuw (1997) Schoenmakers, R. H. M., Franx, M., & de Zeeuw, P. T. 1997, MNRAS, 292, 349
- Schweizer, Whitmore, & Rubin (1983) Schweizer, F., Whitmore, B. C., & Rubin, V. C. 1983, AJ, 88, 909
- Sharma & Steinmetz (2004) Sharma, S., & Steinmetz, M. 2004 (preprint: astro-ph/0406533)
- Simon et al. (2003) Simon, J. D., Bolatto, A. D., Leroy, A., & Blitz, L. 2003, ApJ, 596, 957
- Sofue (1996) Sofue, Y. 1996, ApJ, 458, 120
- Sofue et al. (1998) Sofue, Y., Tomita, A., Tutui, Y., Honma, M., & Takeda, Y. 1998, PASJ, 50, 427
- Stoehr et al. (2002) Stoehr, F., White, S. D. M., Tormen, G., & Springel, V. 2002, MNRAS, 335, L84
- Stoehr (2004) Stoehr, F. 2004, submitted to MNRAS (preprint: astro-ph/0403077)
- Swaters et al. (2003) Swaters, R. A., Madore, B. F., van den Bosch, F. C., & Balcells, M. 2003, ApJ, 583, 732
- Swaters et al. (2003) Swaters, R. A., Verheijen, M. A. W., Bershady, M. A., & Andersen, D. R. 2003, ApJ, 587, L19
- Taylor & Navarro (2001) Taylor, J. E., & Navarro, J. F. 2001, ApJ, 563, 483
- Teuben (1991) Teuben, P. J. 1991, Warped Disks and Inclined Rings around Galaxies, 40
- Teuben (1995) Teuben, P. J. 1995, in ASP Conf. Ser. 77: Astronomical Data Analysis Software and Systems IV, ed. R. Shaw, H. E. Payne, & J. J. E. Hayes (San Francisco: ASP), 398
- van den Bosch et al. (2000) van den Bosch, F. C., Robertson, B. E., Dalcanton, J. J., & de Blok, W. J. G. 2000, AJ, 119, 1579
- van den Bosch & Swaters (2001) van den Bosch, F. C., & Swaters, R. A. 2001, MNRAS, 325, 1017
- Warren et al. (1992) Warren, M. S., Quinn, P. J., Salmon, J. K., & Zurek, W. H. 1992, ApJ, 399, 405
- Weinberg & Katz (2002) Weinberg, M. D., & Katz, N. 2002, ApJ, 580, 627
- Welch et al. (1996) Welch, W. J., et al. 1996, PASP, 108, 93
- Weldrake, de Blok, & Walter (2003) Weldrake, D. T. W., de Blok, W. J. G., & Walter, F. 2003, MNRAS, 340, 12
- Whitmore, McElroy, & Schweizer (1987) Whitmore, B. C., McElroy, D. B., & Schweizer, F. 1987, ApJ, 314, 439
- Wong, Blitz, & Bosma (2004) Wong, T., Blitz, L., & Bosma, A. 2004, ApJ, 605, 183