11email: overzier@strw.leidenuniv.nl 22institutetext: Smithsonian Astronomical Observatory, Harvard-Smithsonian Center for Astrophysics, 60 Garden Street, Cambridge, MA 02138, USA
33institutetext: National Radio Astronomy Observatory, New Mexico Array Operations Center (VLA, VLBA), P.O. Box O, 1003 Lopezville Road, Socorro, NM 87801, USA
44institutetext: Dipartimento di Fisica, Università degli Studi Roma Tre, Rome, Italy
On the X-ray emission of radio galaxies: IC scattering of the CMB & no evidence for fully-formed potential wells
We present the results of 20 ksec Chandra observations for each of 5 radio galaxies in the redshift range . The goals were to (i) study the nature of their non-thermal X-ray emission, (ii) investigate the presence and amount of hot gas, and (iii) look for active galactic nuclei (AGN) overdensities in fields around high redshift radio galaxies. For 4 of the 5 targets we detect unresolved X-ray components coincident with the radio nuclei. From spectral analysis of one of the cores and comparison to the empirical radio to X-ray luminosity ratio () correlation for AGN, we find that the cores are underluminous in the X-rays indicating that obscuring material ( cm-2) may be surrounding the nuclei.
We detect X-ray emission coincident with the radio hotspots or lobes in 4 of the 5 targets. This extended emission can be explained by the Inverse-Compton (IC) scattering of photons that make up the cosmic microwave background (CMB). The magnetic field strengths of that we derive agree with the equipartition magnetic field strengths. The relative ease with which the lobe X-ray emission is detected is a consequence of the increase in the energy density of the CMB. For one of the lobes, the X-ray emission could also be produced by a reservoir of hot, shocked gas. An HST image of the region around this radio component shows bright optical emission reminiscent of a bow-shock.
By co-adding the 5 fields we created a deep, 100 ksec exposure to search for diffuse X-ray emission from thermal intra-cluster gas. We detect no diffuse emission and derive upper limits of erg s-1, thereby ruling out a virialized structure of cluster-size scale at .
The average number of soft X-ray sources in the field surrounding the radio sources is consistent with the number density of AGN in the Chandra Deep Fields, with only one of the fields showing a marginally statistically significant factor 2 excess of sources with erg s-1 cm-2. Analysis of the angular distribution of the field sources shows no evidence for large-scale structure associated with the radio galaxies, as was observed in the case of PKS 1138–262 by Pentericci et al. (2002).
Key Words.:
galaxies: high-redshift – galaxies: active – X-rays: galaxies: clusters – X-rays: general1 Introduction
Radio galaxies can be used to trace the formation and evolution of the most massive galaxies known at high redshift. They usually have continuum morphologies suggestive of the merging of systems (e.g. Pentericci et al. 1999, 2001), and are surrounded by large reservoirs of line emitting gas (e.g. van Ojik et al. 1997) that are comparable in size to cD galaxy envelopes. High redshift radio galaxy (HzRG) fields targeted by broad and narrow band imaging and spectroscopy have been found to locate ’protoclusters’. They have large excesses of Ly and/or H emitters, Lyman break galaxies and extremely red objects (e.g. Pentericci et al. 2000a; Kurk et al. 2000; Kurk 2003; Venemans et al. 2002; Miley et al. 2004). Thus, HzRGs act as beacons to the progenitors of present-day galaxy clusters (see also e.g. Windhorst et al. 1998; Ivison et al. 2000; Brand et al. 2003; Smail et al. 2003; Stevens et al. 2003). Finding these distant (i.e. ) protoclusters is important for constraining models of structure formation and cosmology.
Radio continuum polarimetric observations of HzRGs have revealed large rotation measures (RM) and large RM gradients. At the typical RM observed is several hundreds rad m-2, but extreme values of rad m-2 are not uncommon (Carilli et al. 1997; Athreya et al. 1998; Pentericci et al. 2000b). It is believed that RM arises from ’Faraday screens’ in our galaxy (i.e. the interstellar medium, ISM), in intervening galaxies and clusters, or near the source itself. At low redshifts, most radio galaxies have relatively small RM values that can be attributed to the local ISM (Simard-Normandin & Kronberg 1980; Leahy 1987, and references therein). However, RM values observed towards HzRGs are significantly larger, and are believed to be due to Faraday screening of extra-galactic origin somewhere along the line of sight. Athreya et al. (1998) show that the chance superpositions of distant radio sources and intervening systems such as foreground Abell clusters and damped Ly absorbers are too small to explain the fraction of high RMs observed. Likewise, the expected RMs from such intervening systems are too small to account for the high values seen towards distant radio sources. Hence, the large RM values may occur in a medium close to the source, although it is unclear whether they are caused by extended cluster-sized media or smaller gas distributions on scales comparable to the radio sources (e.g. Carilli et al. 2002). Some radio galaxies at low redshift have extremely large values of RM that are caused by Faraday rotation in so-called ’cooling flow’ cluster atmospheres (e.g. 3C 295; Perley & Taylor 1991, see Carilli & Taylor (2002) for a review on cluster magnetic fields). There is evidence that the strength of cooling flows is correlated with RM, indicating that RM is an indicator of the fields in the intracluster medium rather than the radio cocoon (Taylor et al. 1994; Eilek & Owen 2002; Ensslin et al. 2003, but see Rudnick & Blundell (2003)).
X-ray observations are also a powerful tool to find deep, gravitational potential wells in the early Universe. Diffuse X-ray emission caused by thermal bremsstrahlung from a hot ICM, is evidence for a bound system in which the gas is in dynamical equilibrium with the galaxies and the cold dark matter. Deep X-ray surveys have uncovered significant numbers of rich galaxy clusters out to (e.g. Rosati et al. 1999; Stanford et al. 2001; Rosati et al. 2004). Remarkably, the diffuse ICM in these distant objects traces the galaxy distribution, and their surface brightness and temperature profiles are similar to those of lower redshift clusters, indicating that clusters formed very early in the history of the Universe. The study of thermal emission from HzRGs is important because of their suggested linkage to cluster formation. However, if an ICM is present in such structures at , the extreme cosmological surface brightness dimming makes their detection very difficult.
So far only a handful of distant radio sources has been studied with Chandra. Fabian et al. (2003) performed a very deep (200 ks) study of the radio galaxy 3C 294 at . They observed a 100 kpc region of diffuse emission bounded by sharp edges. Although some thermal component from the ICM could not be ruled out, most of the emission was ascribed to Inverse Compton (IC) scattering of the cosmic microwave background (CMB) by an older population of electrons tracing out an hourglass-shaped region around the radio source. Belsole et al. (2004) found weak cluster luminosities and IC scattering among a sample of three bright HzRGs. Carilli et al. (2002) found diffuse X-ray emission around the radio galaxy PKS 1138–262 at , which is believed to be the forming, massive galaxy at the center of a protocluster (Pentericci et al. 2000a; Kurk et al. 2000; Kurk 2003). However, the extended emission is seen only along the radio axis, and is therefore believed to be associated with shocked material inside the radio source. The upper limit that Carilli et al. (2002) derive for the X-ray luminosity of the ICM (% of the luminosity of the Cygnus A cluster, see e.g. Smith et al. (2002)) is not unexpectedly low because there has not been enough time since the big bang for these structures at to form a sufficiently deep potential well. Scharf et al. (2003) detected extended X-ray emission around 4C 41.17 at roughly following the radio morphology. They conclude that the X-ray emission arises from ’Inverse-Compton scattering of far-infrared photons from a relativistic electron population probably associated with past and current activity from the central object’, in addition to a lesser contribution from the up-scattering of CMB photons.
| Source | R.A. (J2000) | Decl. (J2000) | Dates of observation | Exposure time (s) | ( cm-2) | |
|---|---|---|---|---|---|---|
| 0156–252 | 01h58m33.5s | 5932.26 | 2.09 | 2002-11-09 | 11477 | 1.34 |
| 2002-12-20 | 8401 | |||||
| 0406–244 | 04h08m51.5s | 1816.8 | 2.44 | 2002-12-07 | 20179 | 3.30 |
| 0828+193 | 08h30m53.4s | 1315.7 | 2.57 | 2002-11-05 | 19212 | 3.72 |
| 2036–254 | 20h39m24.5s | 1430.4 | 2.00 | 2002-09-01 | 19660 | 4.92 |
| 2048–272 | 20h51m03.6s | 0302.1 | 2.06 | 2002-11-11 | 19555 | 6.29 |
It is clear that the nature of the X-ray emission mechanisms operating in radio galaxies is diverse. Better sample statistics are required to enlarge our current understanding of e.g. the dominant X-ray emission mechanisms, the role of magnetic fields on galaxy and cluster-size scales, the origin of the hot gas observed in X-ray luminous clusters, and large-scale structure associated with HzRGs. Here we present observations with the Chandra X-ray observatory of five additional radio galaxies at . The sources were selected from a compendium of HzRGs, focusing on the lower end of the redshift distribution in order to minimize surface brightness dimming effects, while still being at high enough redshift to allow for cosmological evolution effects in source properties. Sources were further selected on the presence of one or more of the various characteristics: distorted radio morphology, large rotation measure ( rad m-2), evidence for interaction between Ly and radio structure, and extended Ly absorption features.
Throughout this paper we assume km s-1, , and . The resulting scale factors range from 8.0 to 8.4 kpc arcsec-1 from to . We will use power-law spectra defined as , where is the spectral index.
2 Observations
2.1 Observations and data reduction
Each of the 5 sources was observed for 20 ks with the back-illuminated ACIS-S3 chip on Chandra, using the standard 3.2 s readout timed exposure mode and the faint telemetry format. Sources were positioned at approximately 20″ away from the aimpoint. The data were processed and analysed in June 2003 using the Chandra data analysis package CIAO 2.3111http://cxc.harvard.edu/ciao/ together with CALDB 2.22. We applied the ’ACISABS’ script that corrects the Chandra auxiliary response files for a continuous degredation in the ACIS quantum efficiency. We did not apply the ’tgain’ correction that has become standard practice only in the most recent release of CIAO to correct for the drift in the effective detector gain due to an increase in the charge transfer inefficiency over time. However, for ACIS–S3 the resulting effect on the measured photon energies was of the order of only % near the end of 2002 when the data were taken.
A log of the observations is given in Table 1. 0156–252 was observed on 2 separate dates, because the initial observation was interrupted after 11.5 ks by a high radiation shutdown of the system due to an excess of solar wind particles. To ease the analysis of these observations, the two exposures were merged into a single event file by ’reprojecting’ the events. A lightcurve analysis of the other sources indicates no further periods of significant fluctuations in the count rates of source and large, source-free background regions.
Radio images at 5 and 8 GHz where obtained by Carilli et al. (1997) and Pentericci et al. (2000a) using the VLA in A configuration. The noise is 50 Jy/beam at 5 Ghz and 25 Jy/beam at 8 GHz. The resolution of the observations is 0.43″ for the 5 GHz maps and 0.23″ for the 8 GHz maps. Analysis of the radio data was performed using the Astronomical Image Processing System (AIPS) and the Multichannel Image Reconstruction, Image Analysis and Display (MIRIAD) software.
We will also make use of observations obtained with the Wide-Field Planetary Camera 2 (WFPC2) on HST. 0156–252 and 2048–272 were observed as part of Program 8183 (PI: Miley), and an image of 0406–244 was retrieved from the HST archive (program 8338, PI: Lehnert). 0156–252 was observed for 4800 s and 2048–272 for 7200 s, both through filter . This filter has a central wavelength of 5443 Å. 0406–244 was observed for 2000 s through filter which has a central wavelength of 6718 Å. Measurements from these images were made using the conversion from counts to flux density as given in the PHOTFLAM header keyword of each image. To get to the flux density (erg s-1 cm-2 Hz-1) we calculate (see Pentericci et al. 1999, for a description of procedures).
2.2 Image registration
To recover the inherent resolution of the Chandra mirror/detector system, we removed the pixel randomization added in the pipeline processing and regridded our maps to 1/10 native ACIS pixel size. After applying a suitable smoothing function, we were able to find the position of the X-ray core to an accuracy of better than 0.1″ provided the core had sufficient signal to noise (S/N). We then shifted the images to align the X-ray core with the radio core. The typical shift needed was one half of an original Chandra pixel in right ascension and/or declination, consistent with the known astrometric accuracy. In the case of 2048–272 no shift was applied, because the nucleus was not detected in either the radio or the X-rays.
2.3 Analysis
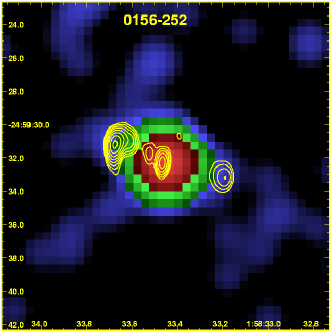
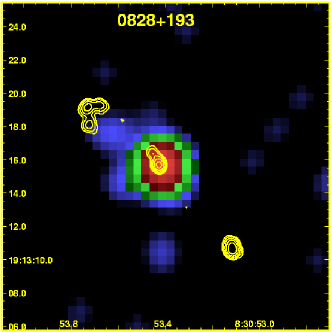
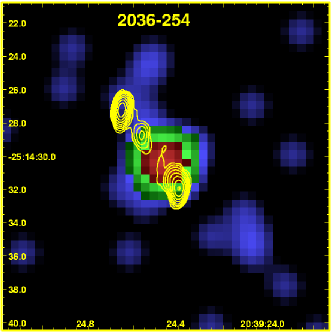
The Chandra images are shown in Fig. 1, where yellow contours indicate the 4.7 GHz radio maps from Carilli et al. (1997) and Pentericci et al. (2000b). We measured the X-ray counts from the distinct radio components (e.g. cores and lobes) using boxed or circular extraction regions. The counts are background-subtracted by using a large, point source free, annular region centered on the radio source. We restrict our measurements to counts in the energy range of 0.2–6 keV for which the contribution of the background is minimal. We calculate the total net (i.e. background subtracted) counts , where and are the counts in the source region and the background region , respectively. We consider a radio component detected in the X-rays when is greater than its formal error, , where and from Gehrels (1986). For undetected components we calculate upper limits in the 0.2–6 keV band using the above expression for . The upper limit on flux is estimated by assuming a power-law spectrum with a spectral index of 0.8 using the online tool PIMMS222http://heasarc.gsfc.nasa.gov/Tools/w3pimms.html.
The procedure to convert counts into fluxes is as follows: we create exposure maps for the soft (0.5–2 keV) and hard (2–6 keV) band at nominal energies, and divide the images in each band by the corresponding exposure map to obtain fluxed images. When extracting the flux for a given region, we calculate weight factors defined by the ratio of the average energy of counts in that region to the nominal energy of each exposure map. The total flux in a region is then calculated by summing the weighted fluxes in the two bands. We remark that our method is slightly different compared to the usual procedure of calculating fluxes from exposure maps using a conversion factor that is based on the spectral response within the given band as well as an assumed spectral energy distribution. Our method is preferred because it allows us to measure fluxes, without having to assume a specific spectral shape.
The measurements are given in Table 3. Where indicated, fluxes are corrected for galactic absorption using PIMMS, assuming a power-law spectrum with a spectral index of 0.8 and taking the HI column density in the direction of each source from Dickey & Lockman (1990) indicated in Table 1. All energy ranges are in the observed frame, unless stated otherwise.
3 Results
3.1 Source description
| Source | RMint (rad m-2) | Ref. | |
| N. lobe | S. lobe | ||
| 0156–252 | – | 1 | |
| 0406–244 | 1 | ||
| 0828+193 | – | – | 2 |
| 2036–254 | 1 | ||
| 2048–272 | – | 3 | |
| 1 Athreya et al. (1998) | |||
| 2 Carilli et al. (1997) | |||
| 3 Pentericci et al. (2000) | |||
We will briefly summarize some of the main characteristics of each source. Details on radio observations, ground-based imaging and spectroscopy, and Hubble Space Telescope (HST) observations can be found in McCarthy et al. (1996), Carilli et al. (1997), Pentericci et al. (1999), Pentericci et al. (2001), Iwamuro et al. (2003) and references therein. Table 2 summarizes the intrinsic rotation measures, RM.
0156–252 at has several characteristics reminiscent
of the well-studied radio galaxy PKS 1138–262 (Carilli et al. 2002; Pentericci et al. 2000a). Near-infrared continuum shows a host galaxy extended over parallel to the radio axis, and narrow-band Ly shows emission line gas
extended over the entire region encompassed by the northern and southern radio hot spots.
The Ly brightness is at a minimum at the
position of the host galaxy and peaks at the location where there is a sharp bend in the (northern) radio jet,
probably due to shock-induced ionization of the gas where the radio jet is deflected by denser material. The northern hot spot has an intrinsic RM of rad m-2.
0406–244 at consists of two main optical/infrared continuum features
aligned with the radio axis (see Rush et al. (1997) for a detailed study).
The continuum components lie embedded in a large Ly halo with a spatial extent of along the radio
axis. Both radio lobes have an intrinsic RM of rad m-2 with opposite signs.
0828+193 at is the largest radio source in our sample ( kpc). It has a jet-like
feature north of the radio core.
The northern lobe contains several hot spots with a peculiar 90 degree bend. The southern radio hotspot is unresolved.
Pentericci et al. (1999) have identified the
radio core with the brightest optical component of several clumps in a region seen by HST.
No RM is given for this source in Table 2, since the fractional polarization at 8.2 GHz for both lobes
was below the sensitivity limit of the observations (Carilli et al. 1997).
2036–254 at is the only source in our sample for which no optical/near-infrared data are available.
The radio core is most likely the faint, compact component close to the southern lobe.
There is a pair of hot spots parallel to the radio axis in the north.
The southern lobe has a RMint of rad m-2.
2048–272 at is among
the % of sources in the sample of Carilli et al. (1997) for which the core is undetected. However, a bright near-infrared object seen in between the lobes is presumed to be the galaxy hosting the radio source.
The northern hot spot has a RMint of rad m-2.


| Source | Countsa | Softb | Hardb | log() | |||
| () | (0.2–6 keV) | (0.5–2 keV) | (2–6 keV) | erg s-1 cm-2 | erg s-1 cm-2 | erg s-1 | |
| 0156–252 | |||||||
| Total | 4.2 | 45.42 | |||||
| Core | 1.1 | 45.37 | |||||
| NE | 1.6 | 43.56 | |||||
| SW | 1.2 | ||||||
| 0406–244 | |||||||
| Total | 4.8 | 44.19 | |||||
| Core | 0.9 | 44.11 | |||||
| SE | 1.8 | 43.88 | |||||
| NW | 2.0 | …d | … | ||||
| 0828+193 | |||||||
| Total | 7.0 | 44.91 | |||||
| Core | 1.0 | 44.78 | |||||
| NE | 1.4 | …d | … | ||||
| SW | 1.0 | …d | … | ||||
| 2036–254 | |||||||
| Total | 4.1 | 44.65 | |||||
| Core | 0.6 | 44.51 | |||||
| NE | 1.3 | …d | … | ||||
| SW | 1.4 | … | 43.47 | ||||
| 2048–272 | |||||||
| Total | 4.3 | 44.05 | |||||
| Core | 0.8 | …d | … | ||||
| NE | 1.7 | 43.73 | |||||
| SW | 1.5 | …d | … | ||||
a Errors are calculated using Gehrels (1986) in the low-count regime.
b Errors are .
c Observed fluxes (i.e. not corrected for galactic absorption).
d Undetected. We give a upper limit for the total flux at 0.2–6 keV.
e Circular extraction radius.
3.2 X-ray Cores
We have detected X-ray cores in 4 of the 5 targets. No core was detected in the case of 2048–272, and we note that the core was also not detected in the radio maps indicating that nuclear activity may have ceased. The core X-ray luminosities are in the range erg s-1. 0156–252 has the luminosity of the other cores. We place an upper limit on the core luminosity of 2048–272 of erg s-1. Hardcastle & Worrall (1999) and Brinkmann et al. (2000) presented a correlation between the X-ray and radio luminosity of radio-loud quasars from the cross-correlation of ROSAT and radio sources. It has been suggested that this correlation implies a physical relationship between X-ray and radio cores, which can be explained by models in which e.g. the X-ray emission originates from the base of the jet (Hardcastle & Worrall 1999). In Fig. 2 we show objects from the Brinkmann et al. (2000) sample classified as narrow-line AGN, as well as the best-fit correlation for their subsample of radio-loud quasars, loglog. We have also indicated several other radio galaxies (1138–262 at , B0902+343 at , 4C41.17 at ) and the local source Cygnus A for comparison (see Carilli et al. 2002; Scharf et al. 2003; Fabian et al. 2002, and references therein).
As shown in Fig. 2, three out of four sources in our sample agree with the relation if we use the observed 2–6 keV (rest-frame 6–18 keV) flux with a power-law spectrum () to calculate the luminosity at rest-frame 2 keV (observed 0.7 keV). This result is virtually independent of the amount of intrinsic absorption, since it is of negligible effect at rest-frame 6–18 keV. Calculating the 2 keV luminosity from the 0.5–2 keV observed flux (rest-frame 1.5–6 keV) yields values that are significantly lower, but for 0156–252, 0828+193 and 2036–254 this can be explained by an intrinsic absorption column density of cm-2. Interestingly, the core of 0406–244 seems highly underluminous in Fig. 2, a discrepancy that cannot be explained away by invoking a large amount of absorption. However, this may be a S/N issue: we have detected only 2 photons in the hard 2–6 keV band, compared to 62, 10 and 15 for the other 3 sources. If we instead calculate the 2 keV luminosity from the 0.5–2 keV observed flux (8 photons detected) with cm-2 we find log( compared to for the earlier method, and note that its deviation from the relation is now comparable to that of 4C41.17.

0156–252 is the only source in our sample for which the core is detected with sufficient S/N to carry out a (crude) spectral analysis. The X-ray spectrum is shown in Fig. 3. Assuming a power-law spectrum with absorption at the redshift of the source, we find and cm-2. The fit has a reduced of 0.34, and is indicated in Fig. 3. The error bars for the fit parameters correspond to a change of 1 in the reduced . Repeating the fit using using the Cash statistic valid for the low counts regime we find cm-2 with unchanged. The galactic HI column density towards this source is cm-2 (see Table 1). For completeness, we note that the spectrum can be fitted by a Mewe-Kaastra-Liedahl (Mekal) thermal plasma model with keV (reduced of 0.50).
The signal-to-noise of the 3 other cores is insufficient to make spectra. However, if we assume that they are a generic class we might estimate the amount of intrinsic absorption by stacking the data. The hardness ratio (where and are the number counts observed in the hard and soft bands) is , consistent with a Type II AGN at with an obscured ( cm-2) power-law spectrum with a photon index of (Tozzi et al. 2001).

3.3 X-ray emission from lobes/hotspots
We obtained positive detections of X-ray components coincident with the northeastern (NE) and southwestern (SW) radio lobes of 0156–252, the southestern (SE) lobe of 0406–244, the SW lobe of 2036–254, and the NE lobe of 2048–272. Below we will evaluate the likely mechanisms for these detections. Given the generally low signal to noise of all features we detected, we will focus on the X-ray emission that is identified with the radio lobes333Our radio data are inadequate to confidently identify radio features as lobes or hotspots. We adopt the term lobes to mean any radio emission not associated with the core..
Synchrotron radiation
In Fig. 4 we plot spectra for the lobes that have a detection in the X-ray. The spectra were constructed by (i) extrapolating the radio flux densities to X-ray frequencies using the radio spectral index
, and (ii) using the 4.7 GHz to X-ray spectral index, . The results of our analysis are indicated in Table 4. In the first method (indicated by dotted lines in Fig. 4), we can directly compare the observed X-ray flux density to
the predicted synchrotron flux density based on the radio spectrum. Except for the NE lobe of 0156–252, the predicted flux densities
are several orders of magnitude lower than that observed. This seems to rule out a synchrotron origin for the X-ray emission from these lobes. However, is a strong function of the spectral index, since we are extrapolating over decades of frequency. Only a small offset in
can lead to a significant under- or overprediction of the X-ray flux density. The radio spectral indices used
were measured over a relatively narrow frequency range, and may be subject to errors. We estimate that the
typical error in is , based on the comparison with a spectral index determined by combining our data with data (not shown here) from the publicly available NRAO VLA Sky Survey
(NVSS)444http://www.cv.nrao.edu/nvss/, albeit at much lower resolution. Therefore, we attempt the second method (indicated by solid lines in Fig. 4). We slightly modify the above procedure and now estimate the radio flux density expected at 8.2 GHz,
assuming a priori that the spectrum is synchrotron with a radio to X-ray spectral index .
The ratio of predicted to observed 8.2 GHz flux densities is 1.0 for the NE lobe of 0156–252 and ranges from
1.2 to 1.5 for the other lobes. This indicates that the observed X-ray flux densities are consistent with synchrotron radiation,
provided that the error in the integrated flux densities at 8.2 GHz are %. Typically, errors in the integrated radio flux
densities are of the order of %. Furthermore, the extrapolation from the radio to the X-ray using the radio spectral index under-predicted the observed X-ray emission in all cases. If there were to be a large, random error in the integrated radio flux densities, we
might have expected to see some of the spectra over-predict the X-ray flux as well. The fact that this is not observed may indicate that the typical error in the radio flux densities is indeed only a few percent.

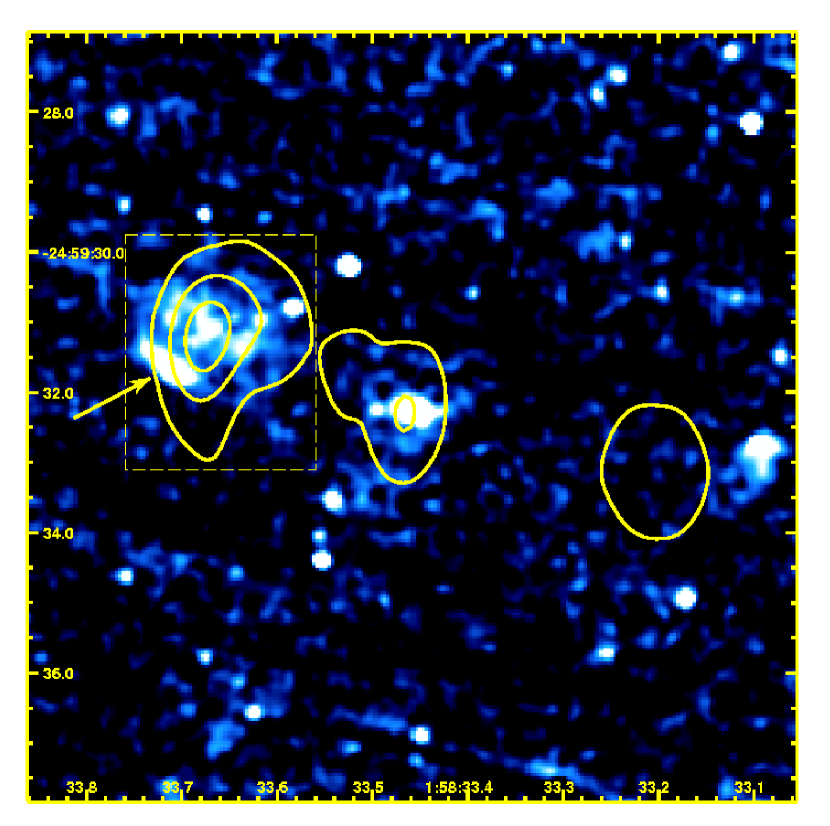
To further test our synchrotron models, we have extracted flux densities in the optical (Å) using the HST/WFPC2 observations of 0156–252, 0406–244, and 2048–272 (see Sect. 2). In Fig. 4 we have indicated upper limits on the optical emission of the SW lobe of 0156–252, the SE lobe of 0406–244 and the NE lobe of 2048–272. Although the flux densities in the optical are consistent with the synchrotron models, they are unfortunately not deep enough to rule them out.
Interestingly, the optical flux density of the NE lobe of 0156–252 is about 1 order of magnitude higher than predicted. We suspect that the optical emission in this lobe is most likely not continuum emission, but line emission. The NE lobe coincides with the peak of the Ly intensity, and several strong emission lines common to HzRG spectra fall within the filter. Moreover, the HST/WFPC2 image (Fig. 5) shows a bright component roughly following the morphology of the radio lobe, reminiscent of a shell of shocked gas. We will treat this feature in a separate discussion below.
| Component | b | e | ||||||
|---|---|---|---|---|---|---|---|---|
| (mJy) | (mJy) | (Jy) | (Jy) | (mJy) | (Jy) | |||
| 0156–252 NE | 89 | 47 | 1.15 | 1.13 | 48 | |||
| SW | 7 | 3.5 | 1.25 | 0.96 | 4.1 | |||
| 0406–244 SE | 31 | 11 | 1.86 | 1.05 | 17 | |||
| NW | 72 | 32 | 1.46 | |||||
| 0828+193 NE | 7 | 2.0 | 2.25 | |||||
| SW | 9 | 3.6 | 1.65 | |||||
| 2036–254 NE | 51 | 29 | 1.01 | |||||
| SW | 37 | 15 | 1.62 | 1.08 | 20 | |||
| 2048–272 NE | 83 | 34 | 1.60 | 1.10 | 45 | |||
| SW | 6 | 1.1 | 3.05 (2.2 used) |
a Integrated radio flux density at 4.7 and 8.2 GHz. The typical error is assumed to be .
b Radio spectral index. The typical error is assumed to be .
c Predicted flux density at 2 keV for a radio synchrotron model.
d Observed flux density at 2 keV.
e X-ray to (4.7 GHz) radio spectral index.
f Predicted flux density at 8.2 GHz.
g Predicted flux density at 5000Å.
| Component | areaa | |||||||
|---|---|---|---|---|---|---|---|---|
| 0156–252 NE | , | 2.8 | 0.7 | 0.04 | 4.4 | 0.4 | 129 | 104 |
| SW | , | 0.3 | 0.1 | 0.02 | 0.2 | 0.01 | 67 | 30 |
| 0406–244 SE | , | 5.6 | 0.9 | 0.05 | 2.7 | 0.2 | 169 | 179 |
| NW | , | 6.0 | 1.0 | 0.05 | 5.1 | 170 | ||
| 0828+193 NE | , | 7.9 | 1.2 | 0.04 | 0.7 | 213 | ||
| SW | , | 3.3 | 0.5 | 0.03 | 0.4 | 162 | ||
| 2036–254 NE | 2.9 | 0.9 | 0.04 | 2.1 | 139 | |||
| SW | , | 2.7 | 0.8 | 0.04 | 2.0 | 0.2 | 135 | 135 |
| 2048–272 NE | , | 3.4 | 0.9 | 0.04 | 6.7 | 0.4 | 126 | 154 |
| SW | , | 0.3 | 0.1 | 0.02 | 0.3 | 61 |
a Cylinder of length and radius ( along the line of sight), or a sphere of radius .
b Synchrotron energy density, , in units of erg cm-3.
c Ratio of the synchrotron to cosmic microwave background energy densities.
d Ratio of the synchrotron to equipartition magnetic field energy densities, .
e Predicted synchrotron self-Compton (SSC) flux in the 0.5–6 keV band in units of erg s-1 cm-2.
f Ratio of predicted SSC flux to observed X-ray flux.
g Equipartition magnetic field strength in .
h IC/CMB magnetic field strength in .
Synchrotron self-Compton (SSC) emission
SSC emission arises due to Inverse-Compton scattering of local
synchrotron photons. This process
dominates over other IC mechanisms when the local synchrotron photon energy density is higher than
that of the external (e.g. CMB) photon field, and has been found to explain the Chandra hot spots
of radio sources such as 3C 295 (Harris et al. 2000) and Cygnus A (Wilson et al. 2000).
We calculate the energy density of the
local synchrotron photon field, , by integrating the radio flux density over 1 decade of frequency (1–10 GHz) and assuming
a cylindrical geometry for the radio lobes. The results are listed in Table 5.
A detailed calculation of SSC (see e.g. Band & Grindlay (1985) for the theoretical framework) would require knowledge of the full radio spectrum and the geometry of lobes and hot spots. However, we can roughly estimate the SSC flux density in the X-ray from the ratio of the energy losses in the IC and synchrotron channels R=, where is the energy density of the magnetic field , and and are the IC and synchrotron luminosities (see Harris et al. 2000; Donahue et al. 2003). We calculate from the magnetic field strength that will make the energy densities of fields and particles approximately equal. We use the formula given by Miley (1980):
where is in Gauss, is the ratio of energy in heavy particles to that in electrons, the filling factor, (arcsec2) the area taken up by the radio lobe (assumed to be a cylinder viewed broadside), the pathlength through the lobe (kpc), and and (GHz) are the lower and upper cut-off frequencies of the synchrotron spectrum. We take , and filling factor unity so as to obtain a real minimum, and note that the results are only weakly dependent on these parameters given the 2/7 power. , and are given in Table 5, where G. In all cases, the ratio of predicted X-ray SSC flux to observed X-ray flux is less than 0.4.
Inverse-Compton (IC) scattering of the CMB
Another possibility is the up-scattering of CMB photons by relativistic electrons in the radio source. This effect is
expected to become significantly more dominant at higher redshifts due to the increase in the energy density
of the CMB ( erg cm-3 at ).
The scattering electrons are assumed to belong to the same power law distribution of electrons which is responsible for the radio synchrotron emission. Therefore, the X-ray flux may be used to constrain the magnetic field strength: since the energy density of the CMB is fixed at any given , less observed X-ray flux implies fewer electrons, so the magnetic field producing the observed radio synchrotron emission must be stronger. Using the formalism of Harris & Grindlay (1979) we calculate the magnetic field strength, :
where is in Gauss, is the radio spectral index, and are the radio and X-ray flux densities (erg s-1 cm-2 Hz-1) at and (both in Hz), respectively. , which is well approximated by the value , and , which is a function that is slowly varying with , can be found in Harris & Grindlay (1979). From the radio and X-ray flux densities listed in Table 4 we derive field strengths of G for the components that are detected in the X-ray. The results are listed in Table 5, where we also give lower limits on for the undetected lobes.
We can compare to , which is an estimate of the magnetic field that is solely based on the observed radio synchrotron flux (see expression above). The field strengths are typically G, remarkably close to the field strengths derived for the IC/CMB mechanism. The general agreement that we find between the magnetic field strengths using the two independent field estimators is consistent with the X-ray flux being produced by the IC/CMB process.
The (observed) 1–10 GHZ synchrotron flux in HzRGs is produced by relativistic electrons that have for ( Hz, see Bagchi et al. 1998). The number density of relativistic electrons with energies between and can be expressed as a power-law, with . The up-scattering of CMB photons to X-ray frequencies is provided by electrons with a Lorentz factor , since , and the frequency for which the energy density of the CMB peaks is Hz. Electrons having such Lorentz factors are highly abundant, given the extrapolation of to . Note that in the SSC process described above, the X-ray emission must be produced by the up-scattering of synchrotron photons off a population of relativistic electrons having . Since decreases strongly with increasing and for all our sources, will be several orders of magnitude lower than . Together with the fact that , is around unity (see Table 5) this implies that the IC/CMB process will be a far more efficient process for producing X-rays at these redshifts. While the contribution of SSC to the observed X-ray flux might still be in the range of % as detailed above, the SSC output is expected to peak around Hz, or in the UV part of the spectrum.
Other mechanisms
The ambient medium in which a radio source expands is expected to be very different for HzRGs compared to radio sources at
low redshift. Low redshift sources often lie in a smooth, virialised ( K) atmosphere. For HzRGs such a smooth
medium does probably not exist because the necessary potential well has not yet formed. Instead they lie in a multiphase medium,
consisting of cold ( K),
high density clouds embedded in low density regions approaching virial temperatures (). The passage of a radio jet through the multiphase can lead to interesting phenomena, such as jet-induced star formation in the high density clouds and shock heating
of lower density regions. When intermediate density regions are shocked they may cool off, emitting strong emission lines such as Ly. The lower density gas with high filling factor will be shock heated to temperatures where the gas starts producing X-rays. Can the X-ray emission coincident with the NE lobe of 0156–252 be produced by shocks in this thermal gas?
Interestingly, the NE radio lobe of 0156–252 coincides with the peak of the Ly emission, and the HST/WFPC2 image
(see Fig. 5) shows evidence for a shell of shocked (emission-line) gas that follows the bend of
the radio lobe.
For 1138–262, Carilli et al. (2002) propose that much of the extended X-ray emission comes from ambient gas that is shock heated by the expanding radio source. For this gas they estimate a density of 0.05 cm-3 and a pressure of 10-9 dyn cm-2. This pressure is comparable to the optical line emitting gas and to minimum pressures in the radio source, with a total
gas mass of about M⊙. Carilli et al. hypothesize that the high filling factor X-ray emitting gas may confine both the radio source and the line emitting clouds. The extended X-ray luminosity associated with the NE lobe of 0156–252 is a factor 5 or so less than in 1138–262, implying a factor 5 lower total gas mass (for a fixed density) if the X-rays represent shocked gas.

So far, the discussion has been limited to the X-ray emission directly coincident with the radio lobes and hotspots. Brunetti (2000) describes a mechanism in which IC scattering of (mostly infrared) AGN photons by relativistic electrons can also produce X-ray bright emission. Such a mechanism, if it exists, may contribute significantly to the radio/X-ray alignment effect. Under the Brunetti mechanism the X-ray luminosity is expected to decrease with increasing distance from the source (i.e. the hidden quasar) producing the photons. This will result in opposite gradients in the X-ray and radio luminosities, and entails (in our case) the presence of an inner, undetected part of the radio lobe. Brunetti (2000) predicts that the receding radio lobe will produce brighter X-ray emission than the approaching lobe, because time delay makes it closer to the nucleus and because backward scattering is more effective than forward scattering. In 0406–244 (and possibly in one or several of the other sources as well) there is X-ray emission in between the core and the SE lobe. The nature of this emission could be similar to the aligned emission seen in several other high-redshift quasars and radio galaxies (e.g. Yuan et al. 2003; Fabian et al. 2003; Scharf et al. 2003) for which the Brunetti model is among the possible scenarios. However, the proposed mechanism relies on a (suggested) supply of electrons with . Given the highly speculative amplitudes at these low energies, we will not pursue this mechanism quantitatively.
3.4 Thermal emission from hot (cluster) gas
An important driver for observing powerful HzRGs in the X-ray is to search for traces of thermal emission from an ICM. To test whether our data show any evidence for the presence of extended, diffuse X-ray emission we will attempt two methods:
Smoothed fields
To obtain upper limits on the luminosity of extended regions in each field, we place 10 circles of 12″ diameter (corresponding to kpc at ) around each radio source in regions without visible point sources. We calculate the average background count in these regions and the deviation from the mean. We use the resulting countrates to calculate upper limits on the X-ray flux of typical 100 kpc-sized areas. We assumed a Raymond-Smith thermal spectrum with keV, and used the galactic for each source to produce the unabsorbed flux at 0.2–6 keV. We derive an upper limit on the flux of (4–9) erg cm-2 s-1, corresponding to luminosities of (1.5–4) erg s-1 (for a uniform sphere).
A deviation from the background countrate over a 12″ region would easily stand out from the X-ray maps after smoothing with a large kernel. Therefore, we create smoothed images of diffuse emission. First, we remove counts that are associated with the radio galaxy by replacing all counts in a circular region encompassing the entire radio structure by the background using the task DMFILTH that maintains the Poissonian nature of the background. The background was estimated from a large annular region around the radio source. We then run the WAVDETECT algorithm (Freeman et al. 2002) within CIAO to identify the remaining point sources and replace them by the background. The images were smoothed by a 10″ (FWHM) Gaussian. The images were then visually inspected to look for regions of diffuse emission. We found a single detection of an extended X-ray component in the smoothed map of 0156–252 shown in Fig. 6. In an ovally shaped region that can be approximated by an ellipse of ( kpc if it were to be located at the same distance as the radio galaxy), we find net counts () in the energy range (0.2–6) keV with an average energy of 1.2 keV. The centroid of the region is situated approximately 12″ to the northeast of the core of the radio source. The (observed-frame) 0.5–2 keV unabsorbed flux is erg cm-2 s-1. If this emission were to come from a sphere of thermal gas at the redshift of the radio source, it would correspond to a luminosity of erg s-1 and a mass of (assuming a uniform sphere). We could not identify this X-ray region with objects in any of our optical and near-infrared imaging data. Therefore, in this particular case the true nature of the emission remains highly obscure, and we cannot rule out it being due to noise. However, it illustrates the kind of emission that might be detectable in the search for high redshift cluster gas, provided a proper identification can be made.
Stacked fields
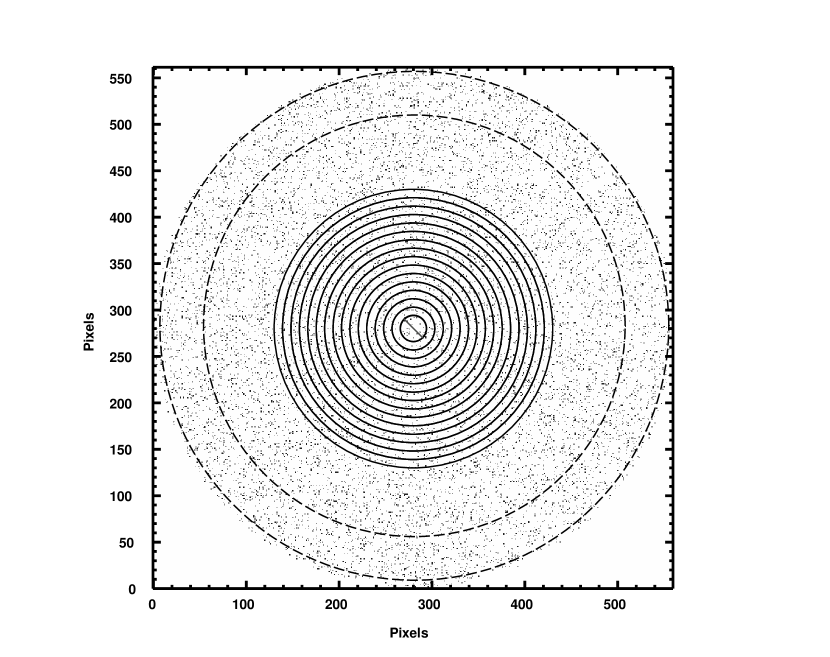
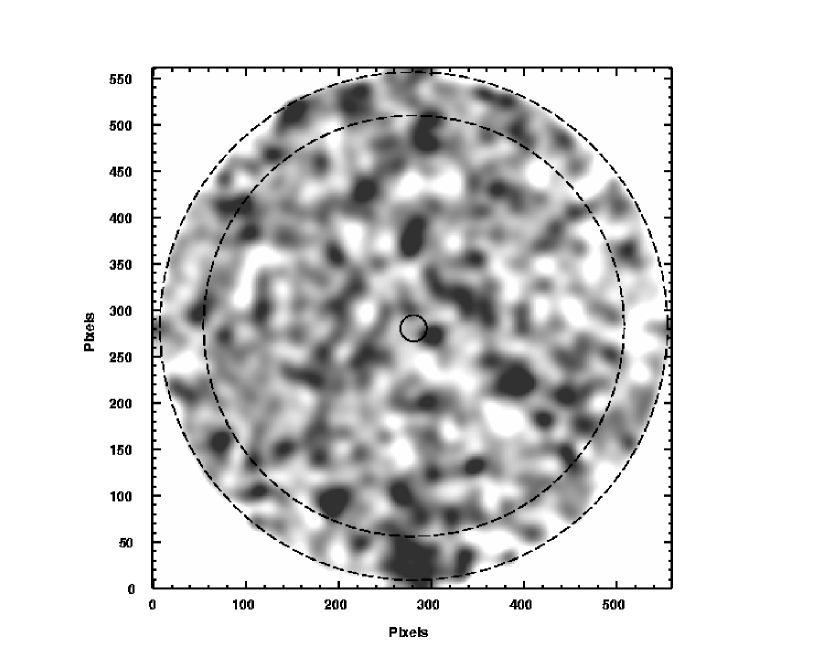
To further search for emission from thermal gas in an annular region surrounding the radio sources,
we stacked the five 20 ks exposures to obtain a single 100 ks exposure of a typical HzRG field.
Each field was cleared of point sources before stacking them. In the stacked image, we then replaced the entire
region inside a circle encompassing the largest of the radio
sources by the background to ensure that we are not measuring extended X-ray emission associated with the radio structures.
The stacked image was smoothed by a 10″ (FWHM) Gaussian. The stacked image and the smoothed image are
shown in Fig. 7. The region used for the background determination is indicated by the large, dashed annulus.
The small circle in the center of the field indicates the size of the largest radio source.
From the smoothed image, where
the scales run from below the mean to above the mean, we see no evidence for diffuse, extended emission
in the vicinity of the radio source(s). We obtained a radial profile of surface brightness from the stacked image
using the annuli as indicated in Fig. 7. The radial profile out to
is consistent with zero contribution from diffuse, extended X-ray emission, as shown in Fig. 8.
Out to a radius of ( kpc) we measure counts. Assuming a 1 keV thermal spectrum and correcting for galactic absorption, the upper limit on the (observed) 0.2–6 keV flux inside this radius is erg cm-2 s-1, corresponding to a luminosity of erg s-1. We derive a central electron density of cm-3 and a total enclosed gas mass of , assuming an isothermal sphere with a cluster -model surface brightness profile with and a core radius of 200 kpc.
3.5 Serendipitous X-ray sources
Pentericci et al. (2002) found evidence of an excess of Chandra detected X-ray sources in the vicinity of radio galaxy PKS 1138–262 at . They found 16 sources in the soft band (0.5–2 keV) with a minimum flux of erg cm-2 s-1, compared to 10.3 (11) calculated from the Chandra Deep Field South (North) for a similarly sized region, and 8 sources with fluxes erg cm-2 s-1 compared to 4 (5.1) for the Chandra Deep Fields. Although this may not be considered a substantial overdensity in angular space (an excess of compared to a typical cosmic variance of ), it is very significant in redshift space given that six of the serendipitous X-ray sources could be identified with previously discovered Ly or H emitting galaxies in the protocluster surrounding PKS 1138–262 (Pentericci et al. 2002). Therefore, observing overdensities of X-ray sources may provide evidence for the existence of galaxy overdensities associated with radio sources (see also Cappi et al. 2001).

Following Pentericci et al. (2002), we use WAVDETECT to investigate the presence of serendipitous sources in our 5 fields. Because the 2 separate observations of 0156–252 were taken at different roll angles, the corners of the ACIS-S3 chip only have half of the total 20 ks exposure time. We specify a circular region covering the maximum area having the full 20 ks depth. The circle has a radius of 3.852′, thereby covering an area of 46.62′2. For consistency we use this region in all the fields. We limit the energy range for source detection to a maximum of 2 keV (cf. Pentericci et al. 2002) to improve the (the background is lower at lower energies). For each field, we exclude the radio source, and we only consider sources that are detected with , where we define as the number of background-subtracted counts divided by the root of the total counts. The net count rates of the detected sources were converted into fluxes assuming a power-law spectrum with Galactic absorption along the line of sight, and a photon index of for the soft band. Table 6 lists the number of sources in each field that have soft (0.5–2 keV) fluxes of and erg cm-2 s-1. Besides the number of sources found in each 46.62′2 area we give the number density per square degree between parentheses. We also list the number of sources in each bin averaged over the 5 fields. For comparison, we have run the same detection procedure on the observations of PKS 1138–262 using (i) the full 40 ks exposure, and (ii) a 20 ks subsample. We have also indicated the number of sources found in the Chandra Deep Fields (Mushotzky et al. 2000; Giacconi et al. 2001).
| Field | Number of sourcesa | |
|---|---|---|
| 7 (541) | 5 (386) | |
| 7 (541) | 7 (541) | |
| 5 (386) | 4 (309) | |
| 7 (541) | 5 (386) | |
| 2 (154) | 1 (77) | |
| average of fields | 6 (463) | 4 (309) |
| 7 (541) | 6 (463) | |
| 11 (715) | 7 (541) | |
| CDFse | 6/7 (470/540) | 3/4 (260/330) |
a Number of X-ray sources sources found in the field (per deg2)
b Minimum source flux in units of erg s-1 cm-2
c Comparison 1: A 20 ks subsample of the full 40 ks observation of 1138–262
d Comparison 2: The full 40 ks exposure of 1138–262 (Pentericci et al. 2002)
e Comparison 3: The Chandra Deep Field South/North (Mushotzky et al. 2000; Giacconi et al. 2001)
The number of bright sources in the field of 0406–244 is twice as high compared to the Chandra Deep Fields, and similarly high as PKS 1138–262. The number of sources in the field of 2048–272 is less than half of the number of sources in the CDFs in both flux bins. On average we find 6 and 4 sources in the and erg cm-2 s-1 flux bins, respectively, in good agreement with the CDFs. Based on these number counts of serendipitous sources, we find no evidence that the radio sources lie in the same cluster environments as is observed in the case of PKS 1138–262 by Pentericci et al. (2002). However, as indicated in Table 6 the factor excess of faint, sources in the field of PKS 1138–262 only becomes apparent in the full 40ks exposure, which may indicate that our exposures are not deep enough to make a good comparison.
To further study whether there is a preference for field sources to lie in the vicinity of high-redshift radio sources, we register the five fields using the radio source positions as centroids, and we rotate the fields around their original center so that the area of overlap is maximized. This is shown in Fig. 9. The number density of sources found within 1 Mpc (at ) from the radio sources is 0.77 arcmin-2, compared to 0.4 arcmin-2 for the density of sources outside this region and 0.6 arcmin-2 for the average density of the entire field. However, the cosmic variance of field X-ray sources is significant (25%, e.g. Cappi et al. 2001), making it impossible to conclude if serendipitous sources cluster around radio sources on the basis of the current data. Spectroscopy may confirm whether some of these sources are associated with the radio galaxies.

4 Summary and conclusions
We have studied X-ray observations of five radio galaxies at , thereby significantly increasing the number of Chandra studies on high redshift radio galaxies. The main conclusions from our analysis are the following.
The X-ray emission that we detect from the nuclei are consistent with obscured power-law spectra as observed for powerful radio galaxies over a wide redshift range (e.g. Harris et al. 2000; Carilli et al. 2002; Young et al. 2002; Hardcastle et al. 2002; Scharf et al. 2003), and can be explained by the unified model in which the broad-line region of radio galaxies is obscured by a dusty torus surrounding the nucleus. For 0156–252, this conclusion is confirmed by the fact that the best-fit core spectrum is an absorbed power-law with cm-2.
Extended X-ray emission coincident with the radio lobes was detected for several of the sources, albeit at low S/N. For all but one source, the straight extrapolation from the radio to the X-ray using the radio spectral index rules out a synchrotron origin of the emission, unless there are large errors in the radio spectral indices measured between 5 and 8 Ghz. Although the predicted X-ray synchrotron flux in source 0156–252 is close to the observed value, we have found evidence for the X-ray emission being likely associated with shocked, line emitting gas. Our observations confirm that the radio lobes of these high redshift sources may interact with the surrounding (forming) IGM.
We interpret the X-ray emission of the remaining sources as being due to the inverse Compton scattering of CMB photons off radio synchrotron electrons. This conclusion is supported by the fact that our estimates of the IC/CMB and equipartition magnetic field strenghts are in good agreement. Although IC/CMB is usually dominated by other processes (e.g. SSC) at low redshift, the relative ease with which it is detected in these HzRGs may be ascribed to the increase in the energy density of the CMB.
This research was partly motivated by the large RM observed for a significant fraction of HzRGs. Can the large RM be caused by cluster-sized atmospheres surrounding the radio sources? Taking reasonable estimates for the pathlength ( kpc) and the cluster magnetic field strength (G), an intrinsic RM of rad m-2 would require an ICM electron density of cm-3. The existence of cores much denser than this is unlikely, since they would have an X-ray luminosity of erg s-1 which has not been observed in any of the HzRGs observed to this date. Although higher density material ( cm-3) is present in many HzRGs in the form of K emission line clouds, the filling factor of this gas () usually implied makes it hard to reproduce the high values of RM (e.g. Pentericci 1999). Alternatively, the large RM can arise from the radio emission passing through a sheath of shocked gas surrounding the radio lobes (e.g. Athreya et al. 1998; Carilli et al. 2002, and references therein). The increased gas density implied can then explain the large RM if the magnetic field is ordered on scales of only a few kpc. If the X-ray emission from the NE lobe of 0156–252 is from shocked gas (as suggested by the bow shock feature seen in the HST/WFPC2 image, see Fig. 5), then G given the RM from Table 2 and the derived density of 0.05 cm-3.
The existence of protoclusters around several HzRGs at and higher has been established, mainly through narrow-band, Ly imaging observations and spectroscopy. However, such studies have not yet been carried out for the sources presented in this paper. An overdensity of X-ray sources associated with the well-known galaxy protocluster around the radio source 1138–262 at was found by Pentericci et al. (2002). We have analysed the number density of X-ray sources in each of the five Chandra fields. None of the fields showed evidence of large-scale structure associated with the radio sources. This may suggest that these HzRGs are not found in the same, overdense environments as 1138–262. Similarly, employing several different methods we found no evidence for virialised gas, although the upper limits that we derive on thermal gas are not inconsistent with a direct, no-evolution extrapolation of local X-ray luminous clusters out to . Based on the X-ray observations presented in this paper alone, the current standing is that these five HzRGs are not in galaxy overdensities. However, we remark that X-ray observations are not the most effective way to search for galaxy overdensities given the relatively small number fraction of AGN expected at each particular epoch.
Recent observations of some of the most distant, X-ray luminous clusters made with the Advanced Camera for Surveys aboard HST, show a color-magnitude relation comparable to that of local clusters, indicating that early-type galaxies were already well-established by (Blakeslee et al. 2003). Thus, the epoch in which the global relations that exist in clusters today are shaped must probably be sought at significantly higher redshifts than currently probed (i.e. ). About a dozen high redshift galaxy overdensities or protoclusters have now been found at , either around HzRGs and quasars or in wide-field surveys. In the near future we may expect several candidates suitable for a detailed study with Chandra that could determine exactly at what redshift the virialised gas was established. However, the sensitivity required may be of the order of that of the Chandra deep fields, due to the extreme cosmological surface brightness dimming. While HzRGs have so far presented the best evidence of being associated with massive, forming clusters, they usually come with a plethora of non-thermal X-ray mechanisms. Especially if the radio sources lie at the bottom of the potential well that coincides with the peak of the bremsstrahlung luminosity, they may not be ideal targets for trying to detect this extemely low surface brightness emission from the ICM.
Acknowledgements.
The work at SAO was partially supported by NASA grant GO2-3139B and contract NAS8-39073. We thank Michiel Reuland and Andrew Zirm for productive discussions, and Melanie Johnston-Hollitt for helping out with the MIRIAD software. We are grateful to the referee, P. Tozzi, for his many good comments.References
- Athreya et al. (1998) Athreya, R. M., Kapahi, V. K., McCarthy, P. J., & van Breugel, W. 1998, A&A, 329, 809
- Bagchi et al. (1998) Bagchi, J., Pislar, V., & Lima Neto, G. B. 1998, MNRAS, 296, L23
- Band & Grindlay (1985) Band, D. L. & Grindlay, J. E. 1985, ApJ, 298, 128
- Belsole et al. (2004) Belsole, E., Worrall, D. M., Hardcastle, M. J., Birkinshaw, M., & Lawrence, C. R. 2004, MNRAS, 352, 924
- Blakeslee et al. (2003) Blakeslee, J. P., Franx, M., Postman, M., et al. 2003, ApJ, 596, L143
- Brand et al. (2003) Brand, K., Rawlings, S., Hill, G. J., et al. 2003, MNRAS, 344, 283
- Brinkmann et al. (2000) Brinkmann, W., Laurent-Muehleisen, S. A., Voges, W., et al. 2000, A&A, 356, 445
- Brunetti (2000) Brunetti, G. 2000, Astroparticle Physics, 13, 107
- Cappi et al. (2001) Cappi, M., Mazzotta, P., Elvis, M., et al. 2001, ApJ, 548, 624
- Carilli et al. (2002) Carilli, C. L., Harris, D. E., Pentericci, L., et al. 2002, ApJ, 567, 781
- Carilli et al. (1997) Carilli, C. L., Roettgering, H. J. A., van Ojik, R., Miley, G. K., & van Breugel, W. J. M. 1997, ApJS, 109, 1
- Carilli & Taylor (2002) Carilli, C. L. & Taylor, G. B. 2002, ARA&A, 40, 319
- Dickey & Lockman (1990) Dickey, J. M. & Lockman, F. J. 1990, ARA&A, 28, 215
- Donahue et al. (2003) Donahue, M., Daly, R. A., & Horner, D. J. 2003, ApJ, 584, 643
- Eilek & Owen (2002) Eilek, J. A. & Owen, F. N. 2002, ApJ, 567, 202
- Ensslin et al. (2003) Ensslin, T. A., Vogt, C., Clarke, T. E., & Taylor, G. B. 2003, ApJ, 597, 870
- Fabian et al. (2002) Fabian, A. C., Crawford, C. S., & Iwasawa, K. 2002, MNRAS, 331, L57
- Fabian et al. (2003) Fabian, A. C., Sanders, J. S., Crawford, C. S., & Ettori, S. 2003, MNRAS, 341, 729
- Gehrels (1986) Gehrels, N. 1986, ApJ, 303, 336
- Giacconi et al. (2001) Giacconi, R., Rosati, P., Tozzi, P., et al. 2001, ApJ, 551, 624
- Hardcastle et al. (2002) Hardcastle, M. J., Birkinshaw, M., Cameron, R. A., et al. 2002, ApJ, 581, 948
- Hardcastle & Worrall (1999) Hardcastle, M. J. & Worrall, D. M. 1999, MNRAS, 309, 969
- Harris & Grindlay (1979) Harris, D. E. & Grindlay, J. E. 1979, MNRAS, 188, 25
- Harris et al. (2000) Harris, D. E., Nulsen, P. E. J., Ponman, T. J., et al. 2000, ApJ, 530, L81
- Ivison et al. (2000) Ivison, R. J., Dunlop, J. S., Smail, I., et al. 2000, ApJ, 542, 27
- Iwamuro et al. (2003) Iwamuro, F., Motohara, K., Maihara, T., et al. 2003, ApJ, 598, 178
- Kurk (2003) Kurk, J. 2003, Ph.D. Thesis, Universiteit Leiden
- Kurk et al. (2000) Kurk, J. D., Röttgering, H. J. A., Pentericci, L., et al. 2000, A&A, 358, L1
- Leahy (1987) Leahy, J. P. 1987, MNRAS, 226, 433
- McCarthy et al. (1996) McCarthy, P. J., Baum, S. A., & Spinrad, H. 1996, ApJS, 106, 281
- Miley (1980) Miley, G. 1980, ARA&A, 18, 165
- Miley et al. (2004) Miley, G. K., Overzier, R. A., Tsvetanov, Z. I., et al. 2004, Nature, 427, 47
- Mushotzky et al. (2000) Mushotzky, R. F., Cowie, L. L., Barger, A. J., & Arnaud, K. A. 2000, Nature, 404, 459
- Pentericci (1999) Pentericci, L. 1999, Ph.D. Thesis
- Pentericci et al. (2002) Pentericci, L., Kurk, J. D., Carilli, C. L., et al. 2002, A&A, 396, 109
- Pentericci et al. (2000a) Pentericci, L., Kurk, J. D., Röttgering, H. J. A., et al. 2000a, A&A, 361, L25
- Pentericci et al. (2001) Pentericci, L., McCarthy, P. J., Röttgering, H. J. A., et al. 2001, ApJS, 135, 63
- Pentericci et al. (1999) Pentericci, L., Röttgering, H. J. A., Miley, G. K., et al. 1999, A&A, 341, 329
- Pentericci et al. (2000b) Pentericci, L., Van Reeven, W., Carilli, C. L., Röttgering, H. J. A., & Miley, G. K. 2000b, A&AS, 145, 121
- Perley & Taylor (1991) Perley, R. A. & Taylor, G. B. 1991, AJ, 101, 1623
- Rosati et al. (1999) Rosati, P., Stanford, S. A., Eisenhardt, P. R., et al. 1999, AJ, 118, 76
- Rosati et al. (2004) Rosati, P., Tozzi, P., Ettori, S., et al. 2004, AJ, 127, 230
- Rudnick & Blundell (2003) Rudnick, L. & Blundell, K. M. 2003, ApJ, 588, 143
- Rush et al. (1997) Rush, B., McCarthy, P. J., Athreya, R. M., & Persson, S. E. 1997, ApJ, 484, 163
- Scharf et al. (2003) Scharf, C., Smail, I., Ivison, R., et al. 2003, ApJ, 596, 105
- Simard-Normandin & Kronberg (1980) Simard-Normandin, M. & Kronberg, P. P. 1980, ApJ, 242, 74
- Smail et al. (2003) Smail, I., Scharf, C. A., Ivison, R. J., et al. 2003, ApJ, 599, 86
- Smith et al. (2002) Smith, D. A., Wilson, A. S., Arnaud, K. A., Terashima, Y., & Young, A. J. 2002, ApJ, 565, 195
- Stanford et al. (2001) Stanford, S. A., Holden, B., Rosati, P., et al. 2001, ApJ, 552, 504
- Stevens et al. (2003) Stevens, J. A., Ivison, R. J., Dunlop, J. S., et al. 2003, Nature, 425, 264
- Taylor et al. (1994) Taylor, G. B., Barton, E. J., & Ge, J. 1994, AJ, 107, 1942
- Tozzi et al. (2001) Tozzi, P., Rosati, P., Nonino, M., et al. 2001, ApJ, 562, 42
- van Ojik et al. (1997) van Ojik, R., Roettgering, H. J. A., Miley, G. K., & Hunstead, R. W. 1997, A&A, 317, 358
- Venemans et al. (2002) Venemans, B. P., Kurk, J. D., Miley, G. K., et al. 2002, ApJ, 569, L11
- Wilson et al. (2000) Wilson, A. S., Young, A. J., & Shopbell, P. L. 2000, ApJ, 544, L27
- Windhorst et al. (1998) Windhorst, R. A., Keel, W. C., & Pascarelle, S. M. 1998, ApJ, 494, L27
- Young et al. (2002) Young, A. J., Wilson, A. S., Terashima, Y., Arnaud, K. A., & Smith, D. A. 2002, ApJ, 564, 176
- Yuan et al. (2003) Yuan, W., Fabian, A. C., Celotti, A., & Jonker, P. G. 2003, MNRAS, 346, L7