The DEEP Groth Strip Survey VIII: The Evolution of Luminous Field Bulges at Redshift z 11affiliation: Based on observations obtained at the W. M. Keck Observatory, which is operated jointly by the University of California and the California Institute of Technology and on observations made with the NASA/ESA Hubble Space Telescope (HST) obtained from the data Archive at the Space Telescope Science Institute (STScI), which is operated by the Association of Universities for Research in Astronomy, Inc., under NASA contract NAS5-26555. These observations are associated with proposals GTO 5090 and GTO 5109.
Abstract
We present a candidate sample of luminous bulges (including ellipticals) found within the Groth Strip Survey (GSS), with spectroscopic redshifts of from the Keck Telescope. This work is distinguished by its use of 2-D two-component decomposition photometry from Hubble Space Telescope (HST) images to separate the bulge from any disk before applying the sample selection and to measure disk-free colors. We define a statistically complete sample of 86 bulges with profiles and luminosities brighter than . Although larger samples of distant early-type galaxies exist, this is the largest and most homogeneous sample of bulges at with spectroscopy. A brighter subset of 52 objects with added structural constraints defines our “quality sample” that is used to explore bulge luminosities and colors.
We find that 85% of luminous () field bulges at redshift are nearly as red () as local E/S0’s. Almost all (90%) of these very red bulges reside in galaxies with the morphologies of normal early-type or spiral galaxies. Moreover, the slope of the color-luminosity relation is shallow () and the intrinsic color dispersion is small ( mag), suggesting roughly coeval formation. All three results are similar to that seen among early-type cluster galaxies at the same epoch.
Yet we also measured mag increase in surface brightness. Since simple passive evolution of a single-burst stellar population results in redder colors as the galaxy fades, the observed constancy of very red colors at high redshift suggests more complex histories. One alternative starts with a metal-rich (twice solar), early-formation () population that is later polluted with small amounts (5% by total mass) of star formation over an extended period of several Gyr. This “drizzling” history is supported by our finding spectroscopic evidence for continued star formation ([O II] emission lines) among 80% of luminous high redshift galaxies that have very red colors in both their bulges and disks. Although some very red () disks are found, almost all disks have the same or bluer colors than their accompanying bulges, regardless of the bulge-disk ratio and bulge luminosity. This result matches the results of semi-analytic hierarchical galaxy formation models, in which massive bulges are assembled from major mergers of large disks with accompanying disks forming later from gas infall.
Finally, we measure the integrated very-red () bulge light at to be . This amount is roughly one-third of the restframe luminosity for all GSS galaxies at that redshift. The uncertainties in both local and our distant bulge luminosity densities remain too large to settle the issue of whether a large fraction of bulges were formed or assembled after a redshift .
Blue () bulge candidates are present, but only as a minor (8%) population. In general, such candidates have luminosities and surface brightnesses lower than that of the very red bulges; have large disk fractions by luminosity; and have emission linewidths typically less than 100 . These properties are all inconsistent with those predicted for star-forming progenitors of the luminous bulges of today, i.e., the blue photo-bulges are not genuine blue ellipticals or bulges. Moreover, over 60% of the bulge candidates that are not very red appear to reside in galaxies with morphologies suggestive of interactions and mergers. Thus our deeper, more extensive, and less disk-contaminated observations challenge prior claims by other groups that 30% to 50% of field bulges or ellipticals are in a blue, star-forming phase at redshifts .
We conclude, with the caveat that luminous ellipticals and bulges at have light profiles, that they, as do luminous early-type cluster galaxies at the same redshift, are already dominated by metal-rich, old stellar populations that have been fading from a formation epoch earlier than redshift . Only small amounts of residual star formation are needed to explain both the absence of bluening of bulges to today and the presence of emission lines seen in the Keck spectra of the very-red distant galaxies.
1 Introduction
1.1 Background
As reviewed by Wyse, Gilmore, & Franx (1997), the ages of bulges (defined here to be the equivalent of the term spheroids that include ellipticals 111 E, E/S0, and S0 morphological types together as a class are often called spheroidal galaxies or more succinctly designated in this paper as E-S0, to avoid the ambiguity of the E/S0 designation and confusion with bulges. and the bulges of S0’s and spirals) remain an important unsolved problem in stellar populations and galaxy formation. Moreover, the formation of bulges is now of enhanced interest given the discovery of the tight relationship between the masses and velocity dispersions of local bulges and the masses of black holes in galactic nuclei (Magorrian et al., 1998; Ferrarese & Merritt, 2000; Gebhardt et al., 2000).
To explore the ages, formation mechanisms, and evolution of bulges, astronomers have taken two basic observational approaches — 1) to study the fossil records imprinted in the luminosities, colors, kinematics, spatial distribution, and chemical abundances of stars and in gas distributions in local bulges and 2) to study the more global properties (structure and stellar populations) of galaxies distant enough in lookback time to reveal the evolution and even perhaps formation of bulges .
As one example of the latter approach, data of distant galaxies were compared to plausible formation scenarios by Bouwens, Cayón & Silk (1999). They specified three basic models: 1) a secular evolution model in which bulges first form 2 Gyr after disks; 2) a simultaneous formation model in which bulge formation commences at the formation time of the disks; and 3) an early bulge formation model in which bulges and field E-S0’s form before disks. Models 1) and 2) both predict that a large fraction of distant bulges are luminous and very blue, while model 3) predicts mainly very red bulges. By examining the colors and bulge-to-total ratios (B/T) for about 60 galaxies in the literature with redshifts , Bouwens et al. (1999) found that they were unable to differentiate among the models. The larger sample and higher-redshift needed for discrimination is met by the new sample presented here. Our new data unambiguously exclude models 1) and 2), with only model 3) matching well enough to be viable.
Another area of controversy is whether E-S0’s were 1) predominantly formed in a rapid burst of star formation at high redshifts (e.g., ), or instead 2) formed their stars mainly at later epochs (redshifts ) via merging. As comprehensively reviewed by Schade et al. (1999), the evidence is extensive but inconclusive. Clusters show consistent results from different studies: a tight color-magnitude relation for E-S0’s and very red colors that persist to quite high redshifts (). These findings support the early bulge formation scenario, at least for some cluster galaxies (see van Dokkum & Franx 2001 giving a more complicated model). Studies of field populations, on the other hand, show no such consistency. Several studies favor scenarios with extensive and recent evolution by claiming that 30% to 50% of E-S0’s are blue at high redshifts () or that the volume density of elliptical and red galaxies was 2 or 3 times lower in the past. Other studies find little evidence for such recent dramatic evolution.
Schade et al. (1999) tried to address this issue. Based on 11 ellipticals with spectroscopic redshifts , they measured luminosity evolution that matches that of passively evolving cluster galaxies and found no evidence for a major decline in volume density since . On the other hand, they had two results that are inconsistent with a strictly old stellar population: blue colors for their ellipticals and strong [O II] emission lines.
In a more recent work using HST optical and near-infrared ground photometry of E-S0’s (Ellis et al., 2001), the authors find that the centers of non-peculiar spirals with prominent bulges are redder than the colors of the surrounding disks. This is one of the robust predictions of hierarchical models, namely that disks form after bulge formation. These central colors, presumably dominated by the bulge, are, however, bluer than those of most pure ellipticals at the same redshifts (up to ). This result in the optical appears to contradict the robust prediction of hierarchical galaxy formation models that spiral bulges should on average be older (i.e., redder) than pure ellipticals (Kauffmann, 1996; Baugh, Cole, & Frenk, 1996). On the other hand, while the central colors in the near infrared of spiral bulges remain bluer than most ellipticals at low redshifts (), Ellis et al. (2001) find that they become as red or redder than that of ellipticals at higher redshifts. Ellis et al. surmise that this difference in relative colors in the optical and near infrared could be explained by star formation in bulges that occurs through bursts rather than more continuous activity. They also speculate that the match in redshifts of this change in behavior to that found for the disappearance of barred spirals (Abraham et al., 1999) might support the secular formation of at least some bulges at low redshifts.
Further evidence for continued formation of field E-S0’s since comes from two other surveys. Stanford et al. (2004) find that roughly half of the early-type galaxies (may include some early spirals) found to just beyond and identified by morphology using the HST near-infrared (NICMOS) images, are bluer than predicted by passive evolution of an early burst. Another work finds strong internal spatial variations in the colors of more than 30% of the faint E-S0’s in the HDF (Menanteau, Abraham, & Ellis, 2001). They do not find such variations in cluster galaxies and estimate “that at , about half the field spheroidals must be undergoing recent episodes of star-formation,” a result qualitatively expected in some hierarchical models of elliptical formation.
1.2 Present Work
To readdress these issues on field bulge formation, the first phase of the DEEP 222Deep Extragalactic Evolutionary Probe: see URL http://deep.ucolick.org/ survey has focused on several pilot programs that rely on a redshift survey of over 1000 faint (median ) field galaxies. These data have been taken with the first generation of spectrographs on the W. M. Keck 10 m telescopes and are complemented with imaging and ground-based multicolor photometry (Koo, 1998). The second phase of DEEP (DEEP2) is a much more extensive survey of about 50,000 galaxies reaching similar limits of and exploiting multicolor photometry to isolate galaxies with redshifts (Faber et al., 2003; Davis et al., 2003).
As part of phase one, DEEP has recently completed the acquisition and reduction of 604 redshifts in the Groth Strip Survey (see 3.1). The present work is one of four papers addressing the nature of early-type galaxies and bulges at high redshifts . In one companion paper, Gebhardt et al. (2003, :GSS9) extract internal absorption-line velocity dispersions of 36 galaxies and add luminosities and surface brightness data from images to study the evolution of the Fundamental Plane from redshifts . In another companion paper, Im et al. (2002, : GSS10) identify a sample of 145 E-S0 candidates over a wide redshift range () and brighter than to tackle the issue of the volume density evolution of E-S0’s; this sample also includes galaxies with only photometric redshifts. In a third related paper (Im et al., 2001), the likely descendants of 10 distant blue spheroidal candidates are examined in more detail.
The present work isolates a spectroscopic redshift sample of 86 candidate bulges at high redshifts with light profiles and brighter than . This limit ensures high completeness, which is important for studies of volume densities, and good-quality photometry, which is needed for deriving reliable structural parameters and colors. Unlike most surveys selected by the brightness of the total galaxy, this sample is selected on the brightness of the bulge alone. Note that our selection in the passband corresponds roughly to selection in restframe at redshift .
Several key issues can be addressed by this sample that are not part of the other two main companion papers (GSS9 and GSS10):
1) What are the colors of the bulge without contamination from the disk?
2) How do these colors relate to other properties of the galaxies such as disk and galaxy colors, bulge-to-total ratios (B/T), galaxy or bulge luminosities, and bulge sizes or surface brightnesses?
3) What is the total elliptical and bulge luminosity density at high redshifts?
The paper is organized as follows. Section 2 gives an overview of the HST and Keck observations and reduction procedures and details the determination of the selection function for the bulge candidate sample. Section 3 describes the sample characteristics and correlations among colors, luminosities, B/T, sizes, and surface brightnesses. This section also makes estimates of the luminosity density of distant, old bulge stellar populations. Readers wishing to bypass the details may want to examine figures 5 to 9 and otherwise skip Sections 2 and 3 and jump directly to the discussion. The discussion in Section 4 starts with a summary of the key results from Section 3 and then compares results to those of the other DEEP papers mentioned above and to those of other bulge-related surveys. Section 5 makes direct comparisons to predictions of several models of bulge formation from Bouwens and to semi-analytic models of Kauffmann. Section 6 closes the discussion with a summary of our key conclusions and implications for the formation of ellipticals and the bulges of S0’s and spirals. The appendix includes further discussion of the sample selection function, additional figures comparing the observations to theoretical predictions, and detailed notes on individual objects.
We adopt a Hubble constant = 70 Mpc-1 and a flat cosmology with and . At redshift , this cosmology yields a scale of 1 arcsec = 8.0 kpc, while of galaxies today at appears at for a very red spectral type and at for an actively star forming galaxy with restframe . The lookback time is 7.7 Gyr for a universe that is 13.5 Gyr old. Our photometry is in the Vega system (see Fukugita et al. 1995 for conversion factors and definitions) with , where ranges from 0.2 to 1.0, depending on the spectral shape and redshift; , where is that of Cousins. For conversion to the system: , and
Our sample limit of is the same as . Throughout the paper, will refer to and to for data from .
Colors for our sample are in the HST WFPC2 system, corresponding roughly to restframe at redshifts (see Fig. A11 in GSS9). To quantify our color terminology, the demarcation between “red” and “blue” is at restframe , which is the average color of Sbc galaxies (Fukugita et al., 1995). For passively evolving populations formed at high redshifts , the colors will be “very red”, i.e., since . As needed, we will adopt finer binnings and clarify the divisions between blue and red adopted by previous studies.
2 OBSERVATIONS
2.1 Structural Measurements from HST Images
This section provides a brief summary of the overall survey as detailed by Vogt et al. (2004, : GSS1) and the procedures to produce the structural measurements as detailed by Simard et al. (2002, : GSS2).
The HST data known as the “Groth Strip Survey” (GSS) consists of 28 overlapping WFPC2 subfields oriented NE to SW at roughly 14:17+52 at Galactic latitude . All subfields have exposures of 2800 s in the broad filter () and 4400 s in the broad filter () that reach a detection limit of , except for one subfield with total exposures of 24,400 s in and 25,200 s in . Object catalogs were produced with SExtractor version 1.0a (Bertin & Arnouts, 1996) while the surface brightness profiles of galaxies in the object catalog were fitted with a PSF-convolved 2D two-component model (GIM2D: GSS2; Simard 1998; Marleau & Simard 1998). The best fitting parameter values along with their confidence intervals were found using Monte-Carlo sampling of parameter space to maximize the likelihood function.
The first photometric component (which we term the “photo-bulge,” short for photometric bulge) of the 2D surface brightness model is a Sérsic profile of the form:
| (1) |
where is the surface brightness at along the semi-major axis in linear flux units per unit area, is the bulge effective radius and is the surface brightness at this radius. The parameter was set equal to 1.9992 0.3271 so that remained the projected major-axis radius enclosing half of the light in this component. Thus the effective radius measured with a circular aperture is where and are the major and minor axis sizes, respectively.
Although we have the option of letting be another free parameter in our fits, our data, relative to that used in fits of nearby galaxies, are of much lower S/N and have poorer spatial sampling. We thus choose for this starting work on distant bulges to lock to a constant for the current analysis, namely the classical de Vaucouleurs profile value of 4. This is certainly an oversimplification and likely to be incorrect for bulges in general. Local, late-type spiral galaxies with , for example, are better fit by = 1, i.e., an exponential profile (de Jong, 1994). Furthermore, to improve convergence of the fitting, an exponential profile for bulges may be justified even if it is not theoretically the best fit (de Jong, 1996b). Our sample of bulges is, however, quite luminous, roughly or brighter at redshift , and is thus still quite massive even after allowing for one or two magnitudes of possible luminosity evolution. Since there is extensive evidence that bright local ellipticals and the bulges of early-type spiral galaxies generally follow such a profile more closely than an exponential (de Jong, 1994; Andredakis et al., 1995; Courteau et al., 1996), our choice of = 4 is justified as a reasonable starting assumption. Future work with much deeper data on distant galaxies, e.g., the Hubble Ultra Deep Field (UDF 333http://www.stsci.edu/hst/udf; PI. S. Beckwith), should explore a wider range of bulge profiles.
The second component (or “photo-disk”, short for photometric disk) is a simple exponential profile of the form:
| (2) |
where is the face-on central surface brightness, is the radius along the major axis, and is the disk scale length.
When referring to the GIM2D photometric parameters, we adopt the terms photo-bulge (pB), photo-disk (pD), and photo-bulge to total ratio (pB/T), since the true structure and internal kinematics of the components from the photometric fits remain uncertain. The presence of an exponential component, e.g., does not necessarily imply the presence of an actual disk, since dynamically hot systems may also have exponential profiles (Lin & Faber, 1983; Kormendy, 1985). Likewise, an component may represent a central starburst or an AGN rather than a genuine, dynamically-hot bulge. Additional complications in interpretation arise when our simplifying assumption of a smooth, symmetric, exponential disk is invalidated by the presence of inner or outer truncations in the disks, of bars, of spiral arms, of rings, of tidal distortions, etc. Finally, we note that even bonafide pure ellipticals (e.g., cD’s or dwarf ellipticals) may yield photo-disk components in the fits if their true profiles do not follow our assumed de Vaucouleurs shape exactly and vice versa, genuine, pure disk galaxies may masquerade as having both a bulge and disk if the disk is not a pure exponential or if the exponential disk has a color gradient when the simultaneous GIM2D fit is adopted as described below.
For this work, we used the simultaneous fit option of GIM2D (GSS2). In this case, the scale lengths, central positions, ellipticities, and position angles of each component were made to be the same in both the and images, and only the fluxes were free to vary to yield a color (GSS2). The underlying assumption in adopting this approach is that any internal color gradients or color-dependent asymmetries in the bulge and disk components can be neglected. As an empirical check of this assumption, we selected a sample limited to photo-bulges brighter than in our spectroscopic sample and compared the photo-bulge sizes as measured from separate GIM2D fits to the and images. Although the scatter was high, typically a factor of two, we found no evidence for any systematic color gradients among either the very red or blue photo-bulges that dominated (90%) the sample. The less red photo-bulges did appear to have larger effective radii in the blue image, indicating a redder center. But these comprised only a 10% fraction of the total sample, not enough to justify using separate GIM2D fits for the analysis, especially given the improved precision in colors (typically a factor of two) by adopting simultaneous GIM2D fits. This check for color gradients was repeated for the photo-disk scale lengths. Except for perhaps a 20% larger scale length in the bluer image for the few (12%) very large photo-disks, we again found no systematic color gradients discernible within our random errors.
The simultaneous fits have three major advantages over the separate fits. First, simultaneous fits ensure that derived colors represent flux ratios as measured over the same spatial regions. There is no such assurance for colors derived from separate GIM2D fits, in which measurements in the and images may use different centers, ellipticities (or inclination angles), and position angles. Second, the analysis and discussion of colors is greatly simplified when using the simultaneous fit method by having only one average color value for each photo-bulge and photo-disk component. In contrast, the separate fit method results in at least a mean color and color gradient for each component, and this is meaningful only if the ellipticity (or inclination angle) and position angles are measured to be the same in both bands. Third, the simultaneous fit method dramatically reduces the number of free parameters by locking the central positions, sizes, ellipticities or inclination angles, and position angles to be the same for each of the photo-bulge and photo-disk components in the two bands. This reduction of up to 8 free parameters when using the simultaneous fit method yields colors that have significantly smaller and more reliable random errors, typically a factor of two, than from separate fits. We next address systematic errors in using the simultaneous fit method.
Following the approach described in Section 3.4 of Marleau & Simard (1998), GSS2 simulated 6000 model galaxies with variations in the luminosities for the bulge and disk components to reflect the observed range of colors from 0.5 to 2.2 and to depths corresponding to ; sizes of each ranged from 0 to 0.7; bulge eccentricities from 0 to 0.7; and disk inclinations from to . After adding Poisson noise, simulated images were placed within actual sky frames and then analyzed in exactly the same way as real galaxies. This procedure allowed a good test of the reliability of the GSS parameter values as measured with GIM2D.
The main purpose of using simultaneous fits is to improve the color estimates. Based on simulations of this mode of GIM2D, GSS2 conclude that there are no significant systematic color errors for the galaxy, bulge, or disk. For bulges with from 22 to 23.5, near our sample limit of 23.566, the average difference between the measured and input colors is only 0.03, small compared to the amount of color evolution expected (0.2 mag or more). Outliers were occasionally found, especially in cases where the disk and bulge colors or their relative sizes were at the extremes. In some cases, disks and bulges were interchanged from the input values. Thus a search was made in the simulations for regions of bulge fraction, ratio of bulge and disk size, and bulge to disk colors where bulges were mistaken for disks and vice versa. No regions were found with systematic errors, though outliers did exist, especially when bulge/disk ratios were very small or very large. These simulations also show that reliable photo-bulge fluxes and colors (systematic errors of less than 0.04 mag and typical random errors of 0.1 mag to 0.3 mag) can be expected for half-light sizes greater than pixels (0.03 arcsec). For a given photo-bulge flux, both the systematic and random errors are found to be actually smaller for smaller sizes until the 0.03 arcsec limit. We will later adopt this threshold in defining the bulge sample.
As explained in GSS2, systematic biases are expected in B/T at the extremes, i.e., near , where some measurements are underestimates of the true values, and near 1, where they are overestimates. Based on the systematic errors derived in GSS2, only 8 galaxies from our total sample of 86 objects are subject to systematic errors in pB/T greater than 0.04, and all are overestimates. Five are in the ”quality sample” defined in section 3.4: 094_1313 (0.07), 094_6234(0.09), 103_2074(0.09), 104_6432(0.07), and 113_3646(0.07) where the values in parentheses are the systematic overestimates of B/T. Three others not in the quality sample are: 092_6027(0.07), 153_5853(0.14), and 313_4845(0.11). Note that the simulations show that random errors in B/T are roughly 0.1 to 0.15 over the range of our data, so the 8 objects above are the only ones with systematic errors approaching random errors.
Besides the simulations, we also compared colors measured using circular apertures to those derived by GIM2D. The colors from seven aperture diameters of 0.3, 0.4, 0.5, 1, 1.5, 3, and 6 arcsecs were compared among themselves and to the galaxy, photo-bulge, and photo-disk colors from GIM2D for the bulge sample. The most revealing were the smallest aperture colors, so these central (0.3 arcsec diameter) aperture colors have been included with the GIM2D photometry in Table 1. Assuming bulges have steeper light profiles than exponential disks, the contamination from any disk light is expected to be less for smaller apertures, and indeed we find that the central aperture colors are almost always consistent with the GIM2D photo-bulge colors (see Fig. 1), with a median difference of less than 0.12 in and in the expected sense that the GIM2D colors are redder, since they should be less contaminated by any bluer disk light than raw colors measured via apertures. The few exceptions showing a blue nuclear color () and a redder () GIM2D photo-bulge color included cases where GIM2D identified the whole galaxy as being a very-red photo-bulge while a central blue component was considered a photo-disk (e.g., 283_5331). In several cases, the bulk of the galaxy is blue, the aperture color is redder, and the GIM2D photo-bulge color is very red (e.g., 294_2078). The GIM2D photo-bulge colors in these cases, however, have very large errors ( mag in the example), so such discrepancies are not statistically significant. Fig. 1 shows that all the extremely red GIM2D colors for photo-bulges have large estimated errors greater than 1.2 magnitudes peak to peak.
Finally, besides using aperture photometry and simulations to check our GIM2D results, we have also visually examined color images of the central 1 arcsec regions of the galaxies to check the photo-bulge colors. This sanity check confirms that GIM2D is giving reasonable photo-bulge results for almost all objects, with the few illusory exceptions being those where GIM2D claims the presence of a tiny red photo-disk imbedded within a larger, bluer photo-bulge (e.g., 273_7619).

2.2 Keck/LRIS Spectroscopy
Spectra of GSS galaxies have been obtained with the Low Resolution Imaging Spectrograph (LRIS, Oke et al. 1995) on the W.M. Keck II 10 m Telescope. DEEP/GSS galaxies were selected predominantly by the magnitude criterion in 27 subfields and in the Deep Field. Spectra of over 600 galaxies were acquired between May 1995 and April 1999, and these are the spectra used in this paper. Two separate exposures with red and blue gratings covered a total spectral range of about 4500–9100 Å, depending on the exact position of the target on the multi-slit masks. A 900 lines mm-1 grating gave a central wavelength 5800 Å, dispersion of 0.85Å/pixel, and resolution 3–4 Å FWHM. A 600 lines mm-1 grating gave a central wavelength 7700 Å, dispersion of 1.26 Å/pixel, and resolution 4–5 Å FWHM. Slit widths ranged from 1.0″to 1.23″. Typical total exposure times per target and per grating were 2700 seconds. Rectified, wavelength-calibrated, sky-subtracted 2D spectra were produced with a custom LRIS reduction package. Details of the spectral reduction are provided by Weiner et al. (2004: GSS3).
2.3 Selection Function for the Bulge Sample
Since selection effects may mimic real evolutionary changes in the high-redshift galaxy population, it is important to determine how they affect the DEEP/GSS sample in general and the present bulge sample in particular. Our approach has two parts. The first is to use simulations to determine the incompleteness of our photometric catalog from which the spectroscopic sample is derived. The second is to use a purely empirical determination of any incompleteness of the final, spectroscopically-confirmed sample by comparing it to the full photometric catalog. In both cases, simplifying assumptions as detailed in Appendix A are adopted in the analysis of selection functions.
The selection function can be quantified by a weight, , for each bulge that is proportional to the inverse of the effective areal coverage of the entire GSS sample (134 square arcmins) and which combines the selection functions that depend on multiple parameters. The total area covered by the spectroscopic survey is 90 square arcmins, with the minimum value for . For this work on bulges, we restrict the dependencies of the weight to a small subset of possible parameters that will be part of our analysis, namely, apparent flux, size (or surface brightness), color of the photo-bulge, and the photo-bulge to total ratio (pB/T). A more detailed discussion of selection functions, but for disks rather than bulges, is provided in Simard et al. (1999). Appendix A summarizes the main steps adopted for this study of the high redshift bulges. In general, we find that photo-bulge flux appears to dominate the dependencies and there is no evidence for any significant dependencies of on pB/T, size, or color at greater than 95% confidence limit. Based on the empirically derived ratio of the observed spectroscopic sample to that of the entire photometric sample, we adopt a simple selection function as follows:
W(76/28) = 2.7 for between 20 and 21;
W(57/26) = 2.2 for between 21 and 21.5; and
W(532/167) = - 41.5 for , (3)
where is the magnitude of the photo-bulge component as measured in the catalog using separate fits to the and images (see Table 1). The numbers in parentheses show the total number of objects in the photometric catalog over the number of spectroscopic targets. The slightly greater weight for the brightest interval reflects our selection bias against the very brightest galaxies for the spectroscopic survey. Further explanation of the weights is given in Appendix A.
2.4 K Corrections
To compare our high redshift observations to local samples, we have chosen for luminosity and for color, since the and filters coincide roughly with restframe and at redshifts near . These choices reduce uncertainties in the K-corrections that result from variations in the spectral energy distributions (SED) of galaxies. Slightly bluer restframe bands would be better matched to our data near redshift , but few local observations would then be available for comparison.
To convert our observed magnitudes () and colors [()] to restframe and , we adopt the following parametric conversions from GSS9:
,
and
,
where DM is the distance modulus for the adopted cosmology and
is the K-correction to convert from our band observations to restframe .
These transformations are valid in the redshift range and were derived from a subset (34 spectra) of an atlas of 43 spectra of local galaxies that extend far enough into the UV to match our filters beyond redshifts (see Kinney et al. 1996 or GSS9 for details). Two key advantages over the use of theoretical SED’s from stellar population synthesis (such as Bruzual & Charlot, 2003) are 1) the empirical inclusion of other factors that affect the SED, such as internal dust, variations in metallicity, and emission lines and 2) the extraction of intrinsic dispersions to the fits that yield estimates of the K-correction uncertainties. We find an RMS in the conversion that varies from about 0.03 mag at redshifts to about 0.08 mag at redshifts . The conversion has an intrinsic dispersion of roughly mag, i.e. about 0.05 mag at . We avoided the use of the popular set of empirical SEDs from Coleman et al. (1999) or other sources for K-corrections that depend on this set (e.g., Fukugita et al., 1995), because they comprise a very limited sample of only a few SEDs and, of more serious concern, are composites of spectra that do not actually match the SEDs of individual galaxies, thus introducing systematic errors. The major downside of using local SEDs rather than model SEDs is the possibility that evolution may affect the K-corrections, but given how close our filters are to the restframe bands of interest, any such biases are likely to be small. The values for and in Table 3 derived from Table 2 are based on the above relations.
2.5 Data Tables and Appendices
Table 1 provides the source identifications for the full sample of 86 candidate bulges; their J2000 coordinates; magnitudes, colors, and half-light radii of the whole galaxy and of the photo-bulge subcomponent from the GIM2D catalog of the entire GSS using separate two-component fits to each of and . The redshift and redshift quality; weight for use in estimating number densities; and notes that identify other publications on the galaxy are also given. Table 1 is ordered by the source identification name with the sequential number having an asterisk (*) added for those objects in the higher-quality subsample discussed below. The separate-fit catalog was used to select the starting sample in the present work; to determine the selection function (which would not be possible with the simultaneous catalog which included only the spectroscopic sample); and possible dependencies of the selection function on galaxy or photo-bulge flux, color, and size.
Appendix C provides comments for 66 galaxies, including more details on possible problems in the GIM2D fits, on emission-line velocity width data (see GSS3), and on identification of special subsamples such as the most luminous galaxies in which both the photo-bulge and photo-disks are very red (i.e., good S0 candidates).
Table 2, sorted by sequential numbers and source ID as in Table 1, provides the measured quantities from GIM2D using simultaneous two-component fits in the two filters. These are the measurements we have previously argued to be more accurate and reliable than from the separate-fit catalog. Besides the magnitudes and colors for the whole galaxy, photo-bulge, and photo-disk, the table gives pB/T as measured in the band; the major-axis effective radius of the photo-bulge and face-on scale-length of the photo-disk in arcsecs; the eccentricity of the photo-bulge; the inclination of the disk in degrees; and the reduced of the fits in each of the and images. Random errors at the 68% confidence level (roughly one sigma for normal distributions) from GIM2D fits are provided for all measurements. No corrections for any systematic or random errors as determined from simulations have been included (see Section 2.1). Note that errors of 0.00 returned by GIM2D correspond to values below 0.01, but all of these have been increased to 0.01 in the tables.
Table 3 provides derived quantities that depend on the choice of cosmology (i.e., ) and K-corrections, including absolute magnitudes (and pB/T) in rest-frame and rest-frame colors for the whole galaxy, the photo-bulge, and photo-disk; the major-axis effective (half-light) radius of the photo-bulge; the face-on exponential scale length of the photo-disk in kpc; and the cosmology independent surface-brightness of the photo-bulge in rest-frame per square arcsec as measured within the effective radius. As in Table 2, the errors are at the 68% confidence level, though again, no corrections have been applied for systematic or random errors (as determined from simulations and discussed in Section 2.1).
Table 4 consolidates the various subsamples divided by color and structure that will be relevant to the discussion of results. Statistics are provided for both the total sample of 86 bulge candidates and the “quality” sample of 52 candidates as defined below.
Table 5 consolidates the measurements of median colors of the photo-bulges and integrated galaxies for various subsamples here and from other studies .
3 RESULTS
3.1 Sample Characteristics
We will work with two bulge samples. The larger one of 86 galaxies represents a magnitude-limited and thus a statistically complete sample of bulges. This sample is compared to the full galaxy redshift sample, is used to address whether our photo-bulges are genuine bulges, and provides the data for estimating the high-redshift, red-bulge luminosity density. From the larger sample, a smaller “Quality Sample” of 52 objects is extracted. This Quality Sample is designed to have brighter bulges to yield better colors and photometry and to have a more reliable sample of genuine bulges by removing galaxies where GIM2D claims a very tiny disk embedded within a larger bulge.
The larger bulge sample is extracted from the full GSS spectroscopic redshift set with Keck redshifts (henceforth “full GSS-SRS”) using four selection criteria.
1) The redshift must be between 0.73 and 1.04. The lower limit was originally aimed to be at to match that of the high redshift bin of the CFRS sample and where the filter matches 3500 Å, close to restframe . But we found a small spike of redshifts centered at and thus decided to lower the limit to include it. The upper redshift limit was chosen so that [O II] 3727 Å just enters into the deep atmospheric A-band absorption at 7600 Å. The photo-bulge sample could be significantly expanded by increasing the redshift range, but at the cost of increasing the uncertainty in the K-corrections or in the homogeneity of the colors. At , is at restframe 4000 Å, close to the midpoint between and , and samples restframe 3000 Å.
2) The spectroscopic redshift should be reliable, i.e., Qz in column 12 of Table 1 must be 2.9 or greater. Individual objects were examined in detail so that we are virtually certain that redshifts are reliable.
3) The photo-bulge component alone must be brighter than (i.e., ). This flux limit was chosen to be near that yielding RMS errors of 0.5 mag for the photo-bulge in . Random color errors for very red photo-bulges are so large at this limit that we will later reduce it by another 0.5 mag to improve the quality of the photo-bulge colors.
4) The half-light size of the photo-bulge must be greater than 0.03 arcsec (0.3 pixels). This limit is chosen to exclude two clear-cut cases of AGN that masquerade as photo-bulges and to reduce the systematic and random errors of the photo-bulge (Section 2.1).
These four limitations reduce the full GSS-SRS set of 603 objects (stars, galaxies, and AGNs) to 86 objects. With the redshift cut 1) alone, the full GSS-SRS sample would be reduced to 216 objects; with the added redshift quality cut 2), the sample loses 5 to 211; with the addition of the cut by bulge luminosity 3), the sample reduces to 88 galaxies; and finally, with the bulge size cut 4), two obvious AGN’s (142_4838, a likely Seyfert 1, and 273_4925, a likely QSO; see Sarajedini et al. 2004 [GSSXII]) are eliminated to yield the final sample of 86. In principle, we could increase the sample by including redshifts from the Canada France Redshift Survey (CFRS: Lilly et al. 1995). Out of 31 galaxies in their 14h redshift sample that are not already in the GSS-SRS, 7 fall within our high redshift range. Of these, only one has a photo-bulge brighter than , namely, CFRS ID 14.0411 (GSS ID 043_3071), but it was excluded to retain homogeneity in the spectral information. The remaining paragraphs in this section compare this photo-bulge sample to that of the full 556 GSS-SRS galaxy sample with reliable redshifts.

Redshift Distribution: As seen in Fig. 2, the redshift distribution of the full GSS-SRS shows two strong spikes at redshifts 0.81 and 0.99, with two weaker concentrations at 0.75 and 0.91. Both of the strong spikes extend across the full GSS field (42 arc minutes, or roughly 19 Mpc) and are thus likely parts of larger superclusters rather than galaxies in the cores of rich clusters (see further discussions of these features by Le Fèvre et al. 1994; Koo et al. 1996, and Weiner et al. 2004). The photo-bulge sample appears representative by showing redshift peaks at the same redshifts, though the proportions drop significantly at redshifts near = 1.0, as expected when criterion (3) (bulge luminosity) is taken into account.
Spatial Distribution: When compared to the spatial distribution of the full, high-redshift GSS-SRS of 211 galaxies, the photo-bulge sample shows an excess in field 9, i.e., those with source ID of 09X_YYYY. More specifically, 30 of the 211 are in field 9 while the photo-bulge sample includes 19 of these. These 19/30 (63%) can be compared to the corresponding 67/181 (37%) in the remaining fields. Somewhat surprising is a strong concentration of 9/19 targets in the field-9 photo-bulge sample at redshifts between 0.900 to 0.905, rather than at the stronger peaks at 0.81 and 0.99. This result suggests the presence of a rich group of galaxies with luminous bulges at = 0.90 within field 9. This field happens to be near one of the clusters claimed by Ostrander et al. (1998), but the DEEP redshifts show their putative cluster to be a mixture of different redshifts. None of our conclusions are changed if field-9 galaxies are excluded from the analysis.
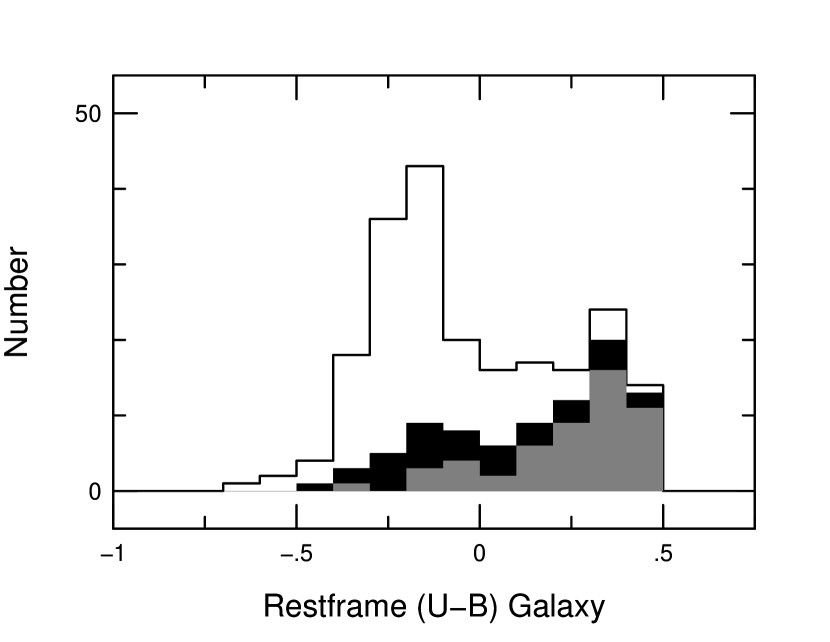
Magnitudes, Colors, Sizes, and Surface Brightnesses of Galaxies: Our selection provides a statistically complete sample of luminous, high-redshift bulges. Indeed, the great bulk (70%) of the galaxies hosting the bulges are brighter than , the limit of the CFRS (Lilly et al., 1995), while less than half (42%) of the full GSS-SRS in the same redshift range are so bright. Thus the bulge sample is weighted to more luminous galaxies at high redshift. As for the colors of the galaxies, we find a relatively clean demarcation at between galaxies nearly as red as local E-S0’s () and those with active star formation as seen in spirals or later-type galaxies. Fig. 3 shows the distribution of the high redshift full GSS-SRS sample where we clearly see a bimodal distribution with the red peak near . This bimodal color distribution can also be discerned in our GSS sample at lower redshifts (Im et al. 2002; GSS3) and in other redshift samples with high-precision colors (see e.g., Figs. 3 or 4 in the CNOC2 work by Lin et al. 1999; the 21-22 magnitude subpanel of Fig. 9 of Koo 1986; the SDSS sample studied by Strateva et al. 2001; the COMBO-17 sample studied by Bell et al. 2004). We find that while 164/211 (77%) of the full, high-redshift GSS-SRS galaxies have integral colors bluer than , only roughly half (46/86) of the photo-bulge sample is in this group (see Fig. 3).
Finally, for the half-light sizes of the galaxies, we find little evidence for any significant difference in the distribution between that found for the high redshift full GSS-SRS sample and the photo-bulge sample. However, when the surface brightness distributions are compared, we find that, while only 86/211 (40%) of the full, high-redshift GSS-SRS sample have average surface brightnesses within the half-light radius brighter than mag per square arcsec, about two-thirds (57 or 66%) of the photo-bulge sample qualify. Thus any biases against detection due to surface brightness are likely to be significantly less severe for the photo-bulge sample than for the full GSS-SRS sample.
Morphologies and Image Structure: The photo-bulge sample was defined using only a simple photo-bulge apparent luminosity cut ( of photo-bulge ) with no explicit attempt to restrict the sample by image structure. Although we have made no attempt to select early-type galaxies, such galaxies will be preferentially selected if they continue at high redshifts to possess more luminous bulges than later-type galaxies. Whether such early-types actually dominate the total sample depends on whether the multiple pre-merger or single predecessors of today’s early-type galaxies had early-type morphologies in our redshift range. Unless spirals with luminous bulges disappear at redshifts , we expect that our sample will also include some spirals. Indeed, we do have a significant number of apparent spirals in our sample (see Fig. 14), including some appearing to be of very late type (e.g, 094_2210), some even seen as very nearly edge-on (e.g., 064_4412, 094_7063), and some with multiple components or internal structures that resemble bars or arms (e.g., 064_4813, 163_4865), bright H II regions (e.g., 094_4767), interacting neighbors (e.g., 073_1809, 153_2422), or tidal features (e.g., 093_2327, 084_1138). Both 064_4412 and 094_2210 have well-traced disk emission, with kinematics and masses as expected for disk systems (Vogt et al., 1996). As discussed later, the presence of star-forming disks, presumably with significant gas and hence dust, may affect the apparent colors of any genuine bulges. But more importantly, such disks may have concentrated regions of active star formation that may masquerade as bulges in our two-component decomposition.
Based on a visual examination by one of us (SMF), a rough division into three groups yields the largest to be E-S0’s (35) and slightly fewer but roughly equal numbers among normal spirals (25) and the catch-all remaining class of peculiars, compacts, and mergers (26). The diversity of morphologies of the disks and galaxies hosting high-redshift, luminous bulges should serve as a cautionary flag that bulge formation and evolution may include diverse histories and physical processes.
3.2 Photo-Bulge to Total (pB/T) Distribution
Fig. 4 compares the distribution of pB/T in our sample versus a companion sample of GSS-SRS galaxies restricted to be in the same high redshift range but with total galaxy brightnesses chosen to be brighter than mag. The 192 GSS-SRS galaxies in this category show a peak at the pure photo-disk end in pB/T with a rapid drop at pB/T 0.1, followed by a more gradual decline towards the pure photo-bulge end. Our sample of 86 photo-bulges shows only 5 galaxies with pB/T , a peak near , followed by a decline towards the pure photo-bulge end that almost totally overlaps the full high redshift sample. The strong bias against low- pB/T systems in the bulge sample can be understood as the direct result of our choosing a brightness limit for the photo-bulge component. A further restriction to high redshift then forces the photo-bulge sample to be intrinsically luminous () and thus understandably results in few, if any, very low pB/T galaxies. For example, a system with pB/T must be accompanied by a very luminous disk () to be within our sample limits. Our selection of only luminous photo-bulges thus prevents us from placing strong constraints on the nature of lower luminosity bulges in late-type galaxies at high redshifts. We will compare the two observed pB/T distributions in Fig. 4 to model predictions in the discussion section.

3.3 Are Photo-Bulges Genuine Bulges?
As already discussed in Section 2.1, we have intentionally used the term photo-bulge and photo-disk throughout this work in order not to prejudge the nature of the subcomponents extracted by the GIM2D software package from the HST images. As warned by the developers of GIM2D (GSS2; Simard et al., 1999; Marleau & Simard, 1998), the use of a two-component decomposition does not assure that genuine bulges and disks are being extracted. In some cases, very blue central knots of active star formation reside in an otherwise normal late-type disk. These could conceivably be genuine bulges in formation, as envisioned by secular evolution theories. In other cases, GIM2D has chosen to fit the blue outer disk of a galaxy with the profile and the inner very red, true bulge with the exponential (more details of this effect are discussed in GSS2). Examples of such reversals of bulge and disk are noted in Appendix C and include objects 104_6432, 273_7619, 303_4538). In such cases, the photo-bulge might erroneously be regarded as a blue bulge. Another potential problem in identifying photo-bulges is that lower-luminosity bulges are observed locally to have light profiles closer to that of an exponential than an shape (Andredakis et al., 1995). If such bulges were once bright enough to enter our high redshift sample, they would be measured here as photo-disks and thus lost from our photo-bulge sample.
So, what is the nature of our photo-bulges? We find two major groups. From the full 86-object sample, the dominant one (69, or 80%) includes red (restframe ), high surface brightness ( 20 mag per square arcsec), luminous () photo-bulges. Most of these red and very-red photo-bulges (44/69, or 65%) are accompanied by red and very-red photo-disks and are likely counterparts of E-S0’s today, while others (25/69, or 35%) are accompanied by blue and very blue () disks of varying proportions and are thus likely counterparts of spiral bulges.
The minor (17, or 20%), but more intriguing, group is associated with blue and very-blue photo-bulges. Some are merely the result of misidentifying a blue disk as the photo-bulge component, as explained above. A few, such as 092_1339, appear to be blue bulges. But as indicated in the notes (Appendix C), this particular galaxy has strong emission lines with well measured velocity widths well under 100 , and therefore is not a probable progenitor of luminous bulges (which are expected to exhibit widths closer to 200 ). Most, however, appear to be blue central regions lying within disks. Several lines of evidence suggest that, unless stellar mass is added through future star formation, mergers, or infall, such blue subcomponents are not the progenitors of luminous bulges today:
1) Almost all of the bluest (16 of 17 with in the full 86 sample) have restframe -band surface brightnesses similar to or dimmer than that of bulges of comparable size today. We find this evidence alone to be compelling, since after their intense star formation activity subsides, the resultant fading by several magnitudes (depending on the fraction and size of an underlying older, red stellar population) will reduce their average half-light surface brightness to values below that seen among bulges today.
2) Their luminosities are fainter, rather than brighter, than most of the redder photo-bulges; thus, after fading and evolving to redder colors, they cannot be the counterparts of the luminous bulges of today. In principle they may become lower-luminosity bulges, but locally these are generally of smaller size and have profiles that are exponential rather than .
3) Roughly 80% of the blue photo-bulges reside in photo-disks that are more luminous than they are, i.e., pB/T . The theoretical expectation is that a blue, and thus forming, bulge would be so luminous that the bulge would dominate the total light, i.e., yield a high B/T ratio.
4) Many have very blue colors () that correspond to intense star formation. Since lifetimes are longer during the redder, fading phase than during the active starburst phase, an even larger proportion of bulges should have intermediate colors. We see a dearth of such bulges with intermediate colors.
5) Most (11/18, or 61%) of the photo-bulges with reside in redder disks, presumably of older age or with less active star formation. This bluer-core color gradient would not be expected in hierarchical formation scenarios for bulge formation, where the outer disks form after the central bulges, and should thus appear younger and bluer. Secular evolution models, however, propose that bulges form at the same time or after disks so that disks may then be expected to be older and thus redder. The blue bulge colors are then explained, but secular processes produce fainter bulges (e.g., MacArthur et al., 2003; Carollo, 2004), not luminous bulges such as we see in our sample.
Several of these points will be illustrated quantitatively in figures based on a smaller, higher-quality sample to be defined in the next section.
3.4 Selection of “Quality” Bulges
The primary selection criteria of the full bulge sample were deliberately chosen to be relatively simple, well defined, and able to yield a statistically complete sample. As previously mentioned, GIM2D is limited in this study to decomposing galaxies into two simple subcomponents, whereas galaxies clearly span a wide range of structural properties not necessarily well described by the adopted model. Before continuing with the presentation and analysis of the results, we have further refined the sample to what we consider to be of higher photometric quality and reliability by adopting two additional constraints:
a) We set the photo-bulge brightness limit to be a half magnitude brighter, . This reduces the total sample of 86 to 64 bulges with more reliable structural and photometric measurements.
b) We have limited photo-bulges to have half-light major-axis radii (effective radii) less than the half-light radius for an exponential disk, i.e., 1.7 times the scale length of the photo-disk unless pB/T is greater than 0.67 (from Table 3). This half-light radius restriction is aimed to exclude likely cases of reversed bulge-disk decomposition by GIM2D. It ensures that galaxies that are dominated by the photo-bulge (i.e., more luminous than twice the disk) are not unintentionally eliminated due to the presence (or apparent measurement) of very tiny, low-luminosity and thus poorly measured photo-disks. The resultant sample is now reduced to 52 bulges, with the excluded 13 photo-bulges roughly divided equally between blue () and red ().
The final “quality sample” has 52 photo-bulges that should be reliable and moderately well-measured bulge candidates. We find that only 4 (8%) are in the broader blue category () and all of them belong to the subcolor class of being very blue with (see Figures 5 and 6 and Table 4). Other divisions by pB, pD, and pB/T are also provided in Table 4.
3.5 Photo-Bulge Color-Magnitude Relation
Fig. 5 shows the color-magnitude relation for the quality photo-bulges, with 68% confidence error bars and symbols that indicate the colors of the disks. Very red photo-bulges span the entire range of accessible , while the bluest photo-bulges are seen among less luminous galaxies. Fig. 5 shows the color-magnitude relation for early-type galaxies in a rich cluster, MS 1054-03, at redshift (van Dokkum et al., 2000). This relation is almost identical to that found for local E-S0’s (Prugniel & Héraudeau, 1998; Jansen et al., 2000), both using integral colors.
The key new result is that red photo-bulges are nearly as red or redder than the integrated colors of either local E-S0’s or distant cluster galaxies (see also GSS9). Among the entire quality sample, only 8 photo-bulges are bluer than the cluster or local E-S0 color-magnitude line at more than twice the 68% confidence level (roughly 2). Thus 44/52, or 85%, have colors that are consistent with the very-red color-magnitude line.
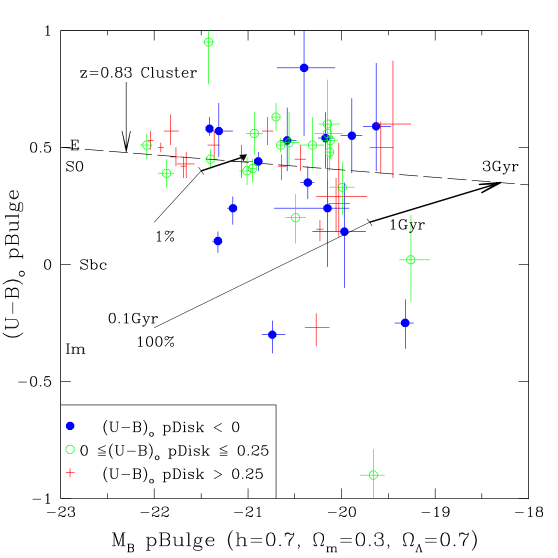
That the absolute colors of our sample of bulges with a median redshift of 0.81 (lookback time of 6.9 Gyr) are nearly the same as that of E-S0’s today, i.e. very red, is a surprise for which we have no simple, compelling explanation if only single-burst stellar populations are considered. For example, adopting a formation time at redshift (11.4 Gyr ago), Salpeter IMF, and solar metallicity, a burst of duration 10 Myr would have today and be bluer by about 0.2 mag at a lookback time of 7.7 Gyr at redshift (Bruzual & Charlot, 2003). Thus we expect to observe a concentration closer to , rather than 0.5 as observed. Lower redshifts of formation would result in larger color changes. Even with formation at the Big Bang, the color change would be 0.1 in ; coincidentally, the color at (7.7 Gyr) for a simple burst is close to the observed . We will return to this issue and explore other options in Sec. 5.5.
The second surprise is that the colors of the field photo-bulges appear as red or redder than the integrated colors of the cluster galaxies at similar . Part of the explanation may be that subcomponent bulges are on average redder than the integrated colors of galaxies, since galaxies may contain disks that are bluer on average than the bulges (cf. Fig. 8 below). Galaxies in rich clusters, however, are expected to have both bulge and disk components to be older than field galaxies, so that even if bulges are the oldest subcomponents of field galaxies, field bulges should still have bluer colors than the integrated colors of cluster galaxies at the same epoch.
Besides tracking the evolution of passively evolving populations, the color-luminosity diagram serves as an important probe of bulge formation itself. Fig. 5 shows how color and luminosity evolve for a single starburst and for a 1% starburst (by mass) embedded within an older stellar population. Any stronger starburst counterparts to luminous bulges or E-S0’s () would be expected to be even brighter by perhaps several magnitudes, and with very blue colors. Note, however, that the observed blue photo-bulges 1) are sometimes too blue to qualify as a minor (1% or less) starburst, 2) have luminosities too faint to become luminous bulges after fading, and 3) are unusual in that several reside in disks that are redder. We will later return to these and other clues that together suggest that blue photo-bulges are unlikely to be the starbursting precursors of normal luminous bulges.
Fig. 5 also shows that the red photo-bulges, regardless of their luminosity, reside within disks that span a wide range in color. The mere existence of very red disks at high redshift is another important finding, with implications for the formation of S0’s, the formation epoch of spirals, the relative formation epochs of disks and bulges, etc. We will return to this issue in the next subsection.
Besides absolute colors, two other useful measurements are the slope and intrinsic scatter of the color-magnitude relation. As seen in Fig. 5, the colors of distant photo-bulges largely track the slope seen among local E-S0’s and among early-type galaxies in the distant cluster at . A major uncertainty is that the slope among local bulges is not that well measured. Using colors from Prugniel & Héraudeau (1998) on early-type field galaxies, we obtain a change of -0.09 mag in per magnitude change in while the fits to RC3 by (Schweizer & Seitzer, 1992) yield a shallower value of -0.035. The steeper slope is also seen in the Coma cluster, which yields a slope of -0.08 (Terlevich et al., 1998). On the other hand, the color-magnitude slopes for red galaxies are shallow in both the distant cluster (slope of -0.032 shown in Fig. 5) and the distant field galaxies in the HDF-N studied by Kodama et al. (1999). The latter sample uses the early-type galaxies identified by Franceschini et al. (1998) via K-band surface brightness profiles.
A biweight statistical measure (Beers, Flynn, & Gebhardt, 1990) yields for our quality sample a slope of , where the errors are estimated via Monte-Carlo bootstrap. Restricting the quality sample to include only the very red photo-bulges yields a slope of . Except for being redder by 0.05 mag in , the resultant high redshift field bulge color-magnitude relation is closer to that found for early-type galaxies in the cluster at than to that for local bulges or E-S0’s.
An important diagnostic of the age spread of bulge formation is the intrinsic scatter of the data about the color-magnitude relation (e.g., Bower et al., 1992). For cluster galaxies at high redshifts , Stanford et al. (1998) and van Dokkum et al. (2000) both find small intrinsic scatter that supports a small age spread and an old age for the early-type cluster galaxies, though morphological or progenitor bias may artificially reduce the scatter (van Dokkum & Franx, 2001). Although our color measurement errors for the bulges are typically larger than that for the entire galaxy as measured in the cluster work, we can nevertheless place useful constraints. As seen by the proximity of the error bars in the color-magnitude to the cluster line, and confirmed by a robust estimate using the biweight statistical method (Beers, Flynn, & Gebhardt, 1990), we estimate the intrinsic color scatter to be mag at the 68% confidence level (CL), where the errors are estimated via Monte-Carlo bootstrap. This small scatter is consistent with the value of 0.03 found by van van Dokkum et al. (2000) for the cluster MS1054-03. We note that the morphological or progenitor bias discussed by van Dokkum & Franx (2001) does not apply to our sample (we include spirals), but that a similar type of bias may exist if the bluer progenitors of genuine bulges do not possess the same -profile.
We will now examine the relationship between the colors of photo-bulges and photo-disks.
3.6 pB/T Ratio vs. Colors of Photo-Bulges and Photo-Disks
Fig. 6 shows the photo-bulge to total ratio (pB/T) versus color of the photo-bulge, with different symbols indicating the colors of the photo-disks. The red clump of photo-bulges is found to span the full range of observed pB/T, while the blue photo-bulges are shifted to systematically lower pB/T systems. If blue photo-bulges are classic bulges seen during their active formation phase, we would expect instead to find that blue bulges have larger pB/T. Since no selections by color of the galaxy, color of its subcomponents, or pB/T ratios greater than 0.67 have been applied, blue bulges with high B/T ratios, if they are common, are not missing in our sample444If bulges in formation resemble point-source AGN’s, then our size cut may select against such objects. But only two objects were eliminated by this selection, and thus they represent at best a rare population (4%). If bulges during formation have exponential rather than light profiles, they may also be missing from our present sample.. Indeed, if bulges are passively evolving old populations that fade with time while disks are more constant in luminosity, we would also expect to find a higher proportion of large B/T systems at higher redshifts. Analysis beyond the scope of this work is needed to assess whether this is true, but we see no gross evidence for this in that the fraction of high pB/T systems (Fig. 4) in our distant galaxy sample is only about 25%, which is less than the roughly half of luminous galaxies being within the red portion of the bimodal distribution of colors seen among local galaxies (Strateva et al., 2001).
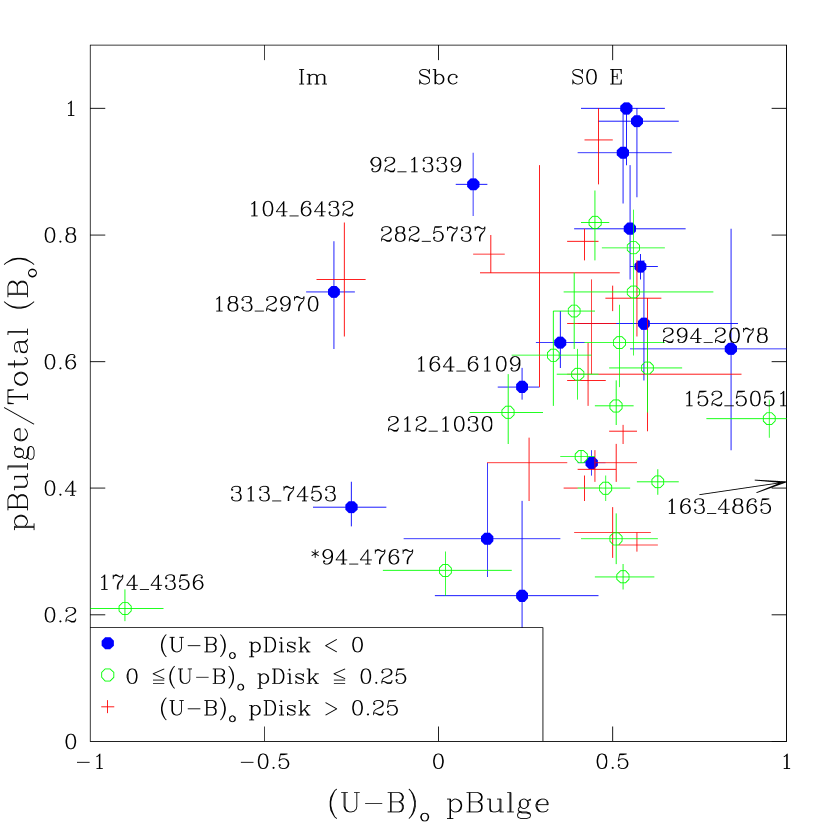
Another surprise in Fig. 6 is the lack of any strong correlation between the colors of the disks of the red photo-bulges and pB/T. Again, assuming that a bluer disk is at a brighter phase of its life, we might expect bluer disks to reside among smaller pB/T systems, but this is not seen. Moreover, bluer disks might also be associated with later Hubble types, which are roughly correlated with B/T ratio so that blue disk systems might be expected to dominate the low B/T regime. This may be true for a complete sample of galaxies but is not seen among the luminous, red, photo-bulge systems.
The picture that emerges from these findings and those from the previous subsection is one in which luminous bulges are universally old, even at redshifts , and that disks form around them at different epochs, with no strong correlation between the disk colors (i.e., age) and bulge to disk ratio. This result on disk colors and luminosities associatd with red photo-bulges serves as an important constraint on the nature and history of luminous bulges. As previously discussed, the lack of very low pB/T galaxies within our photo-bulge sample is a selection effect. Thus we cannot directly address the possibility that low-luminosity bulge systems have a different formation history.
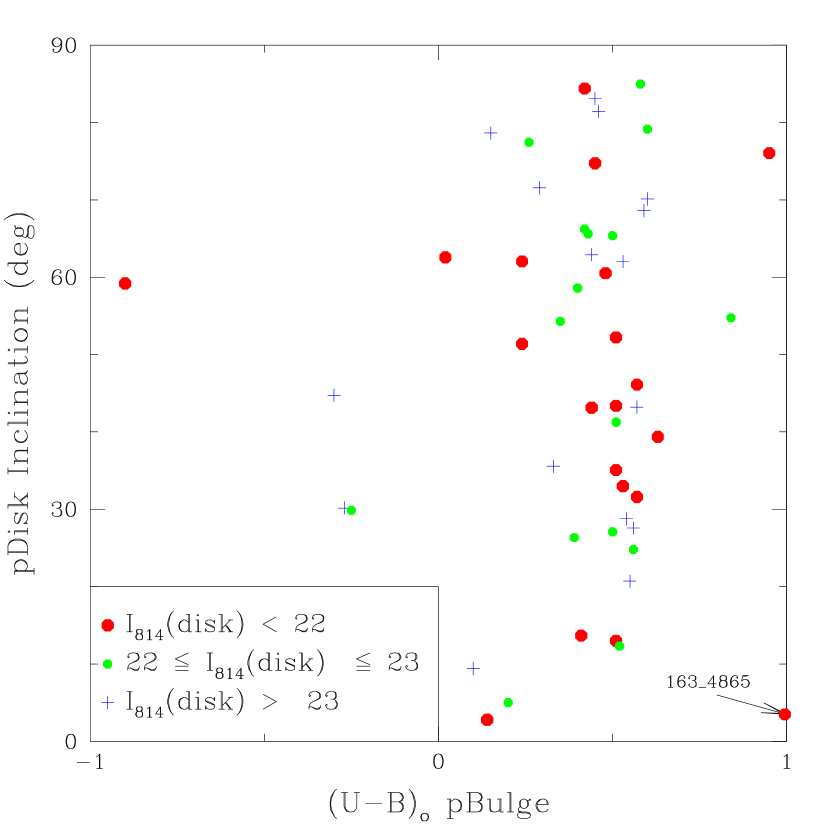
Fig. 7 shows the photo-disk inclination angle versus the color of the photo-bulges in the quality sample. Again we see little correlation. Since dust in high inclination disks might result in redder bulges, the lack of correlation implies that any such effect is not strong. Although a few photo-bulges might be affected by dust, e.g., GSS ID 152_5051 and 163_4865, the bulk of photo-bulges have such uniformly red colors that, if dust were the major cause, its effects must be nearly universal, i.e., it cannot vary much from galaxy to galaxy. The uniformity, independence of the amount of disk (pB/T), and independence of photo-disk inclination angle together suggest, but do not prove, that the very red colors of photo-bulges are not due to dust obscuration.
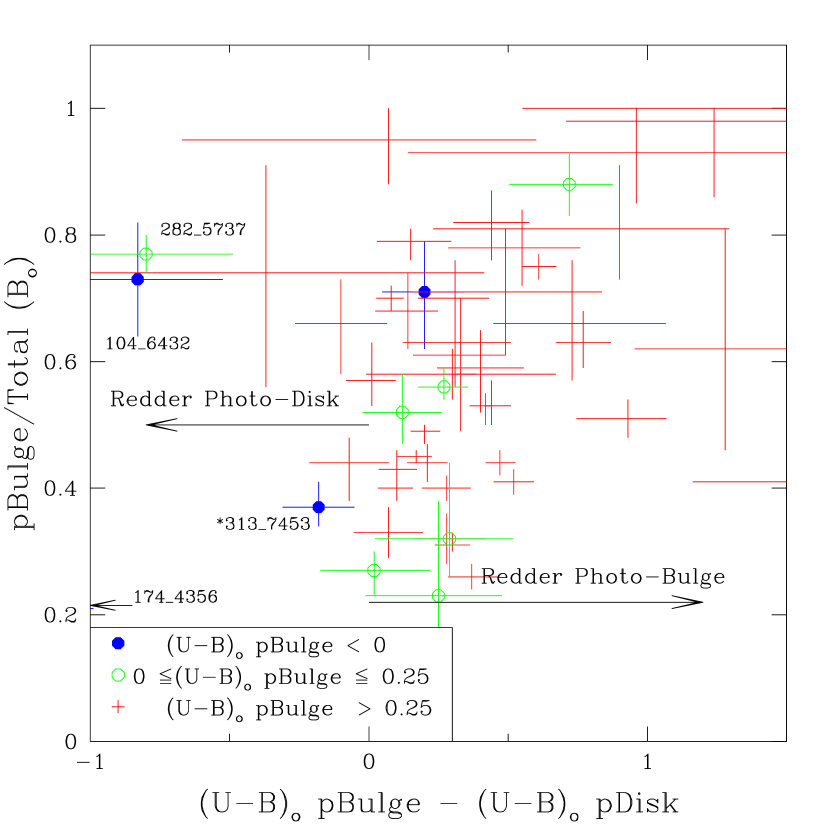
Fig. 8 shows pB/T versus the color difference between the photo-bulges and photo-disks, with different symbols now indicating the colors of the photo-bulges. Almost the whole sample is on the right hand side, where photo-bulges are redder than photo-disks. A particularly interesting example is 094_2210 (not in the quality sample), which possesses a very red central bulge-like component that is imbedded within a surrounding very-blue, disk-like component that appears to be comprised of multiple blobs. The structure might be a disk in its early formation phase, as originally suggested by Koo et al. (1996). On the other hand, while the red photo-bulges reside with photo-disks of similar or bluer colors, three of the four blue photo-bulges reside in redder photo-disks.
Figures 6 and 8 also show that some galaxies have quite red disks with colors close to that of bulges. Such disks are important, for, if not due to reddening by dust, they imply that at least some disks were already quite old at redshifts . Given claims that S0’s are virtually absent in clusters of galaxies before redshift (e.g., Dressler et al., 1997; Fasano et al., 2000), the existence, numbers, and environments of field S0’s whose disks and bulges are both red at even higher redshifts place important constraints on plausible formation mechanisms.
In this regard, we note with interest that the most luminous galaxy in our entire spectroscopic sample with between 0.73 and 1.04 (274_5920) has a pB/T 0.5, i.e., equal light in the photo-bulge and photo-disk components. Visually, the galaxy appears to be an ordinary elliptical galaxy. The photo-disk in 274_5920 is also the most luminous photo-disk in the entire high redshift sample of 205 galaxies, and it is very red ()555The second most luminous galaxy is the quad-lens system 093_2470, which also has pB/T 0.5, but its disk has colors close to that of Sbc galaxies ().. We thus find that the most luminous galaxy, photo-bulge, and photo-disk in our current sample are all very red. Our sample is presently too sparse to place good constraints on the volume density of such very-red, bulge-disk systems (likely S0’s), but if photo-disks are genuine disks, their mere existence is compelling evidence that very old disk systems (some very massive with in the disk alone) did exist side by side with very old bulges in the field by redshift . Such massive, old field disks are likely to be difficult to accommodate in current versions of semi-analytic models.
The quality sample includes 16 (31%) such galaxies with photo-bulges and photo-disks that are both very red and they are found to span the full range of luminosities, , and disk inclination angles. Such systems provide a unique sample to test for the possible presence of residual star formation among ellipticals and bulges of S0’s and spirals with apparently old stellar populations, without the confusion or ambiguity of emission lines arising from star-forming blue disks. Intriguingly, we do find emission lines even in these galaxies which are red in both components. In fact, while over 60% of these red photo-bulge and photo-disk systems show emission lines on average, among the ten most luminous galaxies, we detect emission lines from all but two, these being the most luminous (274_5920) and third most luminous (064_3021). The remaining eight 666brightest first: 074_6044, 062_2060, 094_2660, 103_7221, 203_4339, 113_3311, 103_2074, 283_6152, or 80%, all show emission lines of O II. The exact location (bulge, disk, halo, etc.) and nature of these emission lines remain uncertain, but their high frequency is a hint that star formation may be common within distant galaxies, even those that appear quiescent by having very red colors overall and separately in their photo-bulge and photo-disk subcomponents. This last qualification is needed to avoid seeing emission from bluer disks with active star formation. Several galaxies show relatively broad lines (but much narrower than from typical AGN’s), ranging from 100 for, e.g., 113_3311, 150 for 062_2060, to around 200 for 103_2074 and 094_2660, as might be expected for gas well-mixed within a deep potential well. Indeed, these emission line values match well the absorption line velocity dispersions measured for the same galaxies in GSS9.
A rough estimate of the average star formation rate for these ten luminous galaxies is about 0.5 to 1.5 M⊙ yr-1 per 1010M⊙ of stars777O II luminosities were derived using the formula: log L(O II) = 31.97 - 0.4 M3727 + logEW(O II), where EW(O II) is the restframe equivalent width of the O II emission line as given in Appendix C for each of the eight galaxies; an estimate of the continuum luminosity at O II in AB magnitudes, M3727 = MB + 0.9() + 0.628 ; MB and are for the galaxy from Table 3; and the conversion from L(O II) to SFR adopted the relation of SFR(M⊙/yr) = 7.9x10-42 L(H) from Kennicutt (1998) and L(O II) 0.4 L(H) from the luminous portion of Fig. 1 of Jansen, Franx, & Fabricant (2001). The mass of stars assumes the stellar populations are on average 1.5 mag brighter at the observed redshifts and the local M/LB = 4.. The lower rate assumes the gas has low sub-solar metallicity, while the higher value assumes the solar to super-solar metallicity of luminous galaxies, with no additional corrections for extinction. Even the low rate translates to significant mass accumulation – roughly 5% per Gyr or a significant fraction of the entire galaxy after only a few Gyr. As discussed later, a total fraction of merely 4% new stars, i.e., on average only a fraction of a percent per Gyr, is needed to explain constant colors. These two estimates of accumulated new stars can be reconciled by adding a large fraction of the new stars to the disk rather than the bulge.
Regardless of the exact level of star formation activity, such star formation among almost all very red, luminous, fading, stellar populations is an important clue that virtually all field galaxies probably experienced continual or episodic infusion of small amounts of star formation at high redshifts. This picture is qualitatively consistent with hierarchical growth of galaxy via merging and provides some additional support for a scenario, proposed later, to explain the constancy of the very red colors of bulges from redshifts to today while the galaxies are undergoing 1 to 2 mag of fading due to passive evolution of the bulk of their old stars.
3.7 Photo-Bulge Size-Luminosity Relation
Fig. 9 shows the sizes of photo-bulge effective radii (kpc) vs. photo-bulge luminosity (), with different symbols indicating the colors of the photo-bulges. Besides the quality sample of 52 galaxies, the figure includes the 12 additional photo-bulges (total 64) that meet the brightness limit of for the quality sample, but do not meet the criterion of the relative sizes of the photo-bulges and photo-disks. These 12 were excluded from the quality sample to improve the reliability of the photo-bulge sample and color measurements but have been added back in here to avoid a strong selection by size. The solid lines are the mean relations found for local bulges (Andredakis et al., 1995; Baggett et al., 1998; Bender et al., 1992), all showing a tilt towards higher surface brightness for lower-luminosity bulges. The dashed line is one of constant surface brightness. The distant photo-bulges are found to have a correlation, albeit with large scatter, that roughly follows the slopes of the local relations, but with a shift to higher surface brightnesses. If reliable, the formal error bars imply that the large scatter is not primarily due to data quality errors, but instead appears to be intrinsic to the photo-bulge sample. When separated by color, the bluer photo-bulges (closed and open circles) lie towards the upper right, lower-surface-brightness portion of the data distribution. After any significant fading, these photo-bulges will lie well away from any of the local relations for bulges. This result, based on the brightest 64 photo-bulges, is only strengthened when the entire 86 photo-bulge sample is examined. This conclusion, that blue photo-bulges are actually of similar to or lower surface brightness than local bulges of similar size, is perhaps the strongest and most direct evidence against their being genuine, pre-faded, young massive bulges undergoing active star formation.
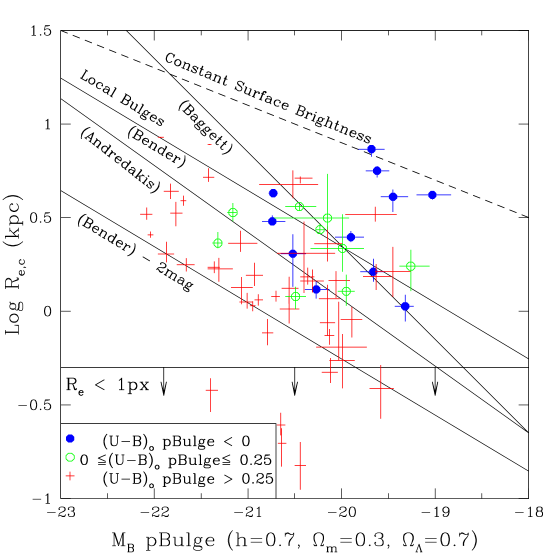
If we assume that bulges maintain stable structures since , i.e., with no size evolution, we can use the average change in surface brightness from the local relation as an estimate of any luminosity evolution. Unfortunately, neither the slope nor the zero-point of the local size-luminosity relation for bulges proves to be well defined. For example, using the 17 bulge sample of Bender et al. (1992), we find a fit close to log , which is shown as one of the solid lines in Fig. 9. The dispersion of the local data around this relation is roughly mag at log . Restricting our sample to just the 38 very red photo-bulges and locking the slope to -3.33, we find the median offset to be -1.22 mag, i.e., log . Using a slighter steeper slope of -2.8 as suggested by the work of Andredakis et al. (1995) (who derive a fit of log ) yields an intercept close to the previous one of -20.37, but adopting a local intercept of -19.82 then gives only a 0.55 mag offset, which is less than half the estimate when compared to the Bender et al. (1992) sample. Finally, as another independent check, we have compared our data to that from Baggett et al. (1998). To keep the measurements to the same plus an exponential disk, we excluded all fits that required an inner truncation radius. To allow conversion to and avoid the uncertainties due to differences in the colors of the bulges and disks, we included only galaxies which were on average quite red, with and which had T types earlier than 5. To avoid problems with the Hubble flow, we used only galaxies beyond 20 Mpc. Finally, to use only data with good fits, we included measurements with the . This reduced the sample of 620 objects to 94, yielding the fit log . Adopting this steep slope, our sample yielded an intercept of -20.42, implying a luminosity brightening of 1.12 mag.
In summary, by comparing the size-luminosity relation of our distant sample to local bulges, we find strong evidence for luminosity evolution. The best estimate of the brightening is probably between 1.1 to 1.2 mag when using the Bender et al. or Baggett et al. samples, but may be as low as 0.55 mag if we adopt instead the Andredakis et al. sample. We searched for, but did not see, any systematic trend with redshift and so our estimates of luminosity evolution apply on average to the full sample.
3.8 Very-Red Bulge Luminosity Density
Having derived the selection function and weights, we can, in principle, derive the luminosity function of bulges. Our sample is, however, too small for reliable results and is also subject to significant fluctuations from large-scale structure. But given the importance of the luminosity function evolution of bulges in our understanding of galaxy formation and the role of bulges in hosting AGN’s (Gebhardt et al., 2000), we have obtained instead a related but more robust measure of the integrated luminosity density.
Since the very-red photo-bulges are most likely to be genuine bulges, we restrict this analysis to the 58 very-red ones from the full sample of 86. To our depth of , we reach bulges as faint as at . We adopt the method, even though our data clearly show that the redshift distribution is not uniform. This simple exercise yields an averaged luminosity density in of Mpc-3 to our observed depth. The formal errors of 6% based on 500 Monte-Carlo bootstrap resamplings do not reflect cosmic scatter due to large scale clustering, which we estimate to be roughly 25% (Im et al., 2002). Note that our luminosity density includes the light at redshifts from only very-red bulges, i.e. no photo-disks, even red ones or those that physically belong to the bulge population but happen to be excluded because they do not have light profiles.
The luminosity density in is measured to be 7.0 Mpc-3 for very-red, high-redshift bulges. This is 36% of the luminosity density of 19.6 Mpc-3, as measured from the light of the whole galaxy for the full GSS high-redshift sample (Willmer et al., 2004). A recent local estimate of the total luminosity density by Liske et al. (2003) is 13.9 Mpc or roughly 70% of that observed at high redshift by Willmer et al. (2004). Thus galaxies, when added together, were brighter in the past. A recent estimate for local bulges 888We used and converted from to assuming disks have the colors of Scd galaxies and bulges have S0 colors from Fukugita et al. (1995) is 0.4 Mpc-3 (Benson, Frenk, & Sharples, 2002). This is over 10 less than what we find at redshift and only 3% of the local total from Liske et al. (2003).
We suspect the Benson et al. (2002) value to be too low, since prior estimates of the bulge fraction in (converted from ) range from about 25% from Schechter & Dressler (1987) to about 39% as estimated by Fukugita et al. (1998). This range for local galaxies is supported by a more recent estimate from the SDSS of 30% in the and (Tasca & White, 2003). Their method also decomposes each galaxy into a bulge and disk component. In summary, the bulge luminosities of both the local and our distant samples are presently quite uncertain. We find that roughly a third of the total luminosity density of distant luminous galaxies reside in bulges, comparable to some local estimates. Larger samples are needed before we can have a reliable check of the recent claim for a factor of two buildup of the integrated stellar mass in spheroidal galaxies as a whole by Bell et al. (2004).
3.9 Visual Morphologies of the Quality Sample
The visual morphologies of the galaxies that belong to the very-red, quality sample of 41 photo-bulges appear overwhelmingly normal, with only three objects (84_1138, 93_2327, and 94_6234) showing low surface brightness features or very close neighbors suggestive of interactions and mergers (see Fig.14). In contrast, 7 of the remaining 11 bluer (i.e., not very-red with ) photo-bulges show visual morphologies that are unusual, by having double nuclei, distortions, or very close neighbors that are suggestive of interactions and mergers. Such complex morphological structures will affect our color measurements from GIM2D at some level, but probably more those of the of the larger and more distorted photo-disks than the more centrally concentrated photo-bulges. A more detailed study from a much larger sample will be needed to assess the impact of this correlation between morphology and color on the colors of photo-bulges. The key result from this work is that our sample suggests a high correlation between the colors of photo-bulges and whether they belong to galaxies that have unusual morphologies: less than 10% of the very red photo-bulge sample show such morphologies while the remaining bluer sample is dominated (64%) by them.
4 COMPARISON TO PREVIOUS WORK
4.1 Summary of Key Results
We emphasize again that we have a statistically complete, magnitude-limited sample of high-redshift, luminous, -profile bulges that should include bonafide ellipticals, bulges of S0’s, and bulges of spirals. We caution the reader that our selection and structure-extraction procedures may, however, also contaminate the sample with non-bulges such as nuclear/central star-forming regions of late-type galaxies or any subcomponent that is not well fit simply by an exponential with one scale length.
Before proceeding, we summarize the key results found in the previous section:
1) The vast fraction (over 80%) of luminous field photo-bulges at redshifts are very red, independent of the observed B/T, disk color, and disk inclination. Almost all reside in morphologically normal early-type galaxy or spiral. Moreover, the color-magnitude ( vs. ) relation is similar to that of bulges today with a shallow slope and small scatter. The bulge size-luminosity relation indicates about 1 mag of fading since .
2) The small remaining fraction of blue photo-bulges, compared to the dominant very red photo-bulges, have on average lower surface brightnesses, lower luminosities, and redder photo-disk colors that argue against most of them being genuine proto-bulges. Many appear to reside in morphologically peculiar galaxies.
4.2 Comparison to Prior Studies
We divide the following discussion into three high redshift groups: ellipticals (diskless bulges); early-type galaxies (E-S0’s); and spiral bulges. Since several of our conclusions differ from those of other studies, we start by summarizing the major advantages of our survey. First, our survey sample size is substantial, with 86 objects at high redshifts (), while some other surveys have fewer than five objects. Second, we try to separate the bulge colors from disk colors using 2-D decomposition. In contrast, others use integrated colors and assume their galaxies are disk-free ellipticals or use small central aperture colors and assume that disk contamination is negligible. Third, our sample is spectroscopically confirmed. The spectra provide more reliable redshifts than photometric redshifts and other useful diagnostics such as star formation rates and internal kinematics.
4.2.1 Integrated Colors of Distant Field Ellipticals
Schade et al. (1999) studied the properties of 46 field ellipticals at redshifts and found much bluer colors at higher redshift. Besides a brightening of 0.97 mag by , they also find strong [O II]3727 emission lines in roughly one third of these ellipticals.
While we agree with the last two conclusions, we disagree with the first. To track the differences in more detail, we have examined the 7 galaxies in common between our two surveys (as indicated by comment “c” in the Notes column of Table 1 ).
Overall, we find good agreement in magnitudes, but relatively poor agreement on whether B/T is indeed indistinguishable from 1, i.e., pure or elliptical by the Schade et al. definition, namely, galaxies that are well described by light profiles as derived from 2-D surface photometry of images from HST. Our pB/T values for 6 galaxies lie more than 7x the 68% confidence limits (i.e., roughly 7 for Gaussian error distributions) away from pB/T = 1. When systematic errors are taken into account (see section 2.1), these galaxies are even less likely to have B/T = 1999The object closest to a pure profile is 092_1339, which has a pB/T value of 0.85 and 68% confidence limits of 0.03; this galaxy, however, is also the best candidate for being a blue bulge, and, as detailed in Appendix C and Im et al. (2001), this galaxy has strong emission lines that have a small velocity width () of only 85 . It is thus unlikely to be a genuine, young, massive E-S0..
Why the difference? To identify ellipticals, Schade et al. (1999) use visual inspections of the fits to the galaxy profiles in the HST image. Based on our own tests, we find that this procedure can be deceptive for two reasons. First, exponential components (photo-disks) can easily hide as merely slight systematic deviations from an fit, not easily discernible by eye, but whose statistical significance is strongly supported. Second, we find our image, not used by Schade et al. (1999), to be an important additional and independent source of information to confirm the presence of a disk, especially those that are blue. The uncertainty of their identifications is confirmed by their own visual classifications, which sometimes assign Sab or later types to their sample. Thus, while we can understand how Schade et al. (1999) might be deceived into believing their sample consists of pure ellipticals, we believe that our measurements of pB/T with error bars show that such galaxies are actually relatively scarce (5/52, or 10%).
Besides finding poor agreement on type, we also find poor agreement on the integrated colors of the galaxies. For example, Schade et al. (1999) find that none of the 7 in common with our sample has total galaxy colors matching those of unevolved early-type galaxies (i.e., redder than Sab, or ). We find three that do (062_2060, 062_6859, and 064_3021). Except for 092_1339 mentioned in the previous footnote, the remaining 6 all have very red photo-bulges, while Schade et al. (1999) claim that they are all blue, pure ellipticals.
To explain the large differences of colors, we suspect field-to-field zero-point differences in the Schade et al. (1999) colors. Among the 19 high redshift () galaxies in their sample, over half (10) are in the GSS and yet none have colors redder than (), roughly the average color of an Sab galaxy. Of the remaining 9 high redshift ellipticals outside of GSS and in the other three fields in the Schade et al. sample, 6 have very red colors (). Without any variations in the color zero-points, the probability of finding by chance that none of the 6 reddest objects are among 10 from a sample of 19 is about 0.3%. In contrast to Schade et al. (1999), we find many very red galaxies () in GSS.
In comparing the two surveys, note that our measurements are of high precision with reliable zero-points (HST and ) and that we have derived colors for the bulge and disk separately. In comparison, Schade et al. (1999) used ground-based photometry in and for their colors (but HST for the elliptical identifications) and assumed that their ellipticals are diskless. Thus when a bluer disk is present, Schade et al. would conclude that they had found a blue elliptical, i.e., blue integrated colors, while we might find instead that the bulge is indeed very red, but the disk is blue. Two good examples of such objects are 84_1138 and 93_3251 (compare colors of the whole galaxy to that of the photo-bulge and photo-disk in Tables 1-3).
In summary, we agree with Schade et al. (1999) that early-type galaxies exhibit luminosity evolution at the mag level, along with the frequent presence of [O II] emission lines. The work of Im et al. (2002) (GSS10) also agrees with the claim by Schade et al. (1999) for little volume density change of early-type galaxies since redshifts . But we question the claim for evolution towards much bluer colors among ellipticals at high redshift, since 1) their sample appears to include galaxies that are not pure ellipticals and 2) their colors are measured to be too blue, perhaps due to photometric zero-point problems, at least in the GSS, and to the use of integrated colors for objects that may contain blue disks.
4.2.2 Internal Color Dispersions of Bulges
(Abraham et al., 1999) undertook two studies in the Hubble Deep Field (HDF-N) directly related to this work, one on the uniformity of the star formation history of 11 E-S0’s and another on the relative ages of the bulges and disks of 13 spirals (discussed in the next subsection), all with redshifts . These samples were taken from the Bouwens, Cayón & Silk (1997) sample of galaxies with and with spectroscopic redshifts. The morphologies of Bouwens et al. (1997) were replaced by a visual reclassification by one of the co-authors.
In the first study, the inferred ages of the stellar populations in each pixel were derived from the 4-band photometry available in the HDF-N. The dispersion or distribution of these pixel-ages were then used to divide the E-S0’s into those which did and did not have 5% or more of the pixels with ages younger than the most recent third of the age of the oldest pixel.
Five of the 11 E-S0’s are in the same high redshift regime as our sample, with 3 (2 E’s and one S0) showing largely old coeval stellar populations while 2 (both E’s) show evidence for younger populations. This would suggest that 40% of the high redshift E-S0’s have a young component.
In a follow-up study, Menanteau et al. (2001) studied 79 field E-S0’s (24 with spectroscopic redshifts) to and made a comparison to galaxies to in five distant clusters analyzed in the same manner. They claim to “provide strong evidence for the continued formation of field E-S0’s over .” This was based on finding “that a remarkably large fraction ( 30%) of the morphologically-classified E-S0’s with show strong variations in internal colour, which we take as evidence for recent episodes of star-formation,” with most showing bluer cores. They find significantly smaller color dispersions in the cluster galaxy sample and estimate from modeling the star formation history “that at about half the field E-S0’s must be undergoing recent episodes of star-formation.”
A direct comparison to our luminous bulge sample is not straighforward, since we have not made any morphological classifications. GSS10, however, identifies 18 galaxies in the present paper as being E-S0’s on the basis of actual measurements of high pB/T and low levels of asymmetries (see Table 1, comment f). Of these, only 092_1339 and 294_2078, or 11%, have blue total colors (see column 8 of Table 3) while the remaining are all very red by our criterion of . The fraction of blue early-type galaxies among these 18 may actually be lower to only 6%, since 294_2078 appears visually to be a spiral (see Fig. 14) with a very blue disk; shows a rotation curve in its spectrum (Im et al., 2001); and most importantly, possesses a central, very-red bulge (see Fig. 14 and Table 3).
As previously noted, our photo-bulges are as red as local E-S0’s or the early-type cluster galaxies at . Since nearly all photo-disks are bluer than photo-bulges, the integrated galaxy colors are usually bluer than that of photo-bulges. For the 18 galaxies identified by Im et al. (2002) as early-type, the median color of the photo-bulges is , while the median for the total colors of these same galaxies is (the two values differ at more than the 95% confidence limit when the errors on the median values are accounted for). Compared to for early-type galaxies in the cluster (van Dokkum et al., 2000), we find that the field early-type galaxies are indeed bluer in , by . This result is expected in scenarios where early-type galaxies in clusters formed earlier than those in the field. Whether the bulges of cluster galaxies are also redder than that of field galaxies needs to be checked (Koo et al. , in preparation).
In summary, we find 2/18 (11%) early-type galaxies to have blue overall colors, and only one of these (6%) has a blue bulge. These fractions are smaller than the 30% to 50% fractions of blue E-S0’s claimed by Menanteau et al. (2001) and others (e.g., Franceschini et al., 1998; Abraham et al., 1999; Stanford et al., 2004). While the 50% fraction can be excluded by our sample of 18 at the 99% confidence limit, the disagreement is only at the 90% confidence limit for the 30% figure. A larger sample is needed to improve these statistics.
4.2.3 Bulge Colors in Distant Spirals
In the second study by Abraham et al. (1999) of 13 field spirals, bulges and disks were defined by the light within and outside, respectively, an aperture of 1 arcsec (10 pixels) diameter. Deriving ages from colors, Abraham et al. (1999) find that 8 out of 9 normal spirals have bulges that are older than the disks, and thus they conclude that “for morphologically normal systems, bulges are indeed always the oldest parts of galaxies.” They note that even the oldest bulges do not appear to be as “uniformly red and old as the oldest ellipticals” in the first study. Only two of these spirals are in the high redshift range of our sample. In contrast, among the 4 peculiar systems, only one has an older bulge, and two have clearly younger bulges. All of these are at redshifts lower than the range in this paper.
In a follow-up study, Ellis, Abraham, & Dickinson (2001) compared the colors of the bulges of 95 spirals to the integral colors of 60 early-type galaxies using data from HDF-N and HDF-S. Most of the sample relies on photometric redshifts, with only 20 in the sample having spectroscopic redshifts that overlap our high-redshift range. The bulge colors for galaxies down to integrated were estimated from aperture photometry within the inner 5% radius using colors from WFPC2 and colors from NICMOS.
Our results are fully consistent with theirs that central (bulge) colors are generally redder than the outer disks (see Fig.8). However, our results disagree with their second conclusion “that bulges are, statistically, optically bluer than the reddest ellipticals and show a large dispersion in their rest-frame colors.” Note that the Ellis et al. sample is selected by total galaxy luminosities rather than by the luminosities of the bulges as in our study. We speculate that the differences between our study and those of Abraham et al. and Ellis et al. can be understood as the result of the following factors: 1) our survey is restricted to very luminous bulges while theirs includes galaxies with very low luminosity bulges; such low luminosity bulges are expected to be bluer than luminous ellipticals; 2) their bulge measurements have contamination of central aperture colors by bluer disks; and 3) their visually-selected bulges are sometimes misclassified and are instead central, star-forming regions of late-type galaxies.
4.2.4 Summary of Comparisons to Other Surveys
No other survey of high redshift galaxies has separated the bulge from the disk for studies of colors, sizes, and luminosities. The closest in spirit are the (Abraham et al., 1999) and Ellis et al. (2001) studies of the bulges of spirals using a small central aperture to derive colors; they find the disks are generally bluer than the bulge. We agree. They also find, however, a large dispersion in the colors of the bulges and that they are bluer than the integrated color of the reddest cluster ellipticals. Here we disagree. The vast majority of the bulges in our sample (85%) are very red and are not detectably bluer than even the integrated colors of local E-S0’s. Although we also find a few blue bulges, their surface brightnesses are too low to qualify them as precursors or pre-faded counterparts of small, high surface brightness, redder bulges. As discussed previously, the differing results may reflect the choice of samples. Ours is confined to luminous bulges while others may have included fainter bulges whose colors may be bluer, or which may be confused with very bright central star formation complexes in spirals and irregulars.
Another major issue is the fraction of blue E-S0’s (not bulges) at high redshift. A key difficulty is the definition of E-S0’s (especially if selected by eye) and the level of sample contamination by bluer spirals and AGN’s. Those studies based on the small handful of spectroscopically confirmed high-redshift E-S0’s in HDF-N (Franceschini et al., 1998; Kodama et al., 1999; Tamura et al., 2000; van Dokkum & Ellis, 2003) include a known AGN and radio source 101010Hdf2-251.0 with redshift located at J2000 12:36:46.3 +62:14:05.7; see Phillips et al. 1997 for spectroscopic confirmation of AGN nature as well as a galaxy with a very small B/T ratio (0.17) and highly distorted residuals111111Hdf4-565.0 with redshift located at J2000 12:36:43.6 +62:12:18.3; see Fig. 1 at and in Marleau & Simard 1998 . Overall, the bulk of published works claim high blue fractions between 30% at moderate redshifts to 50% by redshift . An exception to such claims comes from the work of Im et al. (2002). Indeed, when we adopt the same definition of E-S0’s using B/T and asymmetry, we find 18 E-S0 candidates in the present sample, but only 2, or 11% are blue, and of these, one is a spiral and one is anomalous (Im et al., 2001). On the other hand, we do confirm the claim by Schade et al. (1999) for the frequent presence of emission lines, a finding that supports scenarios that include continued star formation in otherwise quiescent galaxies via infall or mergers, albeit at a low level.
5 Models of Elliptical and Bulge Formation
5.1 Introduction
Three major classes of bulge formation mechanisms have been proposed over the years, ranging from 1) the monolithic formation models of Eggen, Lynden-Bell, & Sandage (1962); 2) major mergers of disks into ellipticals (Toomre & Toomre, 1972) or mass accretion of dwarf satellites into a bulge; and 3) secular dynamical evolution models where instabilities, resonances, and dynamical interactions among disk, halo, and bars contribute to the formation of bulges (see reviews by Wyse et al., 1997; Combes, 2000; Carollo, 2004). Within the dominant paradigm of hierarchical formation of galaxies, each of these mechanisms is likely to play some role. As the reviewers emphasize, bulge formation is unlikely to be a simple, homogeneous process. To decipher the relative importance of these and other mechanisms of bulge formation, observers need to measure the mass function of bulges, their stellar populations (ages, colors, and metallicity distribution), all as a function of time or redshift as well as of environment. Theorists need to make realistic simulations that can be compared to the observations. We are today far from reaching either ideal.
A comprehensive discussion of models and theories of bulge formation is beyond the scope of this work. We will instead focus on comparing our new data to a subset of models that make explicit predictions of the luminosities, disk and bulge colors, and B/T of field galaxies at large lookback times. This comparison is strongly motivated by the lack of discrimination among different models when comparisons were made with high redshift data that existed a few years back (Bouwens et al., 1999). Our sample has substantially improved the available data and the following demonstrates the high level of discrimination now possible. An important caveat is that our data apply only to luminous ellipticals and the bulges of other galaxies in the field at high redshifts.
5.2 Analytic Models of Bouwens et al.
We compare our observations to a modified version of the analytic bulge-formation models originally presented by Bouwens et al. (1999). These models adopted various analytic prescriptions for the formation epochs and evolution of bulges and disks and translated these into predicted luminosities, colors, and B/T. The modifications are introduced to better match the properties of the high-redshift disks observed in the DEEP survey and to incorporate the influence of dust.
Bouwens et al. (1999) did not correct disk properties for inclination though they noted that inclination-dependent biases could be important in reconciling the results of the Peletier & Balcells (1996) sample with that from the de Jong (1996a) sample. Here we use the Tully & Fouqué (1985) prescription to make corrections to the luminosity and color of the disks as a function of inclination. To improve the fits to the local and redshifted disk colors, we increased the total opacity given by this prescription by 30%. We assume the Bouchet et al. (1985) extinction curve, where . For local comparisons, we correct the disk and luminosities of the Peletier & Balcells (1996) sample (composed of edge-on galaxies with inclinations greater than 50 deg) and of the de Jong (1996a) sample (composed of face-on galaxies with inclinations less than 51 deg) to reflect an average inclination of 34 deg.
Unlike the previous work by Bouwens et al. (1999), we assume that disks form when 50% of their final halo mass is assembled; that and ; and that the fiducial mass of all disks is , independent of their luminosity (this ignores the mass dependence of the halo formation). In modelling the disks, we adopt a Hubble parameter ratio of instead of the used in the original models.
Another modification is that we assume a distribution of e-folding times for the disk star formation rates instead of adopting a single value as in Bouwens et al. (1999). We here assume 5% of disks to have a 7 shorter e-folding time than adopted by Bouwens et al. (1999); 5% with 4 shorter; 20% with 2.5 shorter; 20% with 1.7 shorter; and 20% with 1.5 longer e-folding times. We set these values by attempting to fit both the and disk color distributions simultaneously.
5.3 Semi-Analytic Models
Unlike the Bouwens et al. (1999) approach, in which the formation epochs of the disks and bulges are manually adjusted to match local observations, several other groups have instead adopted the results of N-body simulations or the Press-Schechter formalism to model the formation of structure over time. As reviewed by each of three major groups working with this semi-analytic model (SAM) approach (Kauffmann et al., 1999; Somerville et al., 1999; Cole et al., 2000), SAMs follow the merging evolution of dark matter halos and, via constraints from local galaxy properties, adjust a set of relatively simple parameters that relate mainly to star formation, gas cooling, satellite mergers, and supernovae feedback. After adding stellar populations, and as described in the reviews, the SAM approach from all three groups has enjoyed a number of successes. These include matching the fraction of early-type galaxies to spirals; the luminosity functions of local galaxies from the optical to near-infrared; the Tully-Fisher relation; the amounts of neutral hydrogen in different galaxy types; and the sizes of galaxies and their subcomponents.
We will concentrate here on the general trends to be expected from SAMs regarding the relative ages (colors) of bulges in clusters versus field galaxies and among bulges, ellipticals, and S0 galaxies. As previously claimed (Kauffmann, 1996; Baugh et al., 1996), hierarchical models predict that the mean stellar ages in field ellipticals should be several Gyr younger than cluster ellipticals. Moreover, since disks take additional time to initiate and grow after the formation of their central bulges from an earlier strong merger event, bulges in higher B/T systems should be younger than those in lower B/T systems. Thus bulges in late-type spirals with lower B/T are predicted to be older and thus redder than the bulges of early-type spirals with higher B/T. As seen in Fig. 6 in the work by Ellis et al. (2001), the color-magnitude relation from the unpublished CDM SAM predictions of Baugh et al. (1996) predict that at our redshifts of interest (), spiral bulges should be redder by 0.1 to 0.2 mag in than ellipticals, which in turn are redder or older on average than entire S0’s by about 0.3-0.4 mag in . The S0’s are bluer than ellipticals presumably because their colors include the light from not only an elliptical-like old bulge, but also a younger (bluer) disk. And finally, as emphasized by Kauffmann et al. (1996), ellipticals should be forming over time, and thus appear to be decreasing in volume density towards higher redshifts, though admittedly, the amount of decrease is dependent on the choice of cosmology.
To make the comparisons somewhat more concrete, we compare the bulge data against the predictions of the SAM of Kauffmann et al. (1999) for a given epoch near redshift . These predictions are made in the form of Monte Carlo realizations of the SAM, with rough inclusion of the selection function. The original SAM (referred to as SAM-B in the figures) adopted a prescription whereby all satellites with mass ratios 1/3 or larger were incorporated into the bulge of the primary galaxy. But we found that the observed B/T distribution prior to bulge selection (see right hand two panels of Fig. 11 in Appendix B) yielded a much higher fraction of low B/T galaxies than that predicted by this SAM. This is likely related to a well-known angular-momentum problem faced by all CDM models, which are unable to make a significant population of bulge-less disks as observed (e.g., Navarro & White, 1994). We thus worked also with a second SAM model, in which satellites were added to the disk instead of the bulge of the primary (referred to as SAM-D in the figures). Overall and qualitatively, we find a reasonable match between the observations and the SAM-D predictions, though there are visible differences when examined in detail.
5.4 Results of Model Comparisons
We reference the three scenarios of Bouwens et al. (1999) based on the relative ages of bulges and disks, namely Early for the monolithic collapse formation model in which bulges form before disks; Simultaneous for the simultaneous formation model; and Late for the secular evolution models in which bulges are formed after disks. SAM-B will refer to the original Kauffmann semi-analytic models in which 1:3 or larger satellites are all placed into the bulge of the primary. The revised models with satellites going into the disk are designated SAM-D. To improve the realism of the comparisons, the Monte-Carlo realizations of the models include the same luminosity selection factors as our quality observations (Sections 2.3 and 3.4). The additional constraints based on size were not applied, since the models did not include such parameters for the bulges and disks. Since the restrictions based on size eliminated only a small fraction of the data, in practice the comparisons should be reliable enough to be illustrative.
To compare data to models, many diagnostics are possible given the large number of parameters common to both the observations and the models. To limit the discussion, we focus on the B/T vs. bulge color distribution (see Fig. 6). Model predictions of the B/T distribution, color-magnitude relation, and B/T vs. color difference between the bulge and disk, are provided in Appendix B.
As seen in Fig. 10, the most striking result is the poor fits of both the Simultaneous and Late Bouwens models to the data. Bouwens et al. (1999) were unable to eliminate any of their three basic bulge formation scenarios with the very limited observational data available at that time. In contrast, our new data illuminate significant differences between the models and data, even after having added the aforementioned improvements to the original models of Bouwens et al. (1999).
Thus one solid result is that neither the Simultaneous nor Late models of Bouwens et al. (1999) are viable now. Both models have bulges forming at the same time or later than disks, and thus both predict large fractions of distant high B/T galaxies with very-blue, luminous bulges. The vast fraction of observed luminous photo-bulges , and thus presumably any subset of genuine luminous bulges, is found to be very red. The predominance of very-red bulges is seen even at lookback times corresponding to the epoch of major disk and bulge formation at redshifts . In contrast, the SAM-B model is not a bad rendition of the data, but both the Early and SAM-D models yield distributions that are far better matches to the data.
One clear feature of all models is that blue () bulges almost always have large . This is true even for the relatively few blue bulges seen in the Early, SAM-B, and SAM-D models. This result reflects the difficulty of building up a significant disk very soon after the blue, early-formation phase of the bulge. This near-universal property of blue bulges having high B/T ratios in all the models further supports our claim in Section 3.3 that the few photo-bulges in our observations bluer than and with low B/T (large disk fractions) are more likely to be centralized regions of active star formation rather than genuine massive bulges in early formation as envisioned by theorists. The high luminosities predicted for blue bulges in the models (see Fig. 12 in Appendix B) also support our contention that we have not actually found a significant population of massive bulges in the early phase of active star formation.

The Early and SAM models match the data fairly well, not only in the B/T distribution, but also in the other diagrams shown in Appendix B. When examined more closely, some of the more notable differences include slightly bluer predicted colors on average, a higher abundance of large B/T in the observations compared to either of the SAM models. Also, although the numbers are small, 4 of the 5 blue model bulges are among the most luminous of all predicted bulges, whereas the bulk of the bluest observed photo-bulges are among the fainter half. Other differences between the data and models are discussed further in Appendix B. Assuming that the SAM-B models represent the state of the art among SAMs, have been adjusted to match local observations or less colors. the better match of SAM-D to our data is a vindication of the power and potential of high-redshift data to help theorists improve their SAM parameters.
Making the simplistic assumption that colors are correlated mainly with age (i.e., that metallicity variations are secondary), the comparison of models to data suggests:
-
•
Most luminous bulges (as in the present sample) appear to be very old, with very red colors121212To reach , an instantaneous burst must fade for 6-8 Gyr if of solar metallicity. If of 2.5 solar, only 2.5 Gyr are needed (Bruzual & Charlot, 2003). indicating formation redshifts at least 1-2 Gyr before .
-
•
Luminous bulges formed almost always before or simultaneously with disks, rather than afterwards.
-
•
Bulge colors (and therefore ages) appear to be independent of B/T, so that the ages of ellipticals (pure bulge) and the bulges of S0’s and spirals were all similarly old at .
-
•
Few luminous bulges are being formed outright at high redshifts , since the observed blue bulges are generally not very bright and do not have high B/T, and thus do not match the predictions by any models.
5.5 Why are High Redshift Bulges So Very Red?
The main result of this work is that luminous bulges () of field galaxies at high redshifts () appear to be predominantly (81%) very red () with relatively small intrinsic scatter (). This finding appears to be independent of the relative amount of disk light (i.e., B/T), the color of the disk, the luminosity of the galaxy, and even the presence of emission lines in the integral spectra. The puzzle is that the color-luminosity relation for luminous high-redshift bulges appears virtually identical to that found for bulges today. Any luminosity evolution only deepens the puzzle, since fading bulges need to become bluer with time to stay on the color-magnitude relation. Such behavior is diametrically opposite to expectations for any plausible set of models of an isolated, passively evolving population of stars!
Let us address possible explanations for our results.
Cosmology: Cosmology does not affect our basic findings, since both color and surface brightness are measurements that depend only on redshift and not on the geometry of the universe.
K-corrections: The conversion of our HST WFPC2 to restframe is relatively robust, since at redshifts near , the observed bands correspond closely to restframe and (see Gebhardt et al., 2003). As an independent check, our K-corrections for match to within 0.02 mag to that derived by van Dokkum et al. (2000) in their equation B4.
Photometric zero points: HST data have much more reliable and stable zero-points than usually possible from ground measurements. As an independent check of our zero point, we can compare whole galaxy, instead of subcomponent, colors measured by our team (see Figure 8 in Im et al., 2002) to those of other field (e.g., Ellis et al., 2001) or cluster (van Dokkum et al., 2000) galaxies, all at the same redshift range. All three samples show .
Systematic errors in GIM2D: One possible concern is that the photo-bulge component is made artificially redder by GIM2D. To test this bias, we have examined GIM2D simultaneous-color extractions of a set of simulations where the colors of the photo-bulge and photo-disks were nearly identical for a full range of S/N (galaxy brightness), eccentricities, inclination, B/T, relative sizes, disk inclinations, etc. We find no evidence for any systematic offset to redder colors for the photo-bulge component. As another simple check, we can compare central colors (column 9 of Table 1) to that of the whole galaxy (column 8 of Table 1 or column 7 of Table 2), (cf. work of Abraham et al., 1999; Ellis et al., 2001) – the vast fraction shows a redder center. Thus if photo-bulges dominate the central light, the photo-bulge colors should be redder. A key assumption in adopting the simultaneous-fit rather than separate-fit color measurements is that neither the photo-bulge nor photo-disk has a color gradient. Another assumption is that disks are purely exponential to the galaxy center. If instead, disks are truncated in their inner parts (see Kormendy 1977 or Baggett et al. 1998), and if bulges are redder than disks, then the measured colors for the bulge will be biased redder. Although such inner truncated disks may explain the very red colors for some photo-bulges, the low dispersion of the very red colors becomes a serious challenge.
Local comparison samples: The colors of local bulges remain uncertain. The most direct comparison of our sample can be made with the measurements of the bulges of 45 early-type (S0-Sbc) galaxies (Balcells & Peletier, 1994). After we shift the distant bulges in the color-magnitude plot to account for about 1 mag of luminosity evolution, we find the colors to be indistinguishable, either in average value or in scatter, to the colors of bulges seen locally. If we instead adopt the integrated colors of field E-S0’s, we find the surface photometry of the field sample of Jansen et al. (2000) to yield a tight color-magnitude relation for bright () galaxies (along with a shallow color-magnitude slope). In this case, our high redshift sample appears to be slightly bluer by mag, but after again accounting for about 1 mag of luminosity evolution, we find the mean colors to be indistinguishable.
Clearly the assumed slope of the CM-relation is important when comparing distant vs. local colors, as a corection must be applied for luminosity evolution to match the same physical objects, A shallow slope means that the color correction due to this effect is less.
These findings of a shallow slope for local bulges are reaffirmed by recent measures from the Sloan Digital Sky Survey (SDSS) (Bernardi et al., 2003b). The integral photometry of E’s from the 7 Samurai (Burstein et al., 1987) or of E-S0’s from Prugniel & Héraudeau (1998) have larger scatter, steeper color-mag slope, and slightly bluer colors. In these comparisons, we find the color scatter of the high redshift sample to be comparable to that actually observed in the local sample, rather than to the inferred intrinsic scatter. A full discussion of this issue is beyond the scope of this work and we remain cautious of the exact amount of color evolution, but the predominance of the evidence suggests little, if any, change in the intrinsic colors of bulges from high redshifts to today, especially after accounting for a shift in the color-mag relation to 1 mag of luminosity evolution.
Dust: Dust is a complication that is difficult to address well, especially within the limits of our existing optical data for the high redshift bulges in our sample. At some level, dust must be present. Indeed, in cases where we see a highly inclined blue disk through which the bulge appears to be plausibly obscured (e.g., 064_4412, 094_7063, 152_5051), we find implausibly red colors for the photo-bulges if dust is not included. Moreover, as revealed in HST NICMOS observations of local bulges in early-type spirals, where much more detailed and careful photometry is possible, strong color gradients suggest the presence of dust at the significant level of 0.6–1.0 mag, but mainly in the very central 100-200pc Peletier et al. (1999). On larger scales more comparable to the measurements we can make at high redshifts, the same authors find the optical to near-IR colors to be so tight among the S0-Sb bulges that the inferred age spread is no more than 2 Gyr. They also find similar colors between Coma cluster early-type galaxies and local field galaxy bulges. Even if dust plagues the colors of bulges both locally and at high redshift, a dust explanation of similar colors at both epochs would imply some evolution in the relative effects of dust, since the underlying stellar population is expected to be bluer in the past. Though our sample size and color precision are not high, we find no clear evidence for any dependence of the very red photo-bulge colors or of their scatter on the inclination angle of the photo-disk or on the B/T ratio. A naive expectation is either for a larger color scatter among photo-bulges residing in disks (some of which may be dusty) or for disks that are measured to be inclined. We surmise that dust is present at some level, but we find no evidence that it is a dominant source of our red colors.
Stellar population models: Even after accounting for the high level of degeneracy between metallicity and age among most broadband colors, models from different authors still yield significantly different (35%) predictions for ages versus colors (Charlot, Worthey, & Bressan, 1996). However, regardless of uncertainties in the input stellar evolution components, no models to our knowledge predict constant very-red colors for passive evolution. Though non-linear, typical changes are 0.2 mag in for each magnitude of luminosity change. We remain open to the possibility that a significant effect or component has been overlooked in all these models that would salvage the pure passive evolution in explaining the constancy of very red colors in , while the luminosity has brightened by 1 mag. One suggestion along these lines is that the IMF is truncated above 2 M, in which case red and roughly constant colors would result, even during the “young” stage of the first few gigayears after formation (Broadhurst & Bouwens, 2000). The [O II] emission seen in distant spheroidals would then need a separate explanation.
Revision to pure passive evolution: As discussed in more detail by Gebhardt et al. (2003, : GSS9), a plausible scenario to explain our results requires a more complicated history than pure passive evolution after an initial, brief burst of star formation. We propose a post-burst infusion of blue light from small amounts of additional star formation or from metal poor stars over an extended period. While GSS9 needed to explain 2.4 mag of luminosity evolution while keeping integral colors of galaxies to , our bulges are slightly redder at and luminosity evolution is somewhat milder at mag. In this case, the typical scenario needs less (4% instead of 7% by mass) additional star formation integrated over the lifetime of the bulge. Thus a viable scenario to yield 1 or more magnitudes of luminosity evolution accompanied by a nearly constant is found to be achievable.
This suggestion of an additional phase of continued star formation is compatible in spirit with the claims by, e.g., Trager et al. (2000), that the observed correlations among Mg, Fe, velocity dispersion, and ages measured from high-quality, local early-type galaxy spectra can be explained by adding a “frosting” of younger (but more metal-rich) stars to older, solar-metallicity, single stellar populations. While Trager et al. (2000) examined their scenarios using two bursts,early and late, our scenario includes a more continual infusion of star formation. As we previously noted, the frequent presence of [O II] emission lines provides strong evidence for continued star formation in early-type galaxies, even those that appear to be very old (i.e., very red) in both the disk and bulge. Other authors have also noted the common presence of [O II] emission lines among early-type galaxies at intermediate redshifts at the 25% level (Willis et al., 2002; Treu et al., 2002) and even higher fractions () and up to higher redshifts (e.g., Schade et al., 1999; van Dokkum & Ellis, 2003). These results favor active star formation as the “frosting” component rather than hot, old metal-poor stars. Whether the star formation arises from infalling gas from the halo or satellites, cooling flows (Mathews & Brighenti, 1999), or cooling of internal residual gas left over from feedback processes such as prior episodes of supernovae heating (Ferreras, Scannapieco, & Silk, 2002) is not easily discriminated from our data, but we note that the small scatter observed in the color-magnitude plots precludes episodic star formation that occurs mainly in strong bursts, since otherwise significant color dispersions would be expected. Moreover, whether the new star formation contributes mainly to the disk rather than bulge is also a key uncertainty.
6 SUMMARY and CONCLUSIONS
We present a candidate sample of luminous, high-redshift spheroids (ellipticals and the bulges of S0’s and spirals) found within the Groth Strip Survey (GSS), one of the early-phase DEEP surveys with redshifts and spectra from the Keck Telescope and photometry from the Hubble Space Telescope (HST). A framework is adopted in which the structure of each galaxy is decomposed into two simple subcomponents, one with an profile which we dub a photo-bulge, and another with an exponential profile we dub a photo-disk. We caution the reader that our selection and structure-extraction procedures may, however, also contaminate the sample with non-bulges such as nuclear/central star-forming regions of late-type galaxies or any subcomponent that is not well fit simply by an exponential with one scale length. We define a statistically complete sample of 86 galaxies that is constrained to have photo-bulges brighter than and to have good-quality, spectroscopically-confirmed redshifts in the range . This sample is extracted from a larger and fainter redshift sample of about 600 field galaxies within the GSS and comprises about 40% of the full sample in the same redshift range. This photo-bulge sample is the most extensive, faintest, and homogeneous sample of candidate bulges with solid spectroscopic redshifts at and should be a statistically complete sample of high-redshift, luminous, -profile bulges that include bonafide ellipticals, bulges of S0’s, and bulges of spirals. We largely avoid the common problems in prior studies of identifying pure ellipticals or early-type galaxies at high redshift, of mixing galaxies with and without disks into the analysis of bulge evolution, and of contamination of bulge colors by bluer disks.
After further pruning the sample to exclude the faintest 0.5 mag and possibly unreliable measurements, we retain a sample of 52 bulges with which we analyze the photo-bulge luminosities, sizes, colors, and volume densities. With the caveat of having adopted several key assumptions for this work, namely, that galaxies can be decomposed into bulges and exponential disks; that color gradients for either subcomponent are negligible; that colors largely track age rather than metallicity or dust, we find the following results:
1) The main conclusion is that the vast majority (85%) of luminous photo-bulges at redshift are very red, with median restframe and bounded by the 25 percentile at 0.31 and 0.55. This color matches that found for local E-S0 today () and is redder than the observed integrated U-B colors of luminous cluster or field early-type galaxies at similarly high redshifts.
2) The very red colors of the luminous photo-bulges are found to be independent of their fraction of the total light (pB/T), i.e., we find no difference between the colors of bulges found in disk-dominated spirals and in early-type, bulge-dominated E-S0’s. These red photo-bulges almost always () co-exist with photo-disks at the 10% or greater level (), i.e., pure ellipticals are rare in our sample (c.f., Schade et al., 1999). Likely systematic errors in our pB/T values strengthen this conclusion. We also find that almost all (90%) of the galaxies harboring such very-red photo-bulges appear as normal early-type or spiral galaxies. In contrast, the galaxies hosting bluer photo-bulges are dominated (over 60%) by morphologies (double nuclei, distortions, close neighbors) highly suggestive of interactions and mergers.
3) The very-red photo-bulge colors are also independent of the color of the associated disk and of the inclination of the disk. If dust is playing a role, we have not been able to discern its effects directly, except as seen in a few edge-on objects.
4) For the very red photo-bulges, the slope of the color-magnitude relation is found to be shallow () and the intrinsic scatter about the color-magnitude relation is small, mag. These match well to the slope of -0.03 and scatter of mag observed among early-type cluster galaxies at (van Dokkum et al., 2000). We note that the persistence from high redshift to today of a shallow slope in the color-magnitude relation might naively imply that metallicity, rather than age, is the more dominant cause of the color-magnitude relation (e.g., Tamura et al., 2000). But, as mentioned next, a pure, simple, passive evolution model is unlikely to be applicable to our bulges, so the influence of younger stars must be considered.
5) For the very red photo-bulges, the size-luminosity relation reveals a luminosity (i.e., surface brightness) increase at the level of mag by redshift . This luminosity brightening coupled with a lack of color evolution is difficult to explain by simple passive evolution. One plausible alternate scenario consistent with our data starts with a dominant (95%) metal-rich, early-formation () population that is later polluted with relatively mild and gradually decreasing star formation.
6) In support of this on-going star formation scenario, we find that even among galaxies in which both components are very red (i.e., good E-S0 candidates), roughly 60% (10/16) show O II emission lines. An even larger fraction, 80% (8/10), of the most luminous galaxies show emission lines, indicating on-going star formation at the level of yr-1 per 10 of stars. Although this rate is considerably greater than needed to explain the constancy in bulge colors, the source of the star formation activity and the division of new stars between disk and bulge remain too uncertain to assess whether we have a true inconsistency.
7) Blue photo-bulges are only a small fraction of bulges (8%). They host star formation activity that ranges from mild to intense; possess lower luminosities () on average than the redder photo-bulges; often (3/4) reside in redder photo-disks; and are characterized by restframe half-light surface brightnesses too low to enable them to be the progenitors of the redder, more luminous photo-bulges. Moreover, the narrow velocity widths ( ) measured from some of their strong emission lines argue for low masses, and thus we conclude that the very blue photo-bulges are in fact luminous, centrally concentrated, star formation sites within disks that, on average, have older stellar populations. These blue photo-bulges are not likely to be the genuine progenitors of luminous bulges today, but some are perhaps the predecessors of small bulges in spirals.
8) Taking points 1 and 7 together, we find little evidence in our deeper and more extensive data to support previous claims (e.g., by Abraham et al., 1999; Menanteau et al., 2001; Schade et al., 1999) for a significant (30% to 50%) population of either blue bulges or blue ellipticals at redshifts 0.7 - 1.0.
9) The colors of photo-disks are almost always the same as or bluer than that of the photo-bulges, but it is worth noting that we do find a few very-red, luminous photo-disks at high redshift. If these are genuine disks, the implication is that at not all massive disks are young and that some old, massive S0’s have already existed in the field.
10) The integrated luminosity density () of very red photo-bulges comprise 36% of the total at high redshifts , a result in need of better statistics before solid conclusions can be drawn.
11) Finally, we compare our data to improved heuristic formation models of E-S0’s and bulges by Bouwens et al. and find that neither the Late nor Simultaneous bulge formation models match the B/T and bulge color distributions. The Early monolithic collapse model with old bulges, however, or the semi-analytic models of, e.g., Kauffmann and collaborators, both provide predictions that yield far superior and, overall, good matches to our data. The bulge colors from the models being bluer than seen in the observations will probably need more complicated physics, e.g., protracted but mild star formation from cooling flows from internal gas or infusion of external gas.
Despite the various conclusions afforded by the present sample, many important issues remain to be resolved with improved data. On the observational side, larger samples are clearly needed to improve the statistics, especially of rarer subsamples, such as the fraction of blue bulges or the frequency of AGN activity and their correlation with bulge properties. Even extending the sample to lower redshifts may serve to strengthen or to challenge the somewhat unexpected results we have thus far found at high redshifts. Direct comparisons of the bulge colors of cluster galaxies versus those in the field would be valuable. Color gradients and other photometric structural information (e.g., light profiles which are not , the presence of nuclear point sources, measures of galaxy distortions) need to be explored in detail as well as the level of biases in photo-bulge measurements that may result from unusual morphologies. Finally, diverse forms of correlations will help to improve our understanding of the nature of bulges, especially between bulge properties and other information, such as disk properties, morphology, close neighbors and environment, or from other wavelengths (near-IR, far-IR, submm, radio, X-ray), and especially the wealth of new local data from the 2dF and SDSS.
Appendix A Selection Function for the Bulge Sample
A.1 Overview of Approach
Since selection effects can conceivably mimic real evolutionary changes in the high-redshift galaxy population, it is important to determine how they affect the DEEP/GSS sample in general and the bulge sample in particular. Our approach has two major components. The first is based on simulations to determine the incompleteness of our photometric catalog from which the spectroscopic samples are derived. The second is based on a purely empirical determination of any incompleteness of the spectroscopically-confirmed sample by comparing it to the full photometric catalog. In both cases, simplifying assumptions as detailed below are adopted.
In the most general case, the selection function can be quantified by a weight for each object that is proportional to the inverse of the effective areal coverage of the entire GSS sample and which combines the selection functions that depend on multiple parameters. For this work on bulges, we have restricted the dependencies to a small subset of possible parameters that relate most closely to our analysis, namely, apparent flux, size (or surface brightness), pB/T, and color. A more detailed discussion of selection functions, but for disks rather than bulges, is provided in Simard et al. (1999). The following summarizes the main components related to this study of high redshift bulges.
A.2 Distribution Functions
The observed distribution of bulges within a multi-dimensional space of intrinsic properties, , versus redshift, , is the result of any inherent (i.e., within the Universe) distribution modified by observational selection effects, whose functions we designate as . The possible parameters included within are many, but for this work, the most relevant are the absolute luminosity of the bulge in restframe , ; the bulge effective or half-light radius in kpc, (or averaged surface brightness within the effective radius, ); the bulge to total ratio, ; and the bulge restframe color, . All of our radii, scalelengths, and surface brightnesses refer to the non-circularized semimajor axis values. Given that the completeness in the detection of faint disks has already been found to be dependent on at least surface brightness as well as apparent magnitude (see Simard et al. 1999), we might expect these to be significant selection effects for bulges as well. Because of their high surface brightness, the bias for bulges may be less than that for disks, but bulges still show some dispersion in their sizes and surface brightnesses in local samples (Bender, Burstein & Faber, 1992; Burstein et al., 1997).
After adopting a cosmology and a set of spectral energy distributions (SEDs) that span the range possessed by real galaxies, we can apply the appropriate corrections to translate any values of and redshift to a set of observed parameters, , or vice versa. We may thus, henceforth, speak of any function or interchangeably.
The path from to is given by:
| (A1) |
The subscript stands for “Universe sample to Photometric sample,” and the subscript stands for “Photometric sample to Spectroscopic sample”, where the spectroscopic sample refers specifically to our photo-bulge sample. The distribution of intrinsic galaxy properties, , is not known a priori. Once the two selection functions in Eq. A1 have been characterized, however, their product (denoted hereafter) yields the region of the volume where real galaxies would have been observed if they existed. is particularly valuable in making reliable comparisons of theoretical models to data.
A.3 Spectroscopic Sample Selection
The current DEEP/GSS sample has a total of 587 objects with both reliable Keck redshifts and structural parameters (Vogt et al., 2004, : GSS1). The purpose of the present paper is to study the luminosities, colors, and volume densities of luminous bulges at redshifts up to , so the sample was further reduced to 86 galaxies by selecting only galaxies with photo-bulges brighter than = 23.566 and redshifts . Two AGN’s (GSS ID: 142_4838 and 273_4925) which would have met our constraints were excluded by requiring the effective radius of the photo-bulge be greater than 0.03 arcsec (0.3 pixels).
The high redshift limits that define the sample were chosen 1) to correspond roughly to the range adopted by CFRS in their study of high redshift ellipticals (Schade et al., 1999); 2) with an adjustment to a limit just below 0.75 and higher than 1.0 to include two significant spikes of galaxies at these two limits, as seen in Fig. 2; 3) to avoid redshifts higher than where our incompleteness is likely to be serious because [O II]3727 Å, often our only redshift indicator, falls into the 7600 Å atmospheric “A” band absorption feature and then enters a dense and very bright forest of atmospheric night sky OH lines. Moreover, in our chosen redshift range, the observed and filters correspond roughly to restframe , while at higher redshifts, we are observing further into the ultraviolet where local galaxies have not been well observed.
The flux limit for photo-bulges was chosen to achieve a relatively high spectroscopic success rate and to ensure moderate precision of structure decompositions and color measurements. With no consideration of dependencies on redshift, the DEEP/GSS redshift sample is statistically 85% complete to bulge = 23.566, meaning that reliable redshifts (quality greater than 2.9) were obtained for 85% of the targets observed spectroscopically. We emphasize that the final redshift sample of bulges, however, is neither spatially complete nor uniformly sampled throughout the GSS, since not all objects with bulges brighter than = 23.566 have thus far been targeted. Moreover, although the spectroscopic sample was largely chosen as a magnitude limited sample, i.e. on the basis of magnitudes, the number of targets at each magnitude interval was purposely chosen to be relatively flat rather than rising towards fainter fluxes like the counts. Another reason the observed targets do not represent a random sampling of the full photometric catalog is that some candidates were chosen on other criteria, such as having a clearly visible disk or very red or very blue colors. The next two sections address the determination of the actual selection functions.
A.4 Determination of , the Selection Function from the Full Photometric Catalog to the Spectroscopic Sample
Since we do not yet have redshifts for the entire sample of galaxies in the 28 WFPC2 fields of the GSS, we make the simplifying assumption that the redshift distribution of the GSS is spatially invariant across the entire strip. This assumption implies that our existing spectroscopic sample, regardless of its spatial distribution, has a redshift distribution that is representative of that from the entire GSS field. With this simplifying assumption, we then define the weight, , for each object in our high redshift sample of photo-bulges to be the inverse of the fractional coverage of the entire GSS field size of 134 square arcmin. Thus a weight of 5 for an object implies that it occupies a portion of the observed flux, bulge fraction, color, and surface brightness volume where the spectroscopic sample totals to 0.2 of the true averaged number of galaxies in the Universe in the full 134 square arcmin field of view. The full selection function is a product of two terms: one from the true distribution to the photometric catalog, , and one from the photometric catalog to the actual spectroscopic sample, .
Here we discuss the determination of , while is described in the next section. As already mentioned, we restrict the space of observed variables to photo-bulge flux, color, bulge fraction (), and surface brightness (or size). Some dependence of the spectroscopic completeness on flux and surface brightness is to be expected when considering the entire galaxy, but is not as obvious when considering the flux or surface brightness of a galaxy subcomponent, such as the photo-bulge. For bulge color and bulge fraction, completeness may be further complicated by possible correlations of these with the relative ease of detecting reliable spectroscopic features. Galaxies with strong emission lines, for example, are expected to be found in very blue galaxies,i.e., preferentially among those with small bulge fractions. Given the difficulty of accurately assessing all the factors that may affect the degree to which our actual photo-bulge sample is representative when compared to that averaged over the entire GSS, we take the following rough empirical approach. We ignore more subtle selection effects due to small number fluctuations, systematic biases due to variable densities of objects in different parts of the multiparameter space, and covariances among the parameters. We have also ignored the fact that the six objects in the deeper pointing (i.e., those with ID’s of 073_XXXX) have their own selection functions - we have merely adopted the single one derived for the other 27 GSS pointings.
To derive the selection function, we simply study the relative numbers of various subsamples of galaxies in our full spectroscopic sample to that found with the same observed properties in the full photometric catalog of the GSS(i.e., the one with 587 objects). No division by redshifts was made, since we do not have redshifts for all objects in the full photometric catalog. As previously noted, we have two photometric catalogs, one that is the full catalog in which the images in and for all objects in the entire GSS were processed separately by GIM2D. The other catalog only has information for galaxies in the spectroscopic sample and was processed with GIM2D operating on both images simultaneously. Since our subsample selection and structural parameters are based on the simultaneous mode of GIM2D, ideally we would have the entire GSS processed in this mode to yield a full photometric catalog for the determination of the selection function. In practice, we adopt the relatively simple parameterization of the selection function that is derived instead from the catalog processed in the separate image mode. We have not found significant systematic differences in the measurements, only improved precision (smaller errors) when the simultaneous mode of GIM2D is used.
We first divided the spectroscopic sample into several ranges of photo-bulge (): e.g., 18-20, 20-21, 21-23, and 23-23.566. For each, we obtained the ratio of the number of spectroscopic objects relative to the entire GSS photometric catalog and plotted these against . A smooth fit as a function of bulge flux then yields the simple selection function:
W = 2.7 for between 20 and 21;
W = 2.2 for between 21 and 21.5; and
W = - 41.5 for where is the apparent magnitude of the photo-bulge as measured in the catalog using separate fits to the and images (see Table 1).
We then searched for deviations from these average weights due to each of apparent galaxy size, color, and pB/T ratios separately (i.e., no additional simultaneous subdivision by two or more parameters) in each of several ranges. We examined only the subsamples with high quality redshifts. We deemed the above to be the most relevant for this study. We thus ignored other possible parameters for study, including those related to the original selection of targets for spectroscopy (e.g., presence of close neighbors, inclination of galaxies, etc.) or possibly related to the lack of success in obtaining a redshift (slit length, position within slit, PA and ellipticity, airmass, etc.).
The findings are relatively simple. Using 0.1 arcsec (1 pixel) intervals, we found no variations due to size to within the 68% confidence limit (68% CL corresponding to 1 for a normal distribution) when small-number statistics were explicitly taken into account. For color ( of the photo-bulge) in 0.2 to 0.5 mag bins, we again found no variations at a significance level greater than 68% CL. The biggest discrepancy was 4 objects observed, whereas 10.7 were expected for the faintest bin with to 23.566 and color of 1.5 to 2.0. This is a plausible bias because such red, faint galaxies may have greater difficulty yielding reliable redshifts. For pB/T, however, while we found no variation for the three brightest flux ranges to within 95% CL, we did find significant variation in the weights in the faintest photo-bulge flux range. For larger than 0.8 (perhaps corresponding to pure ellipticals), our sample had only 1 object while 7 were expected. Small number statistics indicate that this is still within our chosen threshold of 95% CL and so the simple estimate above was retained. For pB/T below 0.2, however, we expected 5.8 out of 44 total and found 13, a result that is significantly low at greater than the 99% CL. We thus recommend adopting a weight = 2.1 instead of the average weight formula above when selection effects that are dependent on B/T are needed. Only four objects within our high redshift photo-bulge sample are affected by this deviation from the global average: GSS ID: 084_5452, 094_2210, 094_7063, and 144_1141. The cause of this excess is attributed to our bias in favor of good candidates for rotation curve measurements, i.e. well formed, bright spirals, which have faint bulges and thus small pB/T ratios.
A.5 Determination of , the Universe to Photometric Catalog Selection Function
The selection function contains the information needed to convert any sample of galaxies on the sky to the photometric catalog produced with SExtractor and reflects the adopted SExtractor detection parameters (detection threshold in ’s, minimum detection area, etc.). of the intrinsic properties, MP, is then merely a conversion of the selection function using -corrections that depend on color and redshift and corrections for size and luminosity distances that depend on the choice of cosmology.
Without a much deeper photometric catalog for direct empirical measures of the selection function, we have chosen to determine from simulations created by Simard et al. (2002). We generate 30,000 galaxy models with structural parameter values that uniformly cover the following ranges: total galaxy brightness — ; half-light major-axis radius of an bulge — ; bulge to total ratio — ; bulge ellipticity: ; disk scale length — ; and disk inclination angles — . Note that the simulations were performed only in the image, so that the observed colors were used only to apply the appropriate K corrections to link to the intrinsic properties. Each model galaxy was added, one at a time, to an empty 20″ 20″section of a typical GSS image. “Empty” here means that no objects were detected by SExtractor in that sky section using the same detection parameters used to construct the object catalog. Using an empty section of the GSS ensured that was constructed with the real background noise that was seen by the detection algorithm. The background noise included read-out, sky, and the brightness fluctuations of very faint galaxies below the detection threshold. This last contribution to the background noise is particularly hard to model theoretically without a priori knowledge of the counts, light profiles, and clustering properties of galaxies undetected by the SExtractor software; the current approach bypassed this problem. SExtractor was run on each simulation with the same parameters that were used to build the SExtractor photometric catalog. The function was taken to be the fraction of galaxies successfully detected and measured by SExtractor at each value of .
The results are simple: we should have detected 100% of all galaxies to our limit of bulge for regardless of any of the other parameters that were varied. Even up to (the largest in our sample is less than ), the completeness is expected to be 99%. Thus the final weight for is the same as for determined in the previous section.
Appendix B Additional Model Predictions vs. Data
Besides the B/T vs. bulge-color plot of the models in the main section (Fig. 10), we present here the model plots corresponding to the other data figures (Figs. 4, 5, 8). As in Fig. 10, the data refer to the quality sample of 52 rather than the starting bulge candidate sample of 86. A few comments are made for each figure.
Fig. 11,B/T Histogram: Both the open and hatched histograms are discriminating. The open histogram of the actual data shows a strong peak at the bulgeless () end, a flat distribution to , and a linear drop to the high bulge limit of . The Simultaneous and Late models of Bouwens et al. (1999) both show much flatter distributions, while the SAM-B model shows a humped distribution peaking at . The SAM-D model shows a sharp drop from the bulgeless end and is thus also a poor match to the data. Only the Early of Bouwens et al. (1999) model shows a reasonable match, though the bulgeless end of the model shows too few galaxies.
The hatched portions of Fig. 11 show that both Late and Simultaneous models predict a large population of luminous bulges and that most of these would have . The quality-sample data are a poor match showing roughly half the number of luminous bulges and a fairly broad B/T distribution with a peak near . In contrast, the Early model predicts far fewer luminous bulges, roughly half that observed, with a peak at lower , and a small bunch at . The SAM-B model predicts numbers and a peak in B/T that are a good match to the data, but the predicted spread is somewhat narrower than observed. While the SAM-D models appeared to give the best matching distribution in Fig. 10 of B/T vs. color, here its histogram shows the numbers are fewer and a shape skewed to lower B/T than observed.
Qualitatively, the hatched histograms suggest the best fitting model would be SAM-B with the Early almost as good while the open histogram clearly favors the Early over the SAM-B. The SAM-D gives a better match than SAM-B for the open distribution, but is clearly inferior for the hatched bulge sample. Both the Simultaneous and Late models are clearly ruled out in both distributions.

Fig. 12, Bulge Color vs Bulge Luminosity: The observational data exhibit a relatively tight band spanning about 3 magnitudes in luminosity and very red colors near and a much sparser spread of galaxies towards bluer colors. As seen in a single Monte-Carlo realization of each of the three improved models by Bouwens et al. (1999) and SAM-B and SAM-D (Fig. 12), the Simultaneous and Late models are poor matches to data, while the remaining three models have overall distributions that are qualitatively similar. As might be expected, the Late models have more luminous blue bulges than the Simultaneous models; but both have many more luminous blue () and very blue () bulges than do the Early or SAM models. When the Early model and SAMs are examined more closely, there are subtle but significant deviations from the data. First, the SAM colors for the bulges are bluer on average by 0.1 to 0.2 mag than that of the observations. This color difference is an independent confirmation of our claim that photo-bulges appear to be too red for an easy explanation with only passive evolution. Second, except for one bulge in the SAM-B distribution with and , the other one in SAM-B and the three in the Early model are all at the luminous end of the distribution. The observations show three or four such blue bulges and all are in the lower half of the luminosity range.
Overall, the Early and SAM models match the color-mag data well, although both Early and SAM models predict bluer bulges than observed. The Simultaneous and Late models produce far too many very-luminous, blue bulges to be compatible with our data. No model seems to predict a sloped CM diagram as seen in the integrated colors of distant red cluster galaxies (van Dokkum et al., 2000).

Fig. 13, B/T vs. Color Difference between Bulge and Disk: Fig. 13 shows that the majority of galaxies in either the Simultaneous or Late models have bulges that are bluer than disks. In contrast, the Early and SAM models and the observations all have bulges that are almost always as red or redder than any disk. The Early model shows a systematic trend of bluer bulges galaxies with larger B/T that is not observed. Thus overall, again the Simultaneous and Late models are strongly excluded by the data, while the other three show distributions that are fair to good matches, with the Early model being somewhat less accurate than the other two.

Appendix C Comments on Individual Objects
Here we consolidate additional comments on individual objects. Sizes refer to major-axis half-light sizes, i.e., for photo-bulges and 1.67 for photo-disks. Kinematic measurements have been made by fitting Gaussians to the emission line profiles, stellar templates to the absorption lines, and structure-based estimates of the terminal velocity from 2-D measurement of rotation curves. CID refers to the CFRS ID’s of ellipticals (B/T = 1) as measured by Schade et al. (1999); a mention is made in each case of whether any emission lines of O II were seen. By “very red” for the subcomponents, we mean ; by “less red”, we mean between 0 and 0.25; by “blue”, we mean between -0.25 and 0, the latter corresponding to the average color of local Sbc galaxies; and by “very blue” to mean . The * accompanying the ID indicates candidates in the quality sample (see Section 3.4)
062_2060* – CID: 14.1028 (specified twice in their published table) with O II detected with EW of 31+/-10Å. This is the 4th most luminous system with both a very red photo-bulge and photo-disk component and pB/T = 0.57. Yet strong O II emission lines (restframe 10Å) are seen with linewidth. is strong in absorption, indicating presence of a young ( 1 Gyr old) stellar population.
062_6465 – This object is in the possible blue E-S0 sample of Im et al. (2001). It has a redder, but larger photo-bulge than the very blue, tiny photo-disk.
062_6859* – CID: 14.1178 with no O II detected. This object is in the E/S0 sample of Im et al. (2002). Both the photo-disk and photo-bulge are very red. O II emission may be present (restframe 11.5Å) and is unresolved.
064_3021* – CID: 14.0854 (specified twice in their published table) with no detection of emission lines. Third most luminous galaxy with the photo-bulge and photo-disk being both very red. We find pB/T = 0.68 and also find no evidence of emission lines.
073_1809* – Part of a complex, interacting pair or set of galaxies, detected with ISOCAM and observed with an infrared spectrograph on Keck to measure its (see Cardiel et al., 2003, for details).
073_4569 – This less red galaxy has a very red, low luminosity () photo-bulge that is larger than the tinier and blue photo-disk.
073_7749 – This object has a very red photo-bulge that is much larger than the less red (i.e., slightly bluer) photo-disk.
074_6044* – This is the second most luminous galaxy with both components being very red. The photo-disk is much smaller than the photo-bulge. Strong O II emission lines (restframe 8Å) are detected and their velocity widths are unresolved (i.e., )
074_6844* – This object has the limiting eccentricity of 0.70 and an extremely tiny photo-bulge. Though the photo-bulge size is suspect, its color is nevertheless measured to be intrinsically very red.
084_1138* – CID: 14.1277 with no emission, but their visual classification is Sab or later. This is one of 3 very red pB in the quality sample with unusual morphology. HST images show a blue tidal feature or single wide spiral arm. We derive a pB/T and a blue photo-disk. We find no strong emission lines.
084_4515 – This object has an extremely red (), low luminosity () photo-bulge that is larger than the tinier and very blue photo-disk. This galaxy is an ISOCAM source and has been observed spectroscopically in the near-infrared by Cardiel et al. (2003).
092_1339* – CID: 14.1496 with strong O II emission. This galaxy is the only non-very-red photo-bulge more luminous than and is one of the two blue E-S0’s in the quality sample (other is 294_2078) studied by Im et al. (2001). With a , it is still red by our definition. The photo-disk is minor (pB/T = 0.88), both in luminosity and size. Multiple Keck spectra yield a well-measured low velocity width of O II of only . Except for the low mass inferred from the kinematics, this object would otherwise be the best candidate for a genuine blue bulge. Such low mass systems, however, might be closer to the luminous compact blue galaxies (c.f., Guzmán et al. 1998), some of which appear to be possible progenitors of dwarf ellipticals such as NGC-205.
092_2023 – This object, with eccentricity of 0.69, has close to the limiting value (0.70) imposed by the software modeling. More interesting, it has an extremely tiny photo-bulge and is the most luminous galaxy with arcsec (1 pixel). Even when the whole galaxy is considered, the half-light size remains so tiny ( kpc), that it lies in the extreme tail of the distribution of sizes for E-S0 (see GSS9 or Bernardi et al., 2003a). Yet, when its large velocity dispersion of 200 is taken into account, it is offset from the local fundamental plane by roughly 2.5 mag; this amount matches well the overall evolution seen at redshift (Gebhardt et al., 2003). This amount is far smaller than the inferred offset of 4 mag from the size-luminosity relation and is a caution that any inferred evolution from the size-luminosity relation should be independently checked. Whether the photo-bulge size and thus surface brightness are reliable, its color is, nevertheless, measured to be very red, an expected result since the whole galaxy is very red.
092_3358 – One of 7 photo-bulges more luminous than that are not very red. It has uniformly blue colors (restframe ) for the entire galaxy, including a photo-disk that is nominally smaller in half-light size than the photo-bulge. Strong O II emission is detected, but with low velocity width .
092_6027 – Its p͡B/T may be overestimated by 0.07 – see discussion in Sec. 2.1.
092_7241 – The photo-disk is measured to be smaller and redder than the photo-bulge, but the galaxy is blue overall, with the spectra showing very strong emission lines of O II. Two fainter neighbors lie within 2 arcsec.
093_1325 – This very red galaxy has an intrinsically very red, low luminosity () photo-bulge that is much larger in size than the equally red photo-disk.
093_2268 – Both components are of low-luminosity and blue, with the photo-disk slightly smaller than the photo-bulge.
093_2327* – One of three out of 41 very red quality pB with unusual morphology, in this case apparently having 4 very close interacting or merging satellite galaxies.
093_2470* – CID 14.1311 with no emission lines at the galaxy redshift. This system is, however, part of a quad-lens system (Ratnatunga et al., 1999; Crampton et al., 1996) where the background source at redshift is easily discerned via strong, broad emission lines. Our pB/T suggests an S0 rather than pure elliptical, though the photo-disk has colors close to that of Sbc galaxies (). This galaxy is the second most luminous in the spectroscopic sample of 205 with high redshifts between 0.73 and 1.04.
093_3251* – CID: 14.1356 with strong O II emission and a visual classification of Sab or later. Schade et al. (1999) claimed this is a blue pure elliptical. We measure pB/T , a very red photo-bulge, and a very blue disk. The galaxy is blue overall, shows features resembling spiral-arms or tidal extensions, and yields strong O II emission lines (restframe 32Å) that are unresolved in velocity width.
094_1313* – This object has an eccentricity of 0.69 (close to the limiting value of 0.70) and a small, very red, pure photo-bulge. Its pB/T may be overestimated by 0.07 – see discussion in section 2.1.
094_2210 – This system is distinguished in having among the lowest pB/T in our sample; a morphology with multiple blobs that might suggest a disk in early formation (Koo et al., 1996); and yet a very red photo-bulge. The rotation curve estimate of a terminal velocity by Vogt et al. (1996) suggests that this galaxy is massive.
094_2660* – This is the 5th most luminous galaxy with a very red photo-bulge and photo-disk. Emission lines of O II are seen (restframe 13Å) with a high velocity width .
094_4009 – A very-blue, low-luminosity photo-bulge with a very-red, equally bright photo-disk (restframe ). The morphology is peculiar; strong emission lines of O II are found; and the velocity width is unresolved at .
094_4767* – Among the bluer photo-bulges in the quality sample. The image, however, shows two compact concentrations of light of roughly equal brightness and color and imbedded at the edge of a round disk-like component. One of the compact subcomponents has been identified as the photo-bulge, while the other has been regarded in our detection system to be a separate galaxy (see GSS2 for an image of the residuals to the GIM2D fit). The photo-bulge in this case is unlikely to be a genuine blue bulge and is instead probably one of two blue, very actively star-forming regions of a late-type galaxy.
094_6234* – This is one of three out of 41 very red pB with unusual morphology – in this case, several very close apparently interacting neighbors. Its pB/T may be overestimated by 0.09 as discussed in section 2.1.
103_2074* – This is the 9th most luminous galaxy with both components are very red. The photo-bulge is much tinier and and of lower luminosity than the photo-disk. Emission lines of O II are detected (restframe 6-12Å) with a large velocity width of . Its pB/T may be overestimated by 0.09 as discussed in section 2.1.
103_2974 – The very red galaxy has a very red, low luminosity () photo-bulge that is larger than the less red photo-disk.
103_4766* – This very red galaxy has a photo-bulge with eccentricity of 0.69, close to the forced limit of 0.70. Though the size of its extremely tiny (0.04 arcsec) photo-bulge may be suspect, it appears very red. The photo-bulge is accompanied by a nominally larger, but still very red photo-disk.
103_7221* – The 6th most luminous galaxy with both components being very red. Emission lines of O II are seen at 6Åwith a velocity width of .
104_6432* – One of 7 non-very-red photo-bulges more luminous than . It has the 3rd bluest photo-bulge among the quality sample, but it has a very red, smaller photo-disk and a . The small photo-disk better represents the center of this galaxy and thus probably its true bulge. Thus the true bulge is then actually very red (). The presence of emission lines is uncertain. Its pB/T may be overestimated by 0.07 as discussed in section 2.1.
112_5966* – The very red photo-bulge is very small (0.06 arcsec).
113_3311* – This is the 8th most luminous galaxy with both components being very red. The photo-disk is, however, much smaller than the photo-bulge. A companion galaxy 113_2808 (lower right of image panel) has the same redshift () and is seen as a very peculiar arc-like or string-like galaxy with one end pointing towards 113_3311. Strong emission lines of O II are detected (5Å) with a moderate velocity width of . is strong in absorption and higher order Balmer lines are visible, both clues suggesting presence of a young post-starburst phase.
113_3646* – Its pB/T may be overestimated by 0.07 as discussed in section 2.1.
124_2009 – This low-luminosity, very-blue photo-bulge has an eccentricity of 0.69 (close to imposed limit of 0.70) and is accompanied by a slightly smaller but more luminous and redder photo-disk.
134_4363* – This object has an unusually high restframe ? B/T = 0.98 with a very red (0.57) photo-bulge.
144_1141 – The very red photo-bulge is extremely small in this photo-disk dominated system ().
152_3226 – This uniformly very-blue galaxy has a peculiar morphology and is near a very bright galaxy about 1 arcsec away. The very blue photo-bulge is larger than the very blue photo-disk.
152_5051* – The extremely red photo-bulge color may be affected by a dusty edge-on disk. The overall photometry may suffer significant contamination by a very bright projected neighbor.
153_0432 – The photo-bulge is larger than the photo-disk, but both are very red. O II is detected at EW 10Å and is unresolved.
153_2422 – Peculiar morphology, perhaps part of an interacting system with 153_2622. Photo-bulge is much larger than the photo-disk but both are very blue. The O II emission is very strong (EW Å) and unresolved in width.
153_2622 – Peculiar morphology and other part of 153_2422 system.
153_5853 – The photo-bulge is small, faint, and blue. This galaxy is a good candidate to belong to the compact narrow emission line galaxy (CNELG) class. Its photo-B/T may be overestimated by a large systematic error of 0.14 as discussed in section 2.1.
163_4865* – Its photo-bulge color is unphysically red (), but has large random errors and may be affected by a dust.
164_6109* – One of two luminous () photo-bulges that are not very red, but only barely, with . The photo-disk has blue colors and emission lines are detected with the width unresolved, i.e. .
174_4356* – Has the very bluest photo-bulge in the quality sample, a low pB/T ratio, and a less red photo-disk. The galaxy has asymmetrical subcomponents.
183_2970* – Very blue, peculiar galaxy in a complex system. The photo-bulge, the 2nd bluest among the quality sample, is however much larger than the very blue photo-disk. Strong emission lines of EW Å are unresolved though seen with a tilt in the 2-D sky-substracted image of the spectrum.
184_6971 – This very blue galaxy has been assumed to be one part of a very blue, close triple system. The photo-bulge is measuerd to be much larger than the photo-disk. Emission lines are very strong (EW (Å) and resolved at about 80 .
193_1838* – This galaxy has an especially prominent spiral structure. The photo-bulge color of is just below the very red threshold. The photo-disk is blue and the system has a low .
203_4339* – This is the 7th most luminous galaxy with both components very red. Emission lines are observed (Å) with velocity width barely resolved ().
212_1030* – One of 7 photo-bulges more luminous than that are not very red. It has and is in the blue E-S0 sample of Im et al. (2001). The object is one in a string of several blobs (see Fig. 14). Presence of emission lines is uncertain.
222_2555* – This very red galaxy has a very red photo-bulge that is measured to be larger than the less red photo-disk. The pB/T is greater than 0.7 and thus still included in the quality sample.
273_4427 – This object is in the possible blue E-S0 sample of Im et al. (2001). The photo-disk is very blue, more luminous, and much smaller than the photo-bulge. This galaxy is a good candidate to belong to the compact narrow emission line galaxy (CNELG) class. The strong emission lines have a velocity width of .
273_7619 – The photo-bulge is not very red, but the galaxy has a very tiny (0.1 arcsec disk scale length), very-red photo-disk. Thus the true bulge is actually very red (see Fig. 14).
274_5920* – This is the most luminous galaxy and has the most luminous photo-disk in our spectroscopic sample of 205 at redshifts between 0.73 and 1.04. The two subcomponents are roughly equal in luminosity and both are very red. No emission lines are detected.
282_5737* – This galaxy has a much redder, fainter, and smaller photo-disk than photo-bulge.
283_5331* – This very red galaxy has a very red photo-bulge. Though the photo-bulge is larger than the blue photo-disk, the pB/T is 0.75 and thus the bulge was included in the quality sample.
283_6152* – This the the 10th most luminous galaxy in which the photo-bulge and photo-disk are both very red. The photo-bulge is tiny and has an eccentricity at the limit of 0.70. Emission lines of Å are unresolved.
292_0936 – The pB/T is 0.12, the lowest in the total 86 bulge sample. The photo-bulge is still very red (, but has large errors of 0.25 mag in ) and the photo-disk is blue ().
292_6262* – Both components are very red with a pB/T of 0.32. No emission lines are seen.
294_2078* – This blue galaxy, like 092_1339, is in the blue E-S0 sample of Im et al. (2001), but it has a rotation curve and appears to be a spiral. The photo-bulge is nonetheless very red while the photo-disk is very blue. This is an excellent example of the confusion regarding bulge colors when subcomponents are not separated.
303_1249* – Both components are very red, with pB/T of 0.44. Emission lines are observed (Å) to be unresolved.
303_4538 – The blue photo-bulge is much larger than the very red photo-disk, which is the more likely counterpart to the true bulge.
313_4845 – Its photo-B/T may be overestimated by 0.11 as discussed in section 2.1.
313_7453* – This photo-bulge with is the third bluest in the quality sample (after 183_2970 and 174_4356), but it has a redder photo-disk. The morphology shows a central kidney-bean shaped component. The galaxy is relatively compact for its blue color and may qualify as a compact narrow emission line galaxy (CNELG). The O II emission line is strong (Å) and is unresolved.
References
- Abraham et al. (1999) Abraham, R. G., Ellis, R. S., Fabian, A. C., Tanvir, N. R., & Glazebrook, K. 1999, MNRAS, 303, 641
- Andredakis et al. (1995) Andredakis, Y. C., Peletier, R. F., & Balcells, M. 1995, MNRAS, 275, 874
- Baggett et al. (1998) Baggett, W. E., Baggett, S. M., & Anderson, K. S. J. 1998, AJ, 116, 1626
- Balcells & Peletier (1994) Balcells, M., & Peletier, R. F. 1994, AJ, 107, 135
- Baugh et al. (1996) Baugh, C., Cole, S., & Frenk, C. S. 1996, MNRAS, 283, 1361
- Beers, Flynn, & Gebhardt (1990) Beers, T. C., Flynn, K., & Gebhardt, K. 1990, AJ, 100, 32
- Bell et al. (2004) Bell, E. F., et al. ApJ, 608, 752
- Bender et al. (1992) Bender, R., Burstein, D., & Faber, S.M. 1992, ApJ, 399, 462
- Benson et al. (2002) Benson, A. J., Frenk, C. S., & Sharples, R. M. 2002, ApJ, 574, 104
- Bernardi et al. (2003a) Bernardi, M., et al. 2003, ApJ, 125, 1849
- Bernardi et al. (2003b) Bernardi, M., et al. 2003, ApJ, 125, 1882
- Bertin & Arnouts (1996) Bertin, E., & Arnouts, S. 1996, A&AS, 117, 393
- Bouchet et al. (1985) Bouchet, P., Lequeux, J., Maurice, E., Prevot, L., Prevot-Burnichon, M. L. 1985, A&A, 149, 330
- Bouwens et al. (1997) Bouwens, R. J., Cayón, L., & Silk, J. 1997, ApJ, 489, 21
- Bouwens et al. (1999) Bouwens, R. J., Cayón, L., & Silk, J. 1999, ApJ, 516, 77
- Bower et al. (1992) Bower, R. G., Lucey, J. R., & Ellis, R. S. 1992, MNRAS, 254, 601
- Broadhurst & Bouwens (2000) Broadhurst, T., & Bouwens, R. J. 2000, ApJ, 530, L53
- Bruzual & Charlot (2003) Bruzual A., G., & Charlot, S. 2003, MNRAS, 344, 1000
- Burstein et al. (1987) Burstein, D., Davies, R. L., Dressler, A., Faber, S. M., Stone, R. P. S., Lynden-Bell, D., Terlevich, R. J., Wegner, G. 1987, ApJS, 64, 601
- Burstein et al. (1997) Burstein, D., Bender, R., Faber, S. M., & Nolthenius, R. 1997, AJ, 114, 1365
- Cardiel et al. (2003) Cardiel, N., Elbaz, D., Schiavon, R. P., Willmer, C. N. A., Koo, D. C., Phillips, A. C., & Gallego, J. 2003, ApJ, 584, 76
- Carollo (2004) Carollo, C. M. 2004, Carnegie Observatory Astrophysics Series, Vol 1, ed. L. C. Ho (Cambridge: Cambridge University Press), 232
- Charlot et al. (1996) Charlot, S., Worthey, G., & Bressan, A. 1996, ApJ, 457, 625
- Cole et al. (2000) Cole, S., Lacey, C. G., Baugh, C. M., & Frenk, C. S. 2000, MNRAS, 319, 168
- Coleman et al. (1999) Coleman, G. D., Wu, C.-C., and Weedman, D. W. 1980, ApJS, 43, 393
- Combes (2000) Combes, F. 2000, in proceedings of ”Building Galaxies; from the Primordial Universe to the Present” from the XIXth Rencontres de Moriond, eds. F. Hammer, T.X. Thuan, V. Cayatte, B. Guiderdoni and J.T. Thanh Van. (Singapore: World Scientific Pub. Co.), p. 413
- Courteau et al. (1996) Courteau, S., de Jong, R. S., & Broeils, A. H. 1996, ApJ, 457, 73
- Crampton et al. (1996) Crampton, D., Le Fèvre, O., Hammer, F., & Lilly, S. J. 1996, A&A, 307, L53
- Cross et al. (2001) Cross, N., et al. 2001, MNRAS, 324, 825
- Davis et al. (2003) Davis, M. et al. 2003, SPIE, 4834, 161
- de Jong (1994) de Jong, R. S. 1994, Ph. D. Thesis, Leiden, Netherlands
- de Jong (1996a) de Jong, R. S. 1996, A&A, 313, 377
- de Jong (1996b) de Jong, R. S. 1996, A&A Suppl., 118, 557
- Dressler et al. (1997) Dressler, A., Oemler, A. Jr., Couch, W. J., et al. 1997, ApJ, 490, 577
- Eggen et al. (1962) Eggen, O. J., Lynden-Bell, D., & Sandage, A. 1962, ApJ, 136, 748
- Ellis et al. (2001) Ellis, R. S., Abraham, R. G., and Dickinson, M. E. 2001, ApJ, 551, 111
- Faber et al. (2003) Faber, S. M., et al. 2003, SPIE, 4841, 1657
- Fasano et al. (2000) Fasano, G., Poggianti, B. M., Couch, W. J., Bettoni, D., Kjaergaard, P., & Moles, M., 2000, ApJ, 542, 673
- Ferrarese & Merritt (2000) Ferrarese, L., & Merritt, D. 2000, ApJ, 539, L9
- Ferreras, Scannapieco, & Silk (2002) Ferreras, I., Scannapieco, E., & Silk, J. 2002, ApJ, 579, 247
- Fomalont et al. (1991) Fomalont, E. B., Windhorst, R. A.,
- Franceschini et al. (1998) Franceschini, A., Silva, L., Fasano, G., Granato, G. L., Bressan, A., Arnouts, S., & Danese, L. 1998, ApJ, 506, 600
- Fukugita et al. (1995) Fukugita, M., Shimasaku, K., & Ichikawa, T. 1995, PASP, 107, 945
- Fukugita et al. (1998) Fukugita, M., Hogan, C. J., & Peebles, P. J. E. 1998, ApJ, 503, 518
- Gebhardt et al. (2000) Gebhardt, K., et al. 2000, ApJ, 539, L13
- Gebhardt et al. (2003) Gebhardt, K., et al. 2003, ApJ, 597, 239 (GSS9)
- Guzmán et al. (1998) Guzmán, R., Jangren, A., Koo, D. C., Bershady, M., & Simard, L. 1998, ApJ, 495, 13
- Im et al. (2001) Im, M., et al. 2001, AJ, 122, 750
- Im et al. (2002) Im, M., et al. 2002, ApJ, 571, 136 (GSS10)
- Jansen et al. (2000) Jansen, R. A., Franx, M., Fabricant, D. G., & Caldwell, N. 2000, ApJS, 126, 271
- Jansen et al. (2001) Jansen, R. A., Franx, M., & Fabricant, D. G. 2001, ApJ, 551, 825
- Kauffmann (1996) Kauffmann, G. 1996, MNRAS, 281, 487
- Kauffmann et al. (1996) Kauffmann, G., Charlot, S., & White, S. D. M. 1996, MNRAS, 283, L117
- Kauffmann et al. (1999) Kauffmann, G., Colberg, J. M., Deaferio, A., & White, S. D. M. 1999, MNRAS, 303, 188
- Kennicutt (1998) Kennicutt, R. C., Jr. 1998, ARA&A, 36, 189
- Kinney et al. (1996) Kinney, A. L., Calzzeti, D., Bohlin, R. C., et al. 1996, ApJ, 467, 38
- Kodama et al. (1999) Kodama, T., Bower, R. G., & Bell, E. F. 1999, MNRAS, 306, 561
- Koo (1986) Koo, D. C. 1986, ApJ, 311, 651
- Koo (1998) Koo, D. C. 1998, in Proceedings of IAU 23 Joint Discussion 11: “Redshift Surveys in the 21st Century”, ed. A. P. Fairall (Dordrecht: Kluwer), 468
- Koo et al. (1996) Koo, D. C., et al. 1996, ApJ, 469, 535
- Kormendy (1977) Kormendy, J. 1977, ApJ, 217, 406
- Kormendy (1985) Kormendy, J. 1985, ApJ, 295, 73
- Labbe et al. (2003) Labbe, I., et al. 2003, ApJ, 591, L95
- Le Fèvre et al. (1994) Le Fèvre, O., Crampton, D., Hammer, F., Lilly, S. J., & Tresse, L. 1994, ApJ, 423, L89
- Lilly et al. (1995) Lilly, S. J., Hammer, F., Le Fèvre, O., & Crampton, D. 1995, ApJ, 455, 75
- Lin & Faber (1983) Lin, D. N. C., & Faber, S. M. 1983, ApJ, 266, 17
- Lin et al. (1999) Lin, H., Yee, H. K. C., Carlberg, R. G., Morris, S. L., Sawicki, M., Patton, D. R., Wirth, G., Shepherd, C. W. 1999, ApJ, 518, 533
- Liske et al. (2003) Liske, J., Lemon, D. J., Driver, S. P., Cross, N. J. G., & Couch, W. J. 2003, MNRAS, 344, 307 N.
- MacArthur et al. (2003) MacArthur, L. A., Courteau, S., & Holtzman, J. A. 2003, ApJ, 582, 689
- Magorrian et al. (1998) Magorrian, J., et al. 1998, AJ, 115, 2285
- Marleau & Simard (1998) Marleau, F. R., & Simard, L. 1998, ApJ, 505, 585
- Mathews & Brighenti (1999) Mathews, W. G., & Brighenti, F. 1999, ApJ, 527, L31
- Menanteau et al. (2001) Menanteau, F., Abraham, R. G., & Ellis, R. S. 2001, MNRAS, 322, 1
- Navarro & White (1994) Navarro, J. F., & White, S. D. M. 1994, MNRAS, 267, 401
- Oke et al. (1995) Oke, J. B., et al. 1995, PASP, 107, 375
- Ostrander et al. (1998) Ostrander, E. J., Nichol, R. C., Ratnatunga, K. U., & Griffiths, R. E. 1998, AJ, 116, 2644
- Peletier & Balcells (1996) Peletier, R. F., & Balcells, M. 1996, AJ, 111, 2238
- Peletier et al. (1999) Peletier, R. F., Balcells, M., Davies, R. L., Andredakis, Y., Vazdekis, A., Burkert, A., & Prada, F. 1999, MNRAS, 310, 703
- Phillips et al. (1997) Phillips, A. C., Guzmán, R., Gallego, J., Koo, D. C., Lowenthal, J. D., Vogt, N. P., Faber, S. M., & Illingworth, G. D. 1997, ApJ, 489, 543
- Prugniel & Héraudeau (1998) Prugniel, P., & Héraudeau, P. 1998, A&AS, 128, 299
- Ratnatunga et al. (1999) Ratnatunga, K. U., Griffiths, R. E., & Ostrander E. J. 1999, AJ, 117, 2010
- Rhodes, Refregier, & Groth (2000) Rhodes, J., Refregier, A., & Groth, E. J. 2000, ApJ, 536, 79
- Schade et al. (1999) Schade, D., et al. 1999, ApJ, 525, 31
- Schechter & Dressler (1987) Schechter, P. L., & Dressler, A. 1987, AJ, 94, 563
- Schlegel, Finkbeiner, & Davis (1998) Schlegel, D. J., Finkbeiner, D. P., & Davis, M. 1998, ApJ, 500, 525
- Schweizer & Seitzer (1992) Schweizer, F., & Seitzer, P. 1992, AJ, 104, 1039
- Simard (1998) Simard, L. 1998, ASP Conf. Ser. 145, Astronomical Data Analysis Software Systems VII, eds. Albrecht, R., Hook, R. N. and Bushouse, H. A. (San Francisco, ASP) 108
- Simard et al. (1999) Simard, L., et al. 1999, ApJ, 519, 563
- Simard et al. (2002) Simard, L., et al. 2002, ApJS, 142, 1 (GSS2)
- Somerville et al. (1999) Somerville, R. S., & Primack, J. R. 1999, MNRAS, 310, 1087
- Stanford et al. (1998) Stanford, S. A., Eisenhardt, P. R., & Dickinson, M. 1998, ApJ, 492, 461
- Stanford et al. (2004) Stanford, S. A., et al. 2004, ApJ, 127, 131
- Strateva et al. (2001) Strateva, I., et al. 2001, AJ, 122, 1861
- Tamura et al. (2000) Tamura, N., Kobayashi, C., Arimoto, N., Kodama, T., & Ohta, K. 2000, AJ, 119, 2134
- Tasca & White (2003) Tasca, L., & White, S. D. M. 2003, in preparation
- Terlevich et al. (1998) Terlevich, A. I., Caldwell, N., & Bower, R. G. 2001, MNRAS, 326, 1547
- Toomre & Toomre (1972) Toomre, A. & Toomre, J. 1972, ApJ, 178, 623
- Trager et al. (2000) Trager, S. C., Faber, S. M., Worthey, G., González, J. J. 2000, AJ, 120, 165
- Treu et al. (2002) Treu, T., Stiavelli, M., Casertano, S., Moller, P., & Bertin, G. 2002, ApJ, 564, 13
- Tully & Fouqué (1985) Tully, R. B., & Fouqué, P. 1985, ApJS, 58, 67
- van Dokkum et al. (2000) van Dokkum, P. G., Franx, M., Fabricant, D., Illingworth, G. D., & Kelson, D. 2000, ApJ, 541, 95
- van Dokkum & Franx (2001) van Dokkum, P. G., & Franx, M. 2001, ApJ, 553, 90
- van Dokkum & Ellis (2003) van Dokkum, P. G., & Ellis, R. S. 2003, ApJ, 592, L53
- Vogt et al. (1996) Vogt, N. P., Forbes, D. A., Phillips, A. C., Gronwall, C., Faber, S. M., Illingworth, G. D., & Koo, D. C. 1996, ApJ, 465, 15
- Vogt et al. (2004) Vogt, N. P., et al. 2004, in preparation (GSS1)
- Weiner et al. (2004) Weiner, B. J. et al. 2004, ApJ, in press, astro-ph/0411128 (GSS3)
- Willis et al. (2002) Willis, J. P., Hewett, P. C., Warren, S. J., & Lewis, G. F. 2003, MNRAS, 337, 953
- Willmer et al. (2004) Willmer, C. N. A., et al. 2004, in preparation
- Wyse et al. (1997) Wyse, R. F. G., Gilmore, G., & Franx, M. 1997, ARA&A, 35, 637
| No. | Source ID | R.A. | Dec. | Notes | ||||||||||
|---|---|---|---|---|---|---|---|---|---|---|---|---|---|---|
| J2000 | J2000 | Bulge | Gal. | Bulge | Gal. | Aper. | px | px | ||||||
| (1) | (2) | (3) | (4) | (5) | (6) | (7) | (8) | (9) | (10) | (11) | (12) | (13) | (14) | (15) |
| 1* | 052_6543 | 14:17:48.28 | 52:31:17.2 | 21.20 | 20.31 | 1.80 | 1.84 | 1.95 | 1.93 | 6.34 | 0.755 | 4.0 | 2.2 | ef |
| 2* | 062_2060 | 14:17:45.99 | 52:30:32.1 | 22.04 | 21.16 | 2.04 | 2.12 | 2.21 | 2.30 | 3.53 | 0.985 | 4.0 | 2.6 | cde |
| 3 | 062_6465 | 14:17:41.22 | 52:30:26.9 | 22.62 | 21.89 | 3.99 | 1.69 | 1.61 | 4.25 | 2.67 | 1.020 | 2.9 | 3.7 | dg |
| 4* | 062_6859 | 14:17:40.93 | 52:30:21.1 | 22.52 | 21.91 | 2.41 | 2.39 | 2.21 | 1.61 | 3.12 | 0.987 | 2.9 | 3.5 | cf |
| 5* | 064_3021 | 14:17:52.03 | 52:29:29.3 | 21.60 | 21.13 | 1.61 | 1.97 | 2.10 | 3.36 | 5.04 | 0.997 | 3.0 | 1.7 | bcdf |
| 6 | 064_4412 | 14:17:53.41 | 52:29:41.1 | 23.73 | 22.33 | 1.47 | 1.36 | 1.89 | 7.14 | 9.38 | 0.988 | 3.0 | 6.0 | |
| 7 | 064_4442 | 14:17:54.04 | 52:29:11.3 | 23.86 | 21.97 | 3.87 | 1.04 | 1.54 | 6.29 | 6.31 | 0.878 | 3.0 | 6.2 | h |
| 8 | 064_4813 | 14:17:53.75 | 52:29:41.0 | 23.65 | 21.85 | 2.89 | 1.20 | 1.44 | 5.90 | 6.49 | 0.986 | 3.0 | 5.8 | h |
| 9* | 073_1809 | 14:17:42.50 | 52:28:45.0 | 22.86 | 21.34 | 1.37 | 1.32 | 1.43 | 3.38 | 5.15 | 0.830 | 4.0 | 4.2 | |
| 10 | 073_2675 | 14:17:49.32 | 52:29:07.5 | 23.47 | 22.29 | 2.46 | 2.02 | 2.08 | 0.29 | 1.65 | 0.809 | 3.0 | 5.4 | e |
| 11 | 073_4569 | 14:17:48.32 | 52:29:24.1 | 23.73 | 22.53 | 2.29 | 1.63 | 1.60 | 5.96 | 4.40 | 0.997 | 3.0 | 6.0 | d |
| 12 | 073_7749 | 14:17:45.47 | 52:29:50.8 | 22.32 | 21.06 | 6.50 | 1.96 | 1.91 | 5.33 | 3.14 | 0.873 | 3.0 | 3.1 | de |
| 13* | 074_6044 | 14:17:49.23 | 52:28:02.7 | 21.52 | 21.14 | 2.37 | 2.26 | 2.42 | 10.63 | 7.38 | 0.997 | 3.0 | 1.5 | df |
| 14* | 074_6844 | 14:17:50.04 | 52:28:04.8 | 22.70 | 21.87 | 2.08 | 1.97 | 2.06 | 0.49 | 1.59 | 0.972 | 3.0 | 3.9 | d |
| 15* | 084_1138 | 14:17:37.26 | 52:26:49.7 | 21.54 | 20.67 | 2.35 | 1.55 | 2.01 | 1.79 | 6.73 | 0.812 | 3.0 | 1.6 | cde |
| 16* | 084_2525 | 14:17:38.53 | 52:27:05.6 | 22.68 | 21.76 | 1.76 | 1.99 | 2.20 | 1.36 | 3.81 | 0.812 | 3.0 | 3.9 | f |
| 17 | 084_4515 | 14:17:40.43 | 52:27:19.4 | 23.39 | 22.20 | 3.89 | 1.42 | 1.46 | 3.33 | 3.20 | 0.811 | 3.8 | 5.3 | d |
| 18 | 084_5452 | 14:17:42.11 | 52:26:45.7 | 23.47 | 21.25 | 0.57 | 1.27 | 1.43 | 3.99 | 4.09 | 0.748 | 3.0 | 5.4 | h |
| 19* | 092_1339 | 14:17:27.59 | 52:26:45.1 | 21.56 | 21.40 | 1.70 | 1.30 | 1.15 | 2.93 | 2.59 | 0.903 | 3.0 | 1.6 | cdfg |
| 20* | 092_2023 | 14:17:27.25 | 52:26:27.5 | 21.91 | 21.73 | 3.14 | 2.09 | 2.03 | 0.99 | 1.20 | 0.987 | 3.0 | 2.3 | de |
| 21 | 092_3358 | 14:17:25.06 | 52:26:58.9 | 22.73 | 21.47 | 1.07 | 1.43 | 1.41 | 6.70 | 4.43 | 0.901 | 4.0 | 4.0 | d |
| 22 | 092_6027 | 14:17:22.87 | 52:26:22.4 | 23.42 | 22.90 | 2.24 | 1.98 | 2.06 | 1.83 | 1.79 | 0.900 | 3.0 | 5.3 | |
| 23 | 092_7241 | 14:17:21.32 | 52:26:34.2 | 22.77 | 21.77 | 0.94 | 1.23 | 1.08 | 6.25 | 4.92 | 0.768 | 3.0 | 4.0 | |
| 24 | 093_1325 | 14:17:31.18 | 52:26:25.2 | 23.29 | 22.76 | 2.20 | 2.17 | 2.07 | 1.69 | 0.99 | 0.814 | 3.0 | 5.1 | d |
| 25 | 093_2268 | 14:17:35.58 | 52:26:42.8 | 22.53 | 22.03 | 1.95 | 1.48 | 1.34 | 9.91 | 10.29 | 0.786 | 3.0 | 3.6 | d |
| 26* | 093_2327 | 14:17:31.20 | 52:26:35.3 | 21.37 | 20.42 | 2.43 | 1.80 | 2.13 | 1.65 | 6.75 | 0.743 | 2.9 | 2.2 | |
| 27* | 093_2470 | 14:17:35.74 | 52:26:45.7 | 20.39 | 19.69 | 2.30 | 1.83 | 2.15 | 4.96 | 11.29 | 0.811 | 5.0 | 2.7 | acdef |
| 28* | 093_3251 | 14:17:33.57 | 52:26:49.2 | 21.86 | 21.70 | 2.29 | 1.24 | 1.86 | 4.39 | 4.63 | 0.836 | 3.2 | 2.2 | cd |
| 29* | 094_1313 | 14:17:30.43 | 52:26:04.9 | 23.04 | 22.82 | 2.29 | 1.86 | 1.94 | 1.69 | 1.82 | 0.903 | 3.0 | 4.6 | d |
| 30 | 094_2210 | 14:17:31.31 | 52:26:08.8 | 23.39 | 21.21 | 5.91 | 1.34 | 2.08 | 3.34 | 13.21 | 0.900 | 3.0 | 5.3 | dh |
| 31* | 094_2559 | 14:17:32.75 | 52:25:22.6 | 22.66 | 21.38 | 2.06 | 1.98 | 2.25 | 2.02 | 9.24 | 0.903 | 3.0 | 3.8 | |
| 32* | 094_2660 | 14:17:32.87 | 52:25:21.7 | 21.64 | 20.69 | 2.25 | 2.12 | 2.26 | 2.40 | 8.87 | 0.903 | 3.0 | 1.8 | def |
| 33* | 094_2762 | 14:17:32.97 | 52:25:19.9 | 21.96 | 21.31 | 1.66 | 1.87 | 2.04 | 1.73 | 4.58 | 0.902 | 2.9 | 2.4 | f |
| 34 | 094_4009 | 14:17:33.14 | 52:26:14.7 | 23.83 | 22.99 | 0.81 | 1.21 | 0.82 | 5.48 | 6.34 | 0.988 | 3.0 | 6.2 | d |
| 35* | 094_4767 | 14:17:35.22 | 52:25:19.8 | 22.83 | 21.40 | 0.81 | 1.44 | 1.44 | 3.16 | 7.33 | 0.749 | 5.0 | 4.2 | d |
| 36* | 094_6234 | 14:17:36.04 | 52:25:54.7 | 21.83 | 21.79 | 1.99 | 1.97 | 2.16 | 2.85 | 2.92 | 0.803 | 3.0 | 2.2 | f |
| 37 | 094_7063 | 14:17:37.63 | 52:25:27.9 | 23.58 | 21.44 | 3.38 | 1.81 | 2.24 | 2.20 | 18.27 | 0.905 | 3.0 | 5.7 | h |
| 38* | 103_2074 | 14:17:29.70 | 52:25:32.5 | 22.01 | 21.79 | 2.55 | 2.42 | 2.22 | 5.24 | 6.12 | 1.023 | 3.0 | 2.5 | de |
| 39 | 103_2974 | 14:17:29.50 | 52:25:40.9 | 24.06 | 22.27 | 3.93 | 1.96 | 2.20 | 4.98 | 3.13 | 0.903 | 3.0 | 6.6 | dh |
| 40* | 103_4766 | 14:17:28.26 | 52:25:57.2 | 21.96 | 21.10 | 2.12 | 2.04 | 2.23 | 0.43 | 1.99 | 0.812 | 3.0 | 2.4 | def |
| 41* | 103_7221 | 14:17:22.87 | 52:26:11.0 | 21.46 | 20.79 | 1.86 | 2.06 | 2.31 | 4.70 | 6.83 | 0.901 | 4.0 | 2.2 | ef |
| 42* | 104_6432 | 14:17:29.77 | 52:24:46.9 | 22.88 | 22.47 | 0.89 | 1.21 | 1.11 | 4.04 | 2.60 | 0.991 | 3.0 | 4.3 | d |
| 43* | 112_5966 | 14:17:08.99 | 52:24:40.9 | 22.33 | 20.91 | 2.29 | 1.80 | 2.09 | 0.71 | 4.87 | 0.821 | 4.0 | 3.2 | d |
| 44* | 113_3311 | 14:17:16.22 | 52:24:21.3 | 20.77 | 20.50 | 2.12 | 1.97 | 2.07 | 7.82 | 5.38 | 0.812 | 4.0 | 2.7 | def |
| 45* | 113_3646 | 14:17:19.88 | 52:24:32.0 | 23.24 | 22.55 | 1.68 | 2.03 | 2.04 | 2.23 | 1.34 | 0.904 | 3.0 | 5.0 | |
| 46 | 124_2009 | 14:17:11.59 | 52:22:40.0 | 23.17 | 21.85 | 0.97 | 1.14 | 1.00 | 8.62 | 8.50 | 1.036 | 3.0 | 4.8 | d |
| 47* | 134_4363 | 14:17:08.57 | 52:20:42.2 | 22.10 | 21.97 | 2.41 | 1.69 | 1.82 | 2.52 | 2.68 | 0.997 | 3.0 | 2.7 | |
| 48* | 142_4347 | 14:16:51.56 | 52:20:55.9 | 22.28 | 21.29 | 2.02 | 1.90 | 2.02 | 1.26 | 6.16 | 0.809 | 3.0 | 3.1 | |
| 49* | 143_2770 | 14:17:03.11 | 52:20:58.0 | 21.93 | 21.39 | 1.56 | 1.93 | 2.20 | 1.57 | 2.94 | 0.812 | 3.0 | 2.4 | f |
| 50 | 144_1141 | 14:16:58.19 | 52:19:46.6 | 23.56 | 21.45 | 2.17 | 1.69 | 1.91 | 0.49 | 4.09 | 0.813 | 2.9 | 5.6 | dh |
| 51* | 152_2736 | 14:16:47.09 | 52:19:38.8 | 22.80 | 22.35 | 4.34 | 1.94 | 1.83 | 3.33 | 3.57 | 0.812 | 4.0 | 4.1 | |
| 52 | 152_3226 | 14:16:46.84 | 52:19:28.7 | 23.04 | 22.08 | 0.76 | 0.94 | 1.17 | 7.45 | 5.72 | 0.812 | 5.0 | 4.6 | |
| 53* | 152_5051 | 14:16:44.33 | 52:19:48.8 | 21.25 | 20.32 | 6.27 | 1.71 | 2.19 | 8.48 | 9.68 | 0.809 | 3.0 | 2.2 | d |
| 54 | 153_0432 | 14:16:53.17 | 52:19:18.5 | 23.68 | 22.65 | 1.43 | 2.06 | 2.29 | 1.44 | 2.16 | 0.999 | 2.9 | 5.9 | |
| 55 | 153_2422 | 14:16:51.55 | 52:19:36.1 | 21.76 | 21.24 | 1.15 | 1.11 | 1.16 | 7.53 | 3.93 | 0.807 | 3.0 | 2.0 | |
| 56 | 153_2622 | 14:16:51.54 | 52:19:37.0 | 23.24 | 22.04 | 1.34 | 1.00 | 0.88 | 4.31 | 6.82 | 0.807 | 3.0 | 5.0 | |
| 57 | 153_5853 | 14:16:54.08 | 52:20:14.8 | 23.52 | 23.08 | 1.19 | 1.33 | 1.31 | 2.47 | 1.09 | 0.989 | 3.0 | 5.5 | d |
| 58 | 154_1435 | 14:16:52.01 | 52:18:44.4 | 23.85 | 22.25 | -0.42 | 0.77 | 0.82 | 2.15 | 3.09 | 0.933 | 4.0 | 6.2 | |
| 59 | 163_3159 | 14:16:48.86 | 52:18:40.1 | 23.45 | 22.37 | 2.06 | 1.24 | 1.30 | 2.68 | 2.43 | 0.809 | 3.0 | 5.4 | |
| 60* | 163_4865 | 14:16:49.09 | 52:18:57.8 | 22.33 | 20.94 | 2.38 | 1.59 | 1.95 | 5.42 | 7.11 | 0.810 | 4.0 | 3.2 | |
| 61* | 164_6109 | 14:16:49.86 | 52:18:09.1 | 21.55 | 20.66 | 1.19 | 1.50 | 1.71 | 4.36 | 6.64 | 0.808 | 3.0 | 1.6 | d |
| 62* | 174_4356 | 14:16:42.56 | 52:16:09.6 | 22.34 | 20.99 | 0.38 | 1.18 | 0.96 | 8.28 | 5.44 | 0.810 | 3.0 | 3.2 | |
| 63* | 183_2970 | 14:16:37.11 | 52:16:21.9 | 22.89 | 22.03 | 0.13 | 0.59 | 0.75 | 4.75 | 5.39 | 1.028 | 3.0 | 4.3 | |
| 64 | 184_6971 | 14:16:39.13 | 52:14:52.1 | 23.64 | 21.85 | 1.05 | 0.87 | 0.73 | 4.06 | 2.04 | 0.868 | 5.0 | 5.8 | h |
| 65* | 193_1227 | 14:16:26.47 | 52:14:45.9 | 21.51 | 21.18 | 2.07 | 2.01 | 2.20 | 2.45 | 3.61 | 0.799 | 4.5 | 1.5 | ef |
| 66* | 193_1838 | 14:16:27.46 | 52:14:53.4 | 22.82 | 21.22 | 1.38 | 1.46 | 1.60 | 6.34 | 9.95 | 0.931 | 3.0 | 4.1 | |
| 67* | 203_4339 | 14:16:20.52 | 52:14:07.4 | 21.80 | 20.38 | 1.82 | 1.95 | 2.20 | 1.25 | 6.01 | 0.813 | 4.6 | 2.1 | e |
| 68* | 212_1030 | 14:16:10.23 | 52:12:37.1 | 22.01 | 21.63 | 2.67 | 1.58 | 1.75 | 2.59 | 4.39 | 0.878 | 2.9 | 2.5 | dg |
| 69* | 222_2555 | 14:16:01.64 | 52:11:47.3 | 22.60 | 22.22 | 2.31 | 2.08 | 2.03 | 3.92 | 3.09 | 0.869 | 3.0 | 3.7 | d |
| 70 | 233_5614 | 14:15:58.12 | 52:10:43.7 | 23.38 | 22.32 | 0.90 | 1.15 | 1.12 | 4.78 | 6.14 | 0.988 | 3.0 | 5.3 | |
| 71 | 273_4427 | 14:15:34.14 | 52:05:54.0 | 22.54 | 21.56 | 0.05 | 0.90 | 0.81 | 3.73 | 1.45 | 0.989 | 4.0 | 3.6 | dg |
| 72* | 273_5056 | 14:15:37.12 | 52:06:06.4 | 22.80 | 22.36 | 1.52 | 1.77 | 1.83 | 1.63 | 2.93 | 0.912 | 3.0 | 4.1 | |
| 73 | 273_7619 | 14:15:32.54 | 52:06:23.5 | 22.56 | 21.99 | 2.01 | 1.90 | 2.07 | 2.49 | 2.00 | 0.811 | 3.0 | 3.6 | d |
| 74* | 274_0837 | 14:15:33.89 | 52:04:39.2 | 22.08 | 21.92 | 1.84 | 1.79 | 2.05 | 1.46 | 1.81 | 0.742 | 2.9 | 2.7 | |
| 75* | 274_1220 | 14:15:33.91 | 52:04:56.7 | 23.06 | 22.42 | 1.63 | 1.94 | 2.10 | 2.13 | 2.43 | 0.810 | 3.0 | 4.6 | |
| 76* | 274_5920 | 14:15:38.89 | 52:05:06.6 | 20.40 | 19.63 | 2.20 | 2.03 | 2.22 | 3.83 | 10.81 | 0.811 | 4.5 | 2.7 | def |
| 77* | 282_5737 | 14:15:20.06 | 52:04:20.8 | 21.87 | 21.58 | 1.69 | 1.87 | 1.97 | 4.87 | 3.18 | 0.752 | 4.5 | 2.2 | f |
| 78* | 283_5331 | 14:15:28.00 | 52:04:53.1 | 21.04 | 20.69 | 2.16 | 2.04 | 1.61 | 10.36 | 6.98 | 0.809 | 4.0 | 2.2 | d |
| 79* | 283_6152 | 14:15:30.00 | 52:05:06.1 | 21.79 | 20.79 | 2.30 | 2.04 | 1.87 | 0.42 | 2.54 | 0.809 | 4.0 | 2.1 | de |
| 80 | 292_0936 | 14:15:18.73 | 52:03:21.1 | 22.87 | 20.93 | 3.34 | 1.43 | 1.73 | 7.05 | 14.46 | 0.871 | 2.9 | 4.2 | |
| 81* | 292_6262 | 14:15:12.62 | 52:03:34.5 | 22.75 | 21.75 | 1.32 | 1.97 | 2.18 | 1.08 | 2.67 | 0.829 | 3.2 | 4.0 | |
| 82* | 294_2078 | 14:15:23.22 | 52:01:41.6 | 22.53 | 21.96 | 3.23 | 1.44 | 1.61 | 5.61 | 5.50 | 0.929 | 3.0 | 3.6 | dfg |
| 83* | 303_1249 | 14:15:18.03 | 52:01:57.0 | 22.60 | 21.49 | 0.60 | 1.66 | 1.83 | 1.81 | 4.71 | 0.809 | 4.0 | 3.7 | |
| 84 | 303_4538 | 14:15:16.11 | 52:02:26.7 | 22.87 | 22.00 | 1.84 | 1.56 | 1.58 | 5.93 | 3.51 | 0.731 | 3.0 | 4.2 | d |
| 85 | 313_4845 | 14:15:10.34 | 52:01:20.7 | 23.68 | 23.11 | 1.09 | 0.87 | 1.21 | 2.85 | 3.52 | 0.952 | 2.9 | 5.9 | |
| 86* | 313_7453 | 14:15:10.53 | 52:01:47.9 | 22.66 | 21.77 | 1.20 | 1.27 | 1.26 | 2.64 | 3.08 | 0.767 | 3.0 | 3.8 | d |
Note. —
Col. (1): Sequence number ordered by source ID; galaxies with * belong to quality sample (see Section 3.4).
Col. (2): Source ID is given by FFC_XXYY, where FF is the subfield, C is the WFPC2 chip number, and XX and YY are the chip coordinates in units of 10 pixels (Koo et al. 1996).
Col. (3) & (4): J2000 coordinates from Rhodes et al. (2000).
Col. (5): magnitude in Vega system (as are all magnitudes) of the photo-bulge component.
Col. (6): Total magnitude of galaxy.
Col. (7): color of photo-bulge.
Col. (8): color of galaxy.
Col. (9): color within central 0.3 arcsec diameter aperture.
Col. (10): Half-light or effective radius of major axis of photo-bulge in units of pixels from image.
Col. (11): Half-light radius of galaxy measured along major axis in units of pixel from image.
Col. (12): Redshifts from Keck Telescope.
Col. (13): Redshift quality: 2.9 or greater are reliable.
Col. (14): Weight for volume density calculations relative to full GSS field area of 134 square arcmin, i.e., 2.0 means an incompleteness of 50%.
Col. (15): Notes:
a Quad lens (Ratnatunga et al., 1999; Crampton et al., 1996).
b Radio source 15V39 from Fomalont et al. 1991.
c 1 in Schade et al. (1999) as measured from HST ; measured from ground and .
d see Appendix C for additional comments.
e In Gebhardt et al. (2003: GSS9) sample for Fundamental Plane analysis.
f In Im et al. (2002: GSS10) sample of bright E-S0’s.
g In Im et al. (2001) sample of blue spheroid candidates.
h When selecting by , weights should be reduced by 2.2 (see Appendix A).
| No. | Source ID | ||||||||||||
|---|---|---|---|---|---|---|---|---|---|---|---|---|---|
| Gal. | Bulge | Disk | Gal. | Bulge | Disk | Bulge | Bulge | Disk | Disk | ||||
| (1) | (2) | (3) | (4) | (5) | (6) | (7) | (8) | (9) | (10) | (11) | (12) | (13) | (14) |
| 1* | 052_6543 | 20.31 | 21.18 | 20.95 | 0.45 | 1.87 | 2.01 | 1.77 | 0.20 | 0.47 | 0.65 | 13.67 | 1.034 |
| 1.009 | |||||||||||||
| 2* | 062_2060 | 21.11 | 21.72 | 22.01 | 0.57 | 2.23 | 2.25 | 2.21 | 0.30 | 0.46 | 0.26 | 65.60 | 1.087 |
| 1.003 | |||||||||||||
| 3 | 062_6465 | 21.91 | 22.62 | 22.69 | 0.51 | 1.69 | 3.58 | 1.00 | 0.30 | 0.10 | 0.15 | 42.91 | 1.008 |
| 1.035 | |||||||||||||
| 4* | 062_6859 | 21.89 | 22.33 | 23.07 | 0.66 | 2.34 | 2.26 | 2.49 | 0.20 | 0.27 | 0.32 | 62.92 | 0.982 |
| 1.011 | |||||||||||||
| 5* | 064_3021 | 21.12 | 21.56 | 22.29 | 0.66 | 2.06 | 2.16 | 1.86 | 0.34 | 0.46 | 0.51 | 26.35 | 1.006 |
| 1.050 | |||||||||||||
| 6 | 064_4412 | 22.24 | 23.35 | 22.74 | 0.36 | 1.64 | 3.18 | 1.26 | 0.83 | 0.33 | 0.66 | 77.16 | 1.013 |
| 1.038 | |||||||||||||
| 7 | 064_4442 | 21.87 | 23.41 | 22.17 | 0.24 | 1.18 | 3.00 | 0.95 | 0.63 | 0.16 | 0.44 | 58.52 | 1.023 |
| 1.053 | |||||||||||||
| 8 | 064_4813 | 21.83 | 23.32 | 22.15 | 0.25 | 1.23 | 3.49 | 0.95 | 0.63 | 0.07 | 0.40 | 36.46 | 1.122 |
| 1.124 | |||||||||||||
| 9* | 073_1809 | 21.31 | 22.53 | 21.72 | 0.32 | 1.34 | 1.69 | 1.24 | 0.46 | 0.61 | 0.33 | 2.80 | 1.440 |
| 1.466 | |||||||||||||
| 10 | 073_2675 | 22.29 | 23.45 | 22.75 | 0.34 | 2.01 | 2.35 | 1.87 | 0.03 | 0.68 | 0.15 | 26.74 | 1.085 |
| 1.133 | |||||||||||||
| 11 | 073_4569 | 22.48 | 23.53 | 23.00 | 0.38 | 1.68 | 2.39 | 1.39 | 0.64 | 0.04 | 0.25 | 72.88 | 1.140 |
| 1.127 | |||||||||||||
| 12 | 073_7749 | 21.04 | 22.39 | 21.42 | 0.29 | 1.89 | 2.43 | 1.73 | 0.69 | 0.06 | 0.16 | 60.81 | 1.365 |
| 1.214 | |||||||||||||
| 13* | 074_6044 | 21.14 | 21.54 | 22.41 | 0.69 | 2.34 | 2.41 | 2.22 | 1.07 | 0.00 | 0.29 | 65.36 | 1.025 |
| 1.020 | |||||||||||||
| 14* | 074_6844 | 21.91 | 22.70 | 22.62 | 0.48 | 1.89 | 2.41 | 1.57 | 0.06 | 0.70 | 0.16 | 41.25 | 1.249 |
| 1.194 | |||||||||||||
| 15* | 084_1138 | 20.65 | 21.56 | 21.26 | 0.43 | 1.67 | 2.13 | 1.42 | 0.17 | 0.24 | 0.81 | 43.13 | 1.018 |
| 1.062 | |||||||||||||
| 16* | 084_2525 | 21.73 | 22.32 | 22.66 | 0.57 | 2.07 | 2.37 | 1.77 | 0.22 | 0.53 | 0.39 | 79.14 | 0.991 |
| 0.998 | |||||||||||||
| 17 | 084_4515 | 22.09 | 23.00 | 22.71 | 0.44 | 1.57 | 3.33 | 1.04 | 0.45 | 0.06 | 0.20 | 68.08 | 1.103 |
| 1.140 | |||||||||||||
| 18 | 084_5452 | 21.25 | 23.37 | 21.42 | 0.14 | 1.34 | 3.13 | 1.20 | 0.24 | 0.19 | 0.24 | 58.67 | 1.244 |
| 1.269 | |||||||||||||
| 19* | 092_1339 | 21.37 | 21.55 | 23.41 | 0.85 | 1.35 | 1.63 | 0.48 | 0.34 | 0.25 | 0.06 | 9.41 | 1.030 |
| 1.048 | |||||||||||||
| 20* | 092_2023 | 21.75 | 22.01 | 23.43 | 0.79 | 2.03 | 2.29 | 1.41 | 0.09 | 0.69 | 0.17 | 83.13 | 1.036 |
| 1.026 | |||||||||||||
| 21 | 092_3358 | 21.42 | 22.39 | 22.00 | 0.41 | 1.48 | 1.47 | 1.48 | 0.69 | 0.55 | 0.24 | 74.17 | 1.059 |
| 1.066 | |||||||||||||
| 22 | 092_6027 | 22.90 | 23.15 | 24.60 | 0.78 | 2.02 | 2.35 | 1.26 | 0.17 | 0.36 | 0.14 | 54.07 | 0.995 |
| 0.938 | |||||||||||||
| 23 | 092_7241 | 21.80 | 22.83 | 22.34 | 0.38 | 1.10 | 0.65 | 1.55 | 0.61 | 0.18 | 0.26 | 68.56 | 1.023 |
| 1.054 | |||||||||||||
| 24 | 093_1325 | 22.76 | 23.33 | 23.74 | 0.59 | 2.08 | 2.03 | 2.16 | 0.17 | 0.12 | 0.03 | 30.01 | 0.938 |
| 0.980 | |||||||||||||
| 25 | 093_2268 | 22.09 | 22.62 | 23.10 | 0.61 | 1.29 | 1.39 | 1.18 | 1.03 | 0.08 | 0.49 | 24.17 | 1.033 |
| 1.032 | |||||||||||||
| 26* | 093_2327 | 20.41 | 21.36 | 21.00 | 0.42 | 1.83 | 2.27 | 1.59 | 0.17 | 0.07 | 0.73 | 39.36 | 1.142 |
| 1.084 | |||||||||||||
| 27* | 093_2470 | 19.68 | 20.38 | 20.48 | 0.52 | 1.88 | 2.24 | 1.58 | 0.50 | 0.24 | 1.18 | 52.21 | 1.030 |
| 1.062 | |||||||||||||
| 28* | 093_3251 | 21.64 | 22.22 | 22.59 | 0.59 | 1.36 | 2.02 | 0.83 | 0.30 | 0.54 | 0.65 | 54.30 | 0.989 |
| 1.022 | |||||||||||||
| 29* | 094_1313 | 22.77 | 22.84 | 25.88 | 0.95 | 1.94 | 2.41 | -0.10 | 0.20 | 0.69 | 0.09 | 28.78 | 0.996 |
| 0.987 | |||||||||||||
| 30 | 094_2210 | 21.19 | 23.53 | 21.32 | 0.11 | 1.47 | 4.76 | 1.35 | 0.29 | 0.66 | 0.89 | 64.97 | 1.081 |
| 1.072 | |||||||||||||
| 31* | 094_2559 | 21.38 | 22.68 | 21.78 | 0.30 | 2.00 | 2.37 | 1.86 | 0.19 | 0.08 | 0.84 | 35.07 | 0.965 |
| 1.001 | |||||||||||||
| 32* | 094_2660 | 20.68 | 21.62 | 21.29 | 0.43 | 2.12 | 2.36 | 1.97 | 0.25 | 0.20 | 0.92 | 43.37 | 0.976 |
| 0.993 | |||||||||||||
| 33* | 094_2762 | 21.31 | 21.93 | 22.19 | 0.56 | 1.88 | 2.15 | 1.63 | 0.17 | 0.32 | 0.66 | 58.60 | 1.075 |
| 0.999 | |||||||||||||
| 34 | 094_4009 | 22.86 | 23.53 | 23.71 | 0.54 | 1.23 | 0.79 | 2.23 | 0.57 | 0.65 | 0.43 | 21.66 | 1.038 |
| 1.056 | |||||||||||||
| 35* | 094_4767 | 21.44 | 22.86 | 21.77 | 0.27 | 1.44 | 1.47 | 1.45 | 0.29 | 0.32 | 0.49 | 62.56 | 1.138 |
| 1.079 | |||||||||||||
| 36* | 094_6234 | 21.76 | 21.85 | 24.56 | 0.92 | 2.06 | 2.25 | 0.85 | 0.27 | 0.59 | 0.44 | 62.01 | 0.958 |
| 1.036 | |||||||||||||
| 37 | 094_7063 | 21.44 | 23.43 | 21.62 | 0.15 | 1.82 | 2.53 | 1.72 | 0.28 | 0.67 | 1.29 | 79.42 | 1.023 |
| 1.006 | |||||||||||||
| 38* | 103_2074 | 21.76 | 21.82 | 24.89 | 0.94 | 2.29 | 2.30 | 2.15 | 0.68 | 0.63 | 0.18 | 81.43 | 1.019 |
| 0.993 | |||||||||||||
| 39 | 103_2974 | 22.20 | 23.46 | 22.63 | 0.32 | 1.98 | 3.90 | 1.62 | 0.55 | 0.62 | 0.17 | 8.08 | 1.030 |
| 1.005 | |||||||||||||
| 40* | 103_4766 | 21.10 | 22.01 | 21.70 | 0.43 | 2.06 | 2.14 | 2.00 | 0.04 | 0.69 | 0.24 | 74.73 | 1.037 |
| 1.029 | |||||||||||||
| 41* | 103_7221 | 20.74 | 21.16 | 21.94 | 0.67 | 2.25 | 2.46 | 1.90 | 0.60 | 0.12 | 0.57 | 31.60 | 0.999 |
| 0.990 | |||||||||||||
| 42* | 104_6432 | 22.54 | 22.82 | 24.15 | 0.77 | 1.15 | 0.94 | 2.55 | 0.20 | 0.34 | 0.11 | 30.15 | 1.091 |
| 1.059 | |||||||||||||
| 43* | 112_5966 | 20.90 | 22.40 | 21.22 | 0.25 | 1.84 | 2.28 | 1.72 | 0.06 | 0.07 | 0.39 | 32.99 | 1.021 |
| 1.005 | |||||||||||||
| 44* | 113_3311 | 20.50 | 20.76 | 22.15 | 0.78 | 2.05 | 2.10 | 1.87 | 0.75 | 0.53 | 0.17 | 66.20 | 1.036 |
| 1.008 | |||||||||||||
| 45* | 113_3646 | 22.59 | 22.90 | 24.10 | 0.75 | 2.04 | 1.96 | 2.65 | 0.12 | 0.53 | 0.07 | 71.56 | 0.953 |
| 0.994 | |||||||||||||
| 46 | 124_2009 | 21.83 | 23.08 | 22.25 | 0.32 | 1.12 | 0.79 | 1.31 | 0.94 | 0.69 | 0.49 | 46.53 | 1.060 |
| 1.073 | |||||||||||||
| 47* | 134_4363 | 22.01 | 22.20 | 24.00 | 0.83 | 1.75 | 2.58 | 0.31 | 0.24 | 0.23 | 0.15 | 43.20 | 0.954 |
| 0.984 | |||||||||||||
| 48* | 142_4347 | 21.30 | 22.31 | 21.84 | 0.39 | 1.90 | 2.18 | 1.77 | 0.12 | 0.32 | 0.62 | 60.51 | 1.072 |
| 1.051 | |||||||||||||
| 49* | 143_2770 | 21.38 | 21.91 | 22.43 | 0.62 | 2.04 | 2.24 | 1.78 | 0.16 | 0.29 | 0.33 | 12.31 | 0.989 |
| 1.028 | |||||||||||||
| 50 | 144_1141 | 21.43 | 23.50 | 21.60 | 0.15 | 1.76 | 2.22 | 1.71 | 0.04 | 0.16 | 0.29 | 47.30 | 1.026 |
| 1.014 | |||||||||||||
| 51* | 152_2736 | 22.37 | 22.85 | 23.48 | 0.64 | 1.81 | 2.35 | 1.26 | 0.34 | 0.64 | 0.21 | 68.60 | 1.010 |
| 1.057 | |||||||||||||
| 52 | 152_3226 | 22.01 | 22.81 | 22.72 | 0.48 | 1.07 | 1.07 | 1.07 | 0.76 | 0.03 | 0.34 | 73.77 | 1.086 |
| 1.147 | |||||||||||||
| 53* | 152_5051 | 20.28 | 21.09 | 20.97 | 0.47 | 1.95 | 2.89 | 1.50 | 0.95 | 0.47 | 0.66 | 76.05 | 1.366 |
| 1.333 | |||||||||||||
| 54 | 153_0432 | 22.54 | 23.20 | 23.35 | 0.54 | 2.20 | 2.45 | 2.00 | 0.28 | 0.45 | 0.15 | 40.06 | 1.248 |
| 0.936 | |||||||||||||
| 55 | 153_2422 | 21.21 | 21.67 | 22.35 | 0.65 | 1.15 | 1.12 | 1.19 | 0.75 | 0.43 | 0.13 | 1.94 | 1.336 |
| 1.244 | |||||||||||||
| 56 | 153_2622 | 22.04 | 23.17 | 22.51 | 0.36 | 0.95 | 1.06 | 0.91 | 0.41 | 0.05 | 0.49 | 70.65 | 1.039 |
| 1.040 | |||||||||||||
| 57 | 153_5853 | 23.16 | 23.31 | 25.39 | 0.87 | 1.27 | 1.43 | 0.64 | 0.09 | 0.44 | 0.21 | 70.53 | 0.983 |
| 0.974 | |||||||||||||
| 58 | 154_1435 | 22.19 | 23.34 | 22.67 | 0.35 | 0.97 | 0.45 | 1.37 | 0.24 | 0.69 | 0.23 | 53.97 | 1.264 |
| 1.252 | |||||||||||||
| 59 | 163_3159 | 22.37 | 23.52 | 22.83 | 0.35 | 1.23 | 1.61 | 1.07 | 0.23 | 0.39 | 0.14 | 26.75 | 0.978 |
| 1.054 | |||||||||||||
| 60* | 163_4865 | 20.93 | 22.21 | 21.33 | 0.31 | 1.68 | 3.78 | 1.32 | 0.63 | 0.01 | 0.40 | 3.58 | 1.189 |
| 1.112 | |||||||||||||
| 61* | 164_6109 | 20.63 | 21.26 | 21.51 | 0.56 | 1.62 | 1.83 | 1.42 | 0.59 | 0.42 | 0.48 | 62.04 | 1.055 |
| 1.086 | |||||||||||||
| 62* | 174_4356 | 21.06 | 22.80 | 21.31 | 0.20 | 1.21 | 0.16 | 1.80 | 0.39 | 0.70 | 0.31 | 59.19 | 1.498 |
| 1.393 | |||||||||||||
| 63* | 183_2970 | 22.04 | 22.46 | 23.28 | 0.68 | 0.73 | 0.84 | 0.53 | 0.67 | 0.69 | 0.20 | 44.74 | 1.146 |
| 1.199 | |||||||||||||
| 64 | 184_6971 | 21.80 | 22.74 | 22.39 | 0.42 | 0.77 | 0.94 | 0.65 | 0.40 | 0.33 | 0.10 | 51.66 | 1.486 |
| 1.571 | |||||||||||||
| 65* | 193_1227 | 21.17 | 21.47 | 22.73 | 0.76 | 2.04 | 2.28 | 1.48 | 0.26 | 0.37 | 0.43 | 24.80 | 1.010 |
| 1.014 | |||||||||||||
| 66* | 193_1838 | 21.21 | 22.89 | 21.48 | 0.21 | 1.51 | 1.88 | 1.42 | 0.40 | 0.02 | 0.65 | 51.39 | 1.095 |
| 1.066 | |||||||||||||
| 67* | 203_4339 | 20.39 | 21.69 | 20.78 | 0.30 | 1.99 | 2.33 | 1.88 | 0.15 | 0.57 | 0.49 | 46.11 | 1.018 |
| 1.028 | |||||||||||||
| 68* | 212_1030 | 21.56 | 22.28 | 22.35 | 0.52 | 1.70 | 1.80 | 1.60 | 0.16 | 0.02 | 0.54 | 5.01 | 1.051 |
| 1.066 | |||||||||||||
| 69* | 222_2555 | 22.24 | 22.67 | 23.47 | 0.68 | 2.05 | 2.39 | 1.58 | 0.39 | 0.43 | 0.15 | 27.57 | 0.978 |
| 1.004 | |||||||||||||
| 70 | 233_5614 | 22.32 | 23.35 | 22.87 | 0.39 | 1.14 | 1.08 | 1.17 | 0.56 | 0.69 | 0.40 | 58.80 | 1.077 |
| 1.033 | |||||||||||||
| 71 | 273_4427 | 21.58 | 22.60 | 22.13 | 0.39 | 0.86 | 1.02 | 0.78 | 0.33 | 0.41 | 0.07 | 74.47 | 1.083 |
| 1.082 | |||||||||||||
| 72* | 273_5056 | 22.39 | 22.98 | 23.34 | 0.58 | 1.75 | 2.03 | 1.46 | 0.12 | 0.64 | 0.33 | 35.56 | 1.078 |
| 1.016 | |||||||||||||
| 73 | 273_7619 | 21.95 | 22.48 | 22.99 | 0.61 | 1.95 | 1.72 | 2.45 | 0.28 | 0.64 | 0.10 | 84.42 | 1.056 |
| 1.007 | |||||||||||||
| 74* | 274_0837 | 21.94 | 22.16 | 23.74 | 0.81 | 1.84 | 2.16 | 0.96 | 0.14 | 0.20 | 0.23 | 20.71 | 1.006 |
| 1.004 | |||||||||||||
| 75* | 274_1220 | 22.42 | 23.03 | 23.34 | 0.57 | 2.12 | 2.37 | 1.87 | 0.23 | 0.14 | 0.15 | 70.12 | 1.080 |
| 0.997 | |||||||||||||
| 76* | 274_5920 | 19.63 | 20.41 | 20.35 | 0.49 | 2.08 | 2.24 | 1.96 | 0.38 | 0.22 | 1.16 | 13.00 | 1.009 |
| 1.000 | |||||||||||||
| 77* | 282_5737 | 21.60 | 21.89 | 23.17 | 0.76 | 1.83 | 1.65 | 2.75 | 0.48 | 0.40 | 0.09 | 78.63 | 0.977 |
| 1.036 | |||||||||||||
| 78* | 283_5331 | 20.72 | 21.05 | 22.17 | 0.74 | 2.01 | 2.34 | 1.43 | 1.04 | 0.01 | 0.22 | 84.99 | 2.201 |
| 1.599 | |||||||||||||
| 79* | 283_6152 | 20.79 | 21.79 | 21.34 | 0.40 | 2.00 | 2.10 | 1.95 | 0.05 | 0.70 | 0.27 | 84.39 | 1.067 |
| 1.071 | |||||||||||||
| 80 | 292_0936 | 20.96 | 23.39 | 21.07 | 0.11 | 1.43 | 2.57 | 1.35 | 0.44 | 0.44 | 0.89 | 56.25 | 1.036 |
| 1.037 | |||||||||||||
| 81* | 292_6262 | 21.77 | 22.99 | 22.19 | 0.32 | 2.17 | 2.24 | 2.13 | 0.07 | 0.45 | 0.23 | 27.08 | 1.031 |
| 1.015 | |||||||||||||
| 82* | 294_2078 | 22.02 | 22.85 | 22.74 | 0.46 | 1.34 | 3.07 | 0.73 | 0.41 | 0.60 | 0.36 | 54.75 | 0.968 |
| 1.015 | |||||||||||||
| 83* | 303_1249 | 21.47 | 22.37 | 22.10 | 0.44 | 1.92 | 1.86 | 1.95 | 0.25 | 0.40 | 0.37 | 77.43 | 1.046 |
| 1.021 | |||||||||||||
| 84 | 303_4538 | 22.01 | 23.03 | 22.55 | 0.39 | 1.54 | 1.25 | 1.78 | 0.59 | 0.05 | 0.17 | 57.20 | 1.122 |
| 1.079 | |||||||||||||
| 85 | 313_4845 | 23.00 | 23.36 | 24.37 | 0.72 | 1.04 | 1.25 | 0.63 | 0.38 | 0.65 | 0.32 | 20.97 | 1.044 |
| 1.107 | |||||||||||||
| 86* | 313_7453 | 21.82 | 22.92 | 22.32 | 0.37 | 1.26 | 1.11 | 1.36 | 0.25 | 0.67 | 0.18 | 29.87 | 1.112 |
| 1.048 |
Note. — Section 2.1 discusses the use of simultaneous fitting to extract the measurements. Errors correspond to 68% confidence limits from the GIM2D fits and Monte Carlo samplings and do not include any systematic or random errors that can be derived from simulations (see GSS2 and Section 2.1).
Col. (1): Sequence number ordered by source ID; galaxies with * belong to the quality sample (see section 3.4).
Col. (2): Source ID is given by FFC-XXYY, where FF is the subfield, C is the WFPC2 chip number, and XX and YY are the chip coordinates in units of 10 pixels.
Col. (3): of entire galaxy based on GIM2D fits.
Col. (4): of photo-bulge component.
Col. (5): of photo-disk component.
Col. (6): pB/T ratio measured on the image; true random errors are . Section 2.1 discusses systematic errors.
Col. (7): color of entire galaxy.
Col. (8): color of photo-bulge component.
Col. (9): color of photo-disk component.
Col. (10): Half-light major-axis radius of photo-bulge in arcsecs on the image; note that gives the circularized effective radius, as measured with a circular aperture.
Col. (11): Bulge eccentricity (limited to a maximum of 0.7) is equal to (a and b are the semi-major and semi-minor axis, respectively).
Col. (12): Exponential scale length of photo-disk in arcsecs from image.
Col. (13): Photo-disk inclination angle (0 for face-on).
Col. (14): Reduced of simultaneous fits for the I814 and V606 images, with expected values near 1.0.
| No. | Source ID | ||||||||||
|---|---|---|---|---|---|---|---|---|---|---|---|
| Gal. | Bulge | Disk | mag | Gal. | Bulge | Disk | Bulge | Bulge | Disk | ||
| (1) | (2) | (3) | (4) | (5) | (6) | (7) | (8) | (9) | (10) | (11) | (12) |
| 1* | 052_6543 | -21.83 | -20.95 | -21.19 | 0.45 | 0.31 | 0.41 | 0.24 | 1.47 | 18.52 | 4.78 |
| 2* | 062_2060 | -22.27 | -21.66 | -21.37 | 0.57 | 0.42 | 0.43 | 0.42 | 2.41 | 18.80 | 2.09 |
| 3 | 062_6465 | -21.53 | -21.08 | -20.53 | 0.66 | 0.18 | 0.88 | -0.21 | 2.43 | 19.47 | 1.17 |
| 4* | 062_6859 | -21.53 | -21.07 | -20.38 | 0.66 | 0.48 | 0.44 | 0.54 | 1.57 | 18.45 | 2.53 |
| 5* | 064_3021 | -22.29 | -21.87 | -21.07 | 0.68 | 0.35 | 0.39 | 0.25 | 2.75 | 18.86 | 4.06 |
| 6 | 064_4412 | -21.03 | -20.19 | -20.43 | 0.47 | 0.13 | 0.81 | -0.08 | 6.64 | 22.55 | 5.27 |
| 7 | 064_4442 | -20.83 | -19.58 | -20.50 | 0.31 | -0.18 | 0.88 | -0.33 | 4.90 | 22.69 | 3.39 |
| 8 | 064_4813 | -21.33 | -20.23 | -20.93 | 0.36 | -0.09 | 0.91 | -0.26 | 5.00 | 21.98 | 3.22 |
| 9* | 073_1809 | -21.19 | -19.99 | -20.78 | 0.32 | -0.09 | 0.14 | -0.15 | 3.47 | 21.29 | 2.52 |
| 10 | 073_2675 | -20.14 | -19.01 | -19.67 | 0.35 | 0.37 | 0.59 | 0.27 | 0.23 | 16.43 | 1.13 |
| 11 | 073_4569 | -20.84 | -19.94 | -20.25 | 0.44 | 0.16 | 0.50 | 0.00 | 5.12 | 22.13 | 2.01 |
| 12 | 073_7749 | -21.72 | -20.44 | -21.32 | 0.31 | 0.26 | 0.57 | 0.16 | 5.30 | 21.79 | 1.27 |
| 13* | 074_6044 | -22.32 | -21.93 | -21.03 | 0.70 | 0.48 | 0.50 | 0.42 | 8.53 | 21.26 | 2.34 |
| 14* | 074_6844 | -21.34 | -20.65 | -20.57 | 0.53 | 0.26 | 0.51 | 0.09 | 0.45 | 16.16 | 1.25 |
| 15* | 084_1138 | -21.78 | -20.89 | -21.16 | 0.44 | 0.13 | 0.44 | -0.03 | 1.32 | 18.35 | 6.11 |
| 16* | 084_2525 | -20.73 | -20.15 | -19.78 | 0.59 | 0.40 | 0.60 | 0.20 | 1.70 | 19.67 | 2.97 |
| 17 | 084_4515 | -20.33 | -19.64 | -19.71 | 0.53 | 0.06 | 1.24 | -0.29 | 3.39 | 21.83 | 1.49 |
| 18 | 084_5452 | -20.88 | -18.83 | -20.72 | 0.15 | -0.08 | 1.28 | -0.18 | 1.76 | 21.23 | 1.77 |
| 19* | 092_1339 | -21.46 | -21.32 | -19.29 | 0.88 | -0.06 | 0.10 | -0.62 | 2.67 | 19.40 | 0.48 |
| 20* | 092_2023 | -21.61 | -21.40 | -19.78 | 0.82 | 0.33 | 0.45 | 0.01 | 0.68 | 16.27 | 1.39 |
| 21 | 092_3358 | -21.42 | -20.45 | -20.84 | 0.41 | 0.01 | 0.00 | 0.01 | 5.40 | 21.78 | 1.86 |
| 22 | 092_6027 | -20.01 | -19.82 | -18.21 | 0.84 | 0.32 | 0.51 | -0.12 | 1.30 | 19.33 | 1.08 |
| 23 | 092_7241 | -20.43 | -19.45 | -19.87 | 0.40 | -0.25 | -0.57 | 0.07 | 4.51 | 22.37 | 1.95 |
| 24 | 093_1325 | -19.70 | -19.13 | -18.72 | 0.59 | 0.41 | 0.37 | 0.46 | 1.30 | 19.99 | 0.26 |
| 25 | 093_2268 | -20.22 | -19.68 | -19.21 | 0.61 | -0.12 | -0.05 | -0.20 | 7.66 | 23.32 | 3.63 |
| 26* | 093_2327 | -21.66 | -20.70 | -21.08 | 0.41 | 0.29 | 0.63 | 0.11 | 1.24 | 18.45 | 5.35 |
| 27* | 093_2470 | -22.76 | -22.08 | -21.94 | 0.53 | 0.28 | 0.51 | 0.07 | 3.78 | 19.44 | 8.91 |
| 28* | 093_3251 | -20.89 | -20.36 | -19.92 | 0.61 | -0.07 | 0.35 | -0.42 | 2.25 | 20.03 | 4.98 |
| 29* | 094_1313 | -20.15 | -20.15 | -16.73 | 1.00 | 0.28 | 0.54 | -1.02 | 1.56 | 19.43 | 0.72 |
| 30 | 094_2210 | -21.64 | -19.85 | -21.50 | 0.19 | 0.01 | 1.62 | -0.07 | 2.28 | 20.93 | 6.92 |
| 31* | 094_2559 | -21.54 | -20.31 | -21.12 | 0.32 | 0.31 | 0.51 | 0.23 | 1.51 | 19.18 | 6.51 |
| 32* | 094_2660 | -22.27 | -21.36 | -21.64 | 0.44 | 0.38 | 0.51 | 0.30 | 1.92 | 18.65 | 7.16 |
| 33* | 094_2762 | -21.60 | -21.01 | -20.67 | 0.58 | 0.25 | 0.40 | 0.10 | 1.36 | 18.24 | 5.18 |
| 34 | 094_4009 | -20.30 | -19.51 | -19.71 | 0.48 | -0.10 | -0.36 | 0.42 | 4.54 | 22.34 | 3.45 |
| 35* | 094_4767 | -20.68 | -19.26 | -20.35 | 0.27 | 0.00 | 0.02 | 0.00 | 2.11 | 20.99 | 3.58 |
| 36* | 094_6234 | -20.64 | -20.56 | -17.85 | 0.93 | 0.40 | 0.53 | -0.43 | 2.07 | 19.68 | 3.32 |
| 37 | 094_7063 | -21.47 | -19.58 | -21.27 | 0.17 | 0.21 | 0.60 | 0.15 | 2.21 | 20.73 | 10.08 |
| 38* | 103_2074 | -21.83 | -21.77 | -18.68 | 0.95 | 0.45 | 0.46 | 0.39 | 5.50 | 20.42 | 1.44 |
| 39 | 103_2974 | -20.73 | -19.82 | -20.24 | 0.43 | 0.30 | 1.26 | 0.09 | 4.30 | 22.21 | 1.31 |
| 40* | 103_4766 | -21.35 | -20.44 | -20.74 | 0.43 | 0.40 | 0.45 | 0.35 | 0.27 | 15.36 | 1.83 |
| 41* | 103_7221 | -22.22 | -21.83 | -20.96 | 0.70 | 0.45 | 0.57 | 0.26 | 4.66 | 20.15 | 4.42 |
| 42* | 104_6432 | -20.62 | -20.27 | -19.33 | 0.73 | -0.14 | -0.27 | 0.56 | 1.61 | 19.34 | 0.89 |
| 43* | 112_5966 | -21.58 | -20.12 | -21.26 | 0.26 | 0.24 | 0.53 | 0.16 | 0.49 | 17.02 | 2.97 |
| 44* | 113_3311 | -21.95 | -21.69 | -20.29 | 0.79 | 0.39 | 0.42 | 0.27 | 5.68 | 20.72 | 1.31 |
| 45* | 113_3646 | -20.35 | -20.03 | -18.98 | 0.74 | 0.34 | 0.29 | 0.66 | 0.94 | 18.51 | 0.58 |
| 46 | 124_2009 | -21.50 | -20.12 | -21.14 | 0.29 | -0.13 | -0.33 | -0.02 | 7.60 | 22.77 | 4.00 |
| 47* | 134_4363 | -21.33 | -21.31 | -18.91 | 0.98 | 0.19 | 0.57 | -0.67 | 1.92 | 18.69 | 1.22 |
| 48* | 142_4347 | -21.13 | -20.13 | -20.58 | 0.40 | 0.29 | 0.48 | 0.20 | 0.90 | 18.28 | 4.67 |
| 49* | 143_2770 | -21.07 | -20.56 | -20.01 | 0.63 | 0.38 | 0.52 | 0.21 | 1.22 | 18.52 | 2.51 |
| 50 | 144_1141 | -21.00 | -18.96 | -20.83 | 0.15 | 0.20 | 0.50 | 0.16 | 0.34 | 17.31 | 2.17 |
| 51* | 152_2736 | -20.07 | -19.63 | -18.94 | 0.66 | 0.23 | 0.59 | -0.14 | 2.55 | 21.08 | 1.59 |
| 52 | 152_3226 | -20.41 | -19.62 | -19.71 | 0.48 | -0.27 | -0.27 | -0.27 | 5.71 | 22.78 | 2.58 |
| 53* | 152_5051 | -22.15 | -21.42 | -21.44 | 0.51 | 0.32 | 0.95 | 0.02 | 7.14 | 21.57 | 4.96 |
| 54 | 153_0432 | -20.91 | -20.30 | -20.08 | 0.56 | 0.41 | 0.52 | 0.32 | 2.21 | 19.93 | 1.20 |
| 55 | 153_2422 | -21.19 | -20.73 | -20.05 | 0.65 | -0.22 | -0.24 | -0.19 | 5.66 | 21.63 | 0.99 |
| 56 | 153_2622 | -20.36 | -19.23 | -19.90 | 0.36 | -0.35 | -0.28 | -0.38 | 3.10 | 21.86 | 3.70 |
| 57 | 153_5853 | -20.02 | -19.91 | -17.62 | 0.90 | -0.07 | 0.02 | -0.45 | 0.72 | 17.92 | 1.69 |
| 58 | 154_1435 | -20.69 | -19.44 | -20.30 | 0.31 | -0.29 | -0.62 | -0.04 | 1.88 | 20.47 | 1.80 |
| 59 | 163_3159 | -20.04 | -18.90 | -19.58 | 0.35 | -0.17 | 0.09 | -0.27 | 1.73 | 20.91 | 1.09 |
| 60* | 163_4865 | -21.49 | -20.52 | -21.08 | 0.41 | 0.14 | 1.53 | -0.10 | 4.77 | 21.80 | 2.99 |
| 61* | 164_6109 | -21.78 | -21.16 | -20.90 | 0.56 | 0.10 | 0.24 | -0.03 | 4.42 | 20.70 | 3.60 |
| 62* | 174_4356 | -21.35 | -19.66 | -21.12 | 0.21 | -0.18 | -0.90 | 0.22 | 2.97 | 21.38 | 2.33 |
| 63* | 183_2970 | -21.12 | -20.74 | -19.80 | 0.71 | -0.37 | -0.30 | -0.50 | 5.42 | 21.51 | 1.63 |
| 64 | 184_6971 | -20.82 | -19.90 | -20.22 | 0.43 | -0.45 | -0.34 | -0.53 | 3.04 | 21.14 | 0.80 |
| 65* | 193_1227 | -21.21 | -20.93 | -19.63 | 0.78 | 0.39 | 0.56 | 0.01 | 1.96 | 19.19 | 3.22 |
| 66* | 193_1838 | -21.77 | -20.15 | -21.49 | 0.23 | 0.04 | 0.24 | -0.01 | 3.18 | 20.93 | 5.10 |
| 67* | 203_4339 | -22.06 | -20.79 | -21.67 | 0.31 | 0.35 | 0.57 | 0.27 | 1.17 | 18.22 | 3.72 |
| 68* | 212_1030 | -21.20 | -20.49 | -20.40 | 0.52 | 0.14 | 0.20 | 0.08 | 1.21 | 18.50 | 4.17 |
| 69* | 222_2555 | -20.52 | -20.15 | -19.24 | 0.71 | 0.36 | 0.56 | 0.07 | 3.04 | 20.92 | 1.13 |
| 70 | 233_5614 | -20.82 | -19.78 | -20.29 | 0.39 | -0.15 | -0.19 | -0.13 | 4.46 | 21.98 | 3.15 |
| 71 | 273_4427 | -21.48 | -20.52 | -20.91 | 0.41 | -0.32 | -0.22 | -0.37 | 2.64 | 20.12 | 0.54 |
| 72* | 273_5056 | -20.54 | -19.99 | -19.54 | 0.61 | 0.17 | 0.33 | 0.00 | 0.91 | 18.40 | 2.56 |
| 73 | 273_7619 | -20.48 | -19.95 | -19.49 | 0.61 | 0.32 | 0.17 | 0.65 | 2.13 | 20.34 | 0.72 |
| 74* | 274_0837 | -20.12 | -19.89 | -18.38 | 0.81 | 0.30 | 0.55 | -0.35 | 1.01 | 18.74 | 1.70 |
| 75* | 274_1220 | -20.03 | -19.45 | -19.09 | 0.58 | 0.44 | 0.60 | 0.27 | 1.76 | 20.47 | 1.15 |
| 76* | 274_5920 | -22.82 | -22.04 | -22.09 | 0.49 | 0.41 | 0.51 | 0.33 | 2.90 | 18.91 | 8.75 |
| 77* | 282_5737 | -20.52 | -20.23 | -18.98 | 0.77 | 0.28 | 0.15 | 0.98 | 3.52 | 21.10 | 0.67 |
| 78* | 283_5331 | -21.72 | -21.41 | -20.24 | 0.75 | 0.37 | 0.58 | -0.03 | 7.82 | 21.71 | 1.66 |
| 79* | 283_6152 | -21.64 | -20.64 | -21.09 | 0.40 | 0.36 | 0.42 | 0.32 | 0.36 | 15.79 | 2.03 |
| 80 | 292_0936 | -21.74 | -19.45 | -21.61 | 0.12 | -0.03 | 0.65 | -0.07 | 3.41 | 21.89 | 6.91 |
| 81* | 292_6262 | -20.79 | -19.58 | -20.37 | 0.33 | 0.45 | 0.50 | 0.43 | 0.52 | 17.67 | 1.72 |
| 82* | 294_2078 | -20.92 | -20.40 | -20.08 | 0.62 | -0.06 | 0.84 | -0.44 | 3.23 | 20.85 | 2.81 |
| 83* | 303_1249 | -20.95 | -20.06 | -20.33 | 0.44 | 0.30 | 0.26 | 0.33 | 1.89 | 19.98 | 2.79 |
| 84 | 303_4538 | -20.01 | -19.03 | -19.45 | 0.41 | 0.08 | -0.14 | 0.26 | 4.29 | 22.69 | 1.25 |
| 85 | 313_4845 | -19.97 | -19.66 | -18.51 | 0.76 | -0.23 | -0.10 | -0.49 | 2.98 | 21.28 | 2.57 |
| 86* | 313_7453 | -20.40 | -19.32 | -19.90 | 0.37 | -0.14 | -0.25 | -0.07 | 1.85 | 20.58 | 1.32 |
Note. — Errors are formal 68% confidence limits derived by Monte Carlo sampling within the GIM2D fitting program. These errors do not include any systematic or random errors derived by use of simulations (see Section 2.1 and GSS2).
Col. (1): Sequence number ordered by source ID; galaxies with * belong to the quality sample (see Section 3.4).
Col. (2): Source ID is given by FFC-XXYY, where FF is the subfield, C is the WFPC2 chip number, and XX and YY are the chip coordinates in units of 10 pixels.
Col. (3): Absolute magnitude in of galaxy.
Col. (4): Absolute magnitude in of photo-bulge.
Col. (5): Absolute magnitude in of photo-disk.
Col. (6): Photo-bulge to total ratio in restframe ; random errors are generally . Section 2.1 discusses systematic errors.
Col. (7): Restframe color of galaxy.
Col. (8): Restframe color of photo-bulge.
Col. (9): Restframe color of photo-disk.
Col. (10): Effective (half-light) major-axis radius of photo-bulge in kpc; note that gives the circularized effective radius as measured with a circular aperture, where is from column 11 of Table 2.
Col. (11): Restframe surface brightness of photo-bulge in units of mag per square arcsec averaged within the major-axis effective radius.
Col. (12): Exponential scale length of photo-disk in kpc.
| Note | Class or Group | No. in | % | No. in | % |
|---|---|---|---|---|---|
| Total Sample | Quality Sample | ||||
| Sample size | 86 | 100 | 52 | 100 | |
| Very red pB | 58 | 67 | 41 | 79 | |
| Less red pB | 11 | 13 | 7 | 13 | |
| 1 | Both pB and pD very red | 19 | 22 | 16 | 31 |
| 2 | Both pB and pD less red or very-red | 44 | 51 | 34 | 65 |
| 3 | Very red pB and blue or very blue pD | 19 | 22 | 10 | 19 |
| 4 | Less red pB and blue or very blue pD | 6 | 7 | 4 | 8 |
| 5 | Blue or very blue pB and red or very red pD | 5 | 6 | 2 | 4 |
| 6 | Both blue or very blue | 12 | 14 | 2 | 4 |
| 7 | pB larger than pD | 27 | 31 | 10 | 19 |
| 8 | Candidate E-S0 | 40 | 46 | 17 | 33 |
| 8 | Blue E-S0 | 6 | 7 | 3 | 6 |
| 9 | Pure E | 5 | 6 | 4 | 8 |
| 10 | Nearly pure E | 16 | 18 | 13 | 25 |
| 11 | Blue or very blue nearly pure E | 2-4 | 2-5 | 1-2 | 2-4 |
Note. — Color definitions for photo-bulge (pB) or photo-disk (pD):
very red (), less red (),
blue (), very blue ().
1 – Best candidates for passively evolving E-S0.
2 – Probable candidates for largely passively evolving E-S0.
3 – Very red bulge imbedded within a blue disk.
4 – Red bulge imbedded within a blue disk.
5 – Blue bulge within a red disk.
6 – Both bulge and disk are blue.
7 – (see Table 2) so a likely reversal of actual bulge and disk.
8 – Use Im et al. criterion of pB/T (RT2+RA2 0.08).
9 – pB/T 1 within 68% confidence limits.
10 – pB/T 0.8 within 68% confidence limits.
11 – Lower number is for bulge ; larger number is for .
| Seq. | Sample | Sample | Median | Comments | ||
|---|---|---|---|---|---|---|
| No. | Size | z | Bulge | Galaxy | ||
| 1 | All High z Galaxies | 211 | 0.83 | 0.34 | -0.09 | 1 |
| 2 | High z Red Galaxies | 60 | 0.83 | 0.51 | 0.31 | 2 |
| 3 | Full Bulge Sample | 86 | 0.85 | 0.46 | 0.23 | 3 |
| 4 | Quality Bulges | 52 | 0.82 | 0.49 | 0.31 | 4 |
| 5 | Very Red Quality Bulges | 41 | 0.82 | 0.51 | 0.34 | 5 |
| 6 | As previous with large B/T | 26 | 0.90 | 0.52 | 0.36 | 6 |
| 7 | Early-type Bulges | 18 | 0.81 | 0.51 | 0.39 | 7 |
| 8 | Cluster Early-type Galaxies | 30 | 0.83 | 0.45 | 8 | |
| 9 | Local Early Spiral Bulges | 29 | 0.0 | 0.40 | 9 | |
| 10 | Local E-S0 Galaxies | 403 | 0.0 | 0.52 | 10 |
Note. —
1 High z means 0.73 1.04 of high quality redshift sample.
2 Red means for integrated galaxy colors.
3 Median redshift lies between 0.84 and 0.87.
4 See text for definition of quality bulge sample.
5 Very red means for photo-bulge component.
6 As in sample 5 with restframe .
7 Early-type are those within sample of Im et al. (2002).
8 Early-type (E-S0) members of cluster MS1054-03 from van Dokkum et al. (2000).
9 Early-type spiral bulge colors from Peletier & Balcells (1996).
10 E-S0 from RC3 for of color-mag relation from Schweizer & Seitzer (1992).