VWhere: A Visual, Extensible ‘where’ Command
Abstract
In this paper we describe VWhere, a S-Lang guilet which augments the computational power of where with the point-click ease of a Gtk-based visual interface. The result is a new mechanism for interacting with datasets, which unifies the constraint evaluation cycle implicit within observational analysis and provides a number of compelling advantages over traditional tool-based methods.
Center for Space Research, Massachusetts Institute of Technology
1. The Problem: Exploratory Analysis
The act of working raw data into a form from which its innate properties may be more readily discerned, referred to here as exploratory analysis, is of fundamental importance to scientific inquiry. For example, from an astrophysical dataset D one may wish to examine events within some region , after time , but only if they originated from detectors and , and were above energy but below energy . Such constraint sets C = {} are derived by iterating through “What If?” cycles, modeled in the large as
![[Uncaptioned image]](/html/astro-ph/0412003/assets/x1.png)
Stages and may involve numerical and visualization tasks, such as fitting models and plotting residuals. Stage may be manifested by applying filters to columns and images, or grouping, binning, et cetera. This process plays out whether D is a single observation or multiple observations spanning a number of wavelengths and telescopes.
1.1. A Traditional Solution: Command Line Tools
Many existing astronomical analysis systems support data exploration via
some combination of command line tools and interactive applications. The
tools in this model operate as file transformers (file in —
file out), and characterize the exploration process as one in which
,
, and
are performed by
multiple invocations of distinct programs (e.g.
fcopy/dmcopy/XSpec)
requiring many passes over files in D
during which a number of intermediate files are produced
While this approach certainly works, and provides bookkeeping advantages if
the tools record their operation (e.g. as comments in a FITS header), it is
clumsy for ad-hoc inquiry and generates file litter. It is also needlessly
consumptive of
time and computational resources (at times enormously so, as corroborated
by Davis et al, this volume). Moreover, it is easy to mistakenly use the
filtering syntax of one system when executing tools from another. Finally,
traditional tools are static in function, incapable of being selectively
extended by the end-user via the importation of a module or script.
1.2. A New Solution: Interactive ‘where’ Command
To anyone who has analyzed data within array-oriented systems such as IDL(tm), CIAO/ISIS, or PyRAF, the where command should need little introduction. Couched in intuitive syntax, it provides a powerful mechanism for filtering arrays via arbitrary expressions. For example, consider plotting from an event list all photons whose position (specified by X, Y arrays) fell within a circle of radius 10 centered at the origin
              isis> i = where( X^2 + Y^2 < 10);
              isis> plot(X[i], Y[i]);
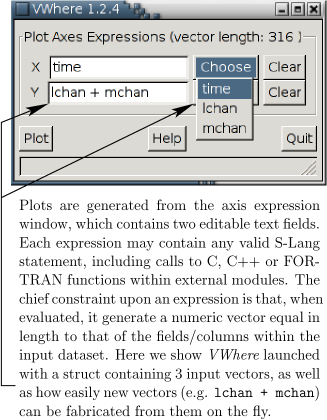
The VWhere guilet detailed herein augments this computational power with a graphical interface that permits constraints to be specified, manipulated, and evaluated visually. In this model constraint sets are represented as a combination of plots and the region filters cumulatively applied to them. Plots are generated from the axes of a dataset D resident in memory, or from new axes derived by arbitrary analytic combinations of them, all without incurring any additional I/O overhead or tool execution costs per iteration.
2. Exploring Cygnus X-1
Let us now walk through portions of a published research scenario, in which VWhere was used to correlate two observations (from Chandra and the RXTE All-Sky Monitor) of black hole candidate Cygnus X-1. We begin by loading VWhere into ISIS, done explicitly here to underscore the fact that it is
isis> require("vwhere");
not linked directly into ISIS but is rather a standalone module that can be loaded at runtime into any application which embeds the S-Lang interpreter. To maximize benefit to the community, while still promoting freedom of choice, we’ve also begun to investigate means by which S-Lang modules may be utilized within other interpreters, such as Tcl or Python. After loading the data into a structure (not shown) we launch VWhere
isis> indices = vwhere(data);
and generate a lightcurve by plotting 3 fields: time versus lchan + mchan. Our objective is to look for times where Cyg X-1 is emitting harder X-rays during low count states.
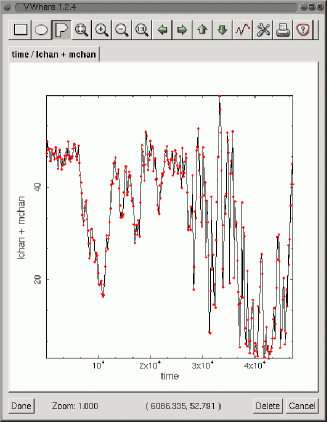
Each such plot is generated in its own tabbed subwindow, and may be panned, zoomed, deleted, printed, or cosmetically altered in many of the usual manners one would expect within a plotting GUI. Arbitrarily complex filters may then be constructed by laying regions upon plots. Pressing Done returns to the caller a list of indices representing all points selected by the applied filters (the same semantics as where).
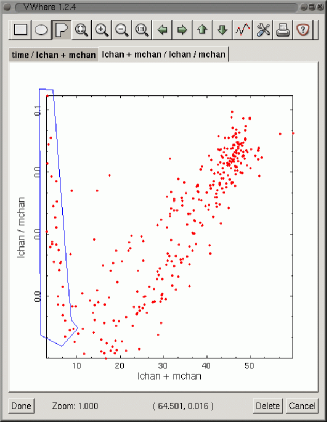
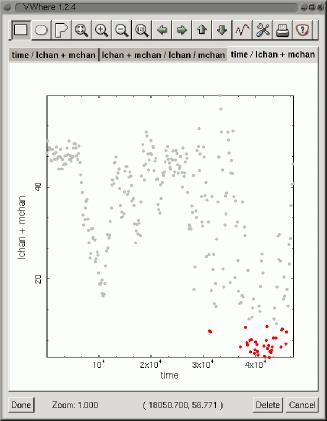
Notice that the lightcurve above exhibits a good deal of variability. The color intensity diagram in the first panel of Figure 2 shows that as count rate drops (lower X value) CygX-1 emission is getting harder (smaller Y value), except for a spike at the very lowest rates. So we select points within that spike, by applying a polygonal region, and look at the lightcurve again in the second panel. The points filtered away are drawn grayed out, revealing that the hard, low count-rate selection comes from a deep dip near the end of the lightcurve.
3. Benefit Analysis
3.1. Unifying the Constraint Cycle
This example demonstrates how incremental filtering in VWhere unifies stages , , and of the constraint evaluation cycle, dramatically shrinking the time and effort required to discern subtle patterns within data, and without any package-specific filtering syntax. With VWhere it is instantly clear how cuts applied to portions of a dataset, or new axes derived from it, affect other portions. As a result, the process of constructing constraint sets is considerably more fluid. It is also far more powerful, since by virtue of the extensibility endowed by S-Lang VWhere may import a wide range of C, C++, or FORTRAN modules, and rather easily using the SLIRP code generator111http://space.mit.edu/cxc/software/slang/modules/slirp/. This is simply not feasible with traditional tools. Finally, since VWhere operates directly upon arrays already loaded within its host application, memory is conserved while I/O overhead and runtime performance are improved by many factors.
3.2. Real Modularity
Drawing from our experience as both user and developer of major astronomical packages, we note a tendency in extant systems whereby algorithms or libraries are internally coupled in ways which sharply curtail their use elsewhere. Such systems, while open in the superficial sense that sourcecode is publicly available, are in a deeper sense closed by their complex web of internal dependencies, which accrete to form a monolithic structure impenetrable to the practicing scientist and difficult to navigate even for professional programmers.
Potential users must confront the prospect of downloading, sifting through, and picking apart tens or hundreds of thousands of lines of software simply to obtain a small library or algorithm. This effectively prevents the use of novel portions of a system apart from its whole. Conversely, tightly coupled architectures betray a distinct evolutionary disadvantage, in that they also tend to inhibit the incorporation of software developed externally to the system.
VWhere is one of the earliest examples of our response to this problem. Our methodology shuns monolithic constructions in favor of modular, extensible components that are orthogonal in function, and which may either be woven together to form larger systems or used completely standalone. Other fruits of this effort are described on our modules page222http://space.mit.edu/cxc/software/slang/modules/ and in Davis et al (this volume).
3.3. SLgtk
As argued elsewhere (e.g. Primini & Noble, this volume), S-Lang is an excellent open-source language for scientific scripting, particularly for those with FORTRAN, C, or IDL experience. SLgtk augments its core strengths (e.g. built-in support for array-based numerics) with an importable module that makes it possible to construct sophisticated graphical interfaces directly from the S-Lang interpreter. Most of SLgtk is generated automatically by SLIRP.
3.4. Guilets
A driving force behind the development of SLgtk has been the notion of the guilet, by which we mean visual software of a small, scriptable nature which may be easily embedded within other applications, even those with a primarily textual interface. This fosters the use of graphical interfaces where they are appropriate and beneficial, without committing the entire application to such.
In code size and development cycle the typical guilet is considerably smaller
than traditional GUIs (applications designed with a primarily visual interface,
coded in a compiled language and explicitly utilizing low-level toolkits
such as Xt, Motif, or the Windows Foundation Classes). Moreover, since
guilets are scripts they are more amenable to changing requirements, rapid
feature evolution, and even
customization by the end-user. This can be vital to scientists
-
•
interested in advanced analysis not yet supported by existing systems
-
•
or with proprietary periods who are unable to wait months for upgrades
-
•
or who find it advantageous to concoct working prototypes for developers, to either supplement or supplant paper specifications
In point of fact, VWhere provides modern analysis and plotting capability in only 1650 lines of scripts, and has been enhanced on numerous occasions with turnaround times as short as 2 hours.
4. Summary
This paper describes VWhere, which extends the S-Lang where command with a Gtk-based visual interface. We have argued that by integrating the specification, accumulation, and visualization of analytical constraints VWhere presents a facile mechanism for exploring data, one which eclipses tool-based methods for such, particularly in terms of performance, extensibility, and ease of use.
Acknowledgments.
This work was supported in part by the Chandra X-Ray Center contract SV1-61010 from the Smithsonian Institution. The author would like to thank colleagues at MIT and the Harvard-Smithsonian CFA (especially Michael Nowak), as well as those within the open source community, for various contributions and commentary.