A submillimeter line survey of low-mass protostars: prelude to ALMA and Herschel
Abstract
The results from a single-dish molecular line survey of a set of 18 deeply embedded young stellar objects are summarized. More than 40 lines from 16 different species were observed with the JCMT, Onsala, IRAM 30m and SEST telescopes. The multi-transition data are analyzed using a temperature and density structure derived from models of the dust continuum emission. For the outer envelope (300 AU), the data indicate a ‘drop’ abundance profile for many species, with normal abundances in the outer- and innermost regions and highly depleted abundances in an intermediate zone. This zone is bounded at the outer edge by the density where the timescale for freeze-out becomes longer than the lifetime of the core, and at the inner edge by the evaporation temperature of the species involved. In the innermost envelope (300 AU), all ices evaporate resulting in jumps in the abundances of complex organic molecules such as CH3OH. A key project for Herschel will be to survey gas-phase water in these objects, whose abundance shows extreme variations with temperature. ALMA wil be able to directly image the chemical variations throughout the envelope and zoom in on the inner hot core and protoplanetary disks on scales on tens of AU.
keywords:
protostars; molecular clouds; chemistry1 Introduction
Low mass stars like our Sun are born deep inside molecular clouds. In the earliest, deeply-embedded stage ( mag) the protostar is surrounded by a collapsing envelope and a circumstellar disk through which material is accreted onto the growing star. This so-called ‘class 0’ phase (André et al. 2000) lasts only a very short time, a few yr, but is critical for the subsequent evolution of the star: it is the phase in which the final mass of the star, the final mass of the circumstellar disk (and thus its ability to form planets), and the initial chemical composition of the disk are determined. Protostars differ from the pre-stellar cores studied extensively by other groups (e.g., Bergin et al. 2001, Tafalla et al. 2002, Lee et al. 2003) in that there is a central source which heats the envelope from the inside and dominates the energy balance, rather than only weak heating from the outside by the external radiation field.
To constrain their physical and chemical structure, our groups started a large single-dish survey of low-mass protostars using the JCMT, IRAM 30m, Onsala and SEST telescopes. Previous studies focused either on selected objects (e.g., IRAS 16293 -2422: Blake et al. 1994, van Dishoeck et al. 1995, Ceccarelli et al. 1998, 2000a,b, Schöier et al. 2002; Serpens: Hogerheijde et al. 1999), or on specific molecules such as sulfur-bearing species and deuterated molecules (e.g., Buckle & Fuller 2002, 2003, Wakelam et al. 2004, Roberts et al. 2002, Loinard et al. 2001, Shah & Wootten 2001). Two important developments make such a survey timely. The first is the advent of bolometer arrays to map the continuum emission from cold dust. Model fits of these maps together with the spectral energy distributions allow accurate constraints of the dust temperature and density throughout the envelope, independent from the line observations (e.g., Motte & André 2001, Shirley et al. 2002, Jørgensen et al. 2002). The second development is the improved sensitivity of (sub)millimeter receivers, which makes multi-line observations of even minor species possible. Combined with well-tested radiative transfer methods (see van Zadelhoff et al. 2002 for overview), measurements of lines originating from levels with a range in energy and critical density can be used to constrain not just the molecular abundances, but even abundance profiles throughout the envelope.
Our sample consists of 18 objects, containing 12 Class 0 sources taken from André et al. (2000) and augmented by 5 Class I objects and 2 pre-stellar cores. The main selection criteria are luminosities less than 50 , distances less than 450 pc, and visible from the JCMT. The distinction between Class 0 and I objects is somewhat arbitrary and it is even unclear whether these two sets of objects represent truly different evolutionary stages. In practice, they represent a division in envelope mass at 0.5 .
Some of the questions addressed with this data set are: (1) What is the physical and chemical structure of low-mass protostellar envelopes down to scales of a few hundred AU? (2) Can we trace the evolution of low-mass protostars through chemical diagnostics and put constraints on the timescales? (3) What is the role of freeze-out and grain chemistry, and does it differ from that found in high-mass protostellar regions? (4) What is the dominant mechanism for returning molecules from the grains: gentle evaporation due to radiative heating or violent disruption of grain mantles in shocks? (5) Do low-mass protostars develop a ‘hot core’ chemistry with abundant complex organic molecules, as do high-mass protostars?
2 Observations and analysis
Most of the data were obtained with the JCMT in 2001–2003 in the 230 and 345 GHz atmospheric windows. These data were complemented by lower frequency observations using the Onsala, IRAM 30m or SEST telescopes. In total more than 40 lines of 16 species (CO, CS, HCO+, DCO+, N2H+, HCN, HNC, DCN, CN, HC3N, SO, SO2, SiO, H2CO, CH3OH, CH3CN and isotopes) were obtained. Typical integration times at the JCMT ranged from 30 to 60 minutes, resulting in rms noise levels of 30–50 mK in a 0.5 km s-1 velocity bin. The JCMT beam ranges from 15′′ to 20′′, corresponding to linear scales of a few thousand AU at the typical distances of our sources. The observing beams at lower frequencies are up to a factor of 2 larger. Thus, the envelopes are unresolved in the single-dish beams and all radial variations are inferred from the analysis of the multi-transition data.
For a few objects, interferometer data were obtained with the OVRO, BIMA and IRAM Plateau de Bure arrays, providing information on scales of a few hundred AU. This allows the radial structure inferred from the single-dish data to be tested and may reveal the inner hot cores directly.
The analysis starts by modeling the dust continuum radiation observed by SCUBA. Both the radial profile of the emission and the spectral energy distributions are fitted, assuming spherical symmetry, a power-law density profile and a dust emissivity which is constant throughout the envelope. The resulting parameters are the power-law index of the density structure (, with typically 1.5–2.0, consistent with collapse models), the ratio of inner and outer radii, and the optical depth at 100 m (Jørgensen et al. 2002). The dust temperature is calculated by solving the radiative transfer through the model envelope given the total luminosity of the source.
The line data are modeled by taking the dust temperature and density structure as a starting point. A constant gas/dust mass ratio of 100 is assumed and the gas temperature is taken to be equal to that of the dust. The molecular excitation and line radiative transfer are then calculated for each position in the model envelope and the resulting sky brightness distribution is convolved with the beam profile, or, in the case of interferometer data, analyzed with the same spatial filtering. A trial abundance of the molecule under consideration is chosen and is adjusted until the best agreement with observational data is reached, e.g., through a test. In its simplest form, this abundance is chosen to be constant with radius, but other abundance profiles can be tested as well (see §3). See Figure 1 of Doty et al. (2004) for a summary of the modeling procedures. Basic molecular data such as Einstein- coefficients and collisional rate coefficients form an essential input to these models (see Schöier et al. 2005 for summary).
3 Cold outer envelope
An inventory of the abundances of various species in the outer envelope has been presented by Jørgensen et al. (2002, 2004a). The chemical structure of many species follows that of CO. Assuming a constant abundance, the best-fit results show a clear trend of increasing CO abundance with decreasing envelope mass. Objects with the most massive envelopes have CO abundances that are an order of magnitude lower than those found for less embedded objects, in which the abundances approach those found for general molecular clouds. The most likely explanation is freeze-out of molecules on icy grains in the coldest and densest part of the envelope. Indeed, a so-called ‘drop’ abundance profile provides a much better fit to the isotopic CO 1–0, 2–1 and 3–2 data than a constant abundance profile.


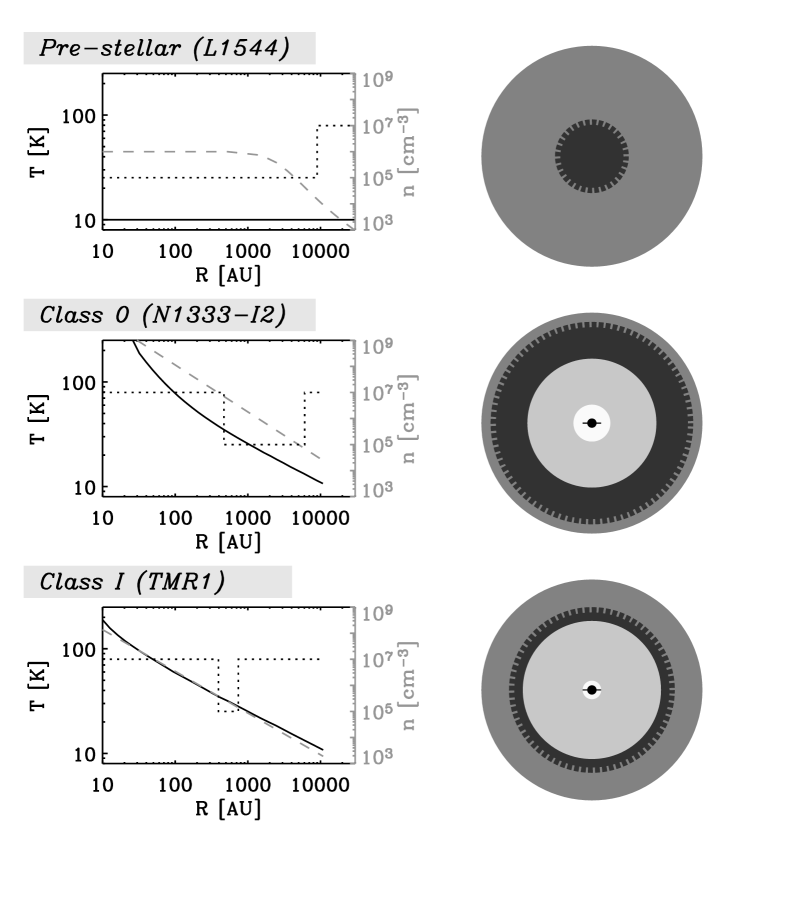
Figure 1 summarizes the inferred physical and chemical structure of the pre-stellar cores, Class 0 () and Class I () objects (Jørgensen et al. 2005a). The left panels show the typical temperature and density profiles for each type of object. In the pre-stellar cores, the temperature is low throughout the source and strong depletion of molecules has been inferred toward the center, but not the edge, of the core (e.g., Bergin et al. 2001, Tafalla et al. 2002, Lee et al. 2003). In the protostellar objects, the central source sets up a temperature gradient in the envelope, which results in evaporation of ices in the inner region. CO is one of the most volatile species and starts to evaporate at 20 K (Collings et al. 2003). In the outermost region, the density has decreased to the point where the timescale for freeze-out becomes longer than the age of the source, resulting in little or no depletion.
The drop abundance profile has four parameters: the outer radius of the drop zone corresponding to the density where depletion starts; the inner radius of the drop zone where the temperature is above the evaporation temperature ; the undepleted abundance and the depleted abundance . Using the multi-line data for all sources, the best-fit parameters for CO are 35 K, , and typically an order of magnitude lower than . The inferred is of order cm-3 but varies considerably from object to object. Thus, the main difference between the Class 0 and I sources is not the absolute abundance, but rather the width of the depletion zone, which is significantly smaller for the Class I objects and even vanishes for objects with . If can indeed be related to the age of the core, the inferred values indicate ages of only yr, with no significant difference between the Class 0 and I objects. This suggests that the phase with heavy depletions (both in the pre- and protostellar stages) is short-lived, consistent with recent chemical-dynamical models of Lee et al. (2004).
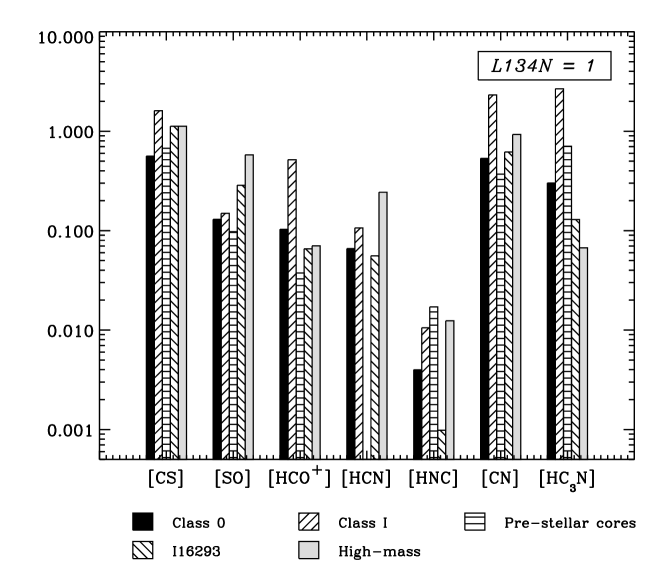
The abundance structure of CO is reflected in that of several other species. For example, the HCO+ abundance is strongly correlated with that of CO. Other species such as N2H+ show a clear anticorrelation because CO is their main destroyer (see Figure 2). From the correlation coefficients between various species, an empirical chemical network can be constructed. The CS and SO abundances are clearly correlated, as are the CN, HNC and HC3N abudances. The largest enigma is formed by HCN, whose abundance does not show any correlation with those of other species, nor with envelope mass. One complication is that the optically thick main isotopic HCN lines are often affected by outflows, whereas only few optically thin lines from minor isotopes have been detected. Figure 3 compares the inferred abundances in the low-mass pre- and protostellar objects with those in high-mass protostars.
The freeze-out of CO is also reflected in the level of deuterium fractionation. The most massive Class 0 objects with large freeze-out zones show very high deuterium fractionation ratios, not just of DCO+ (Shah & Wootten 2001, Jørgensen et al. 2004a) but even of doubly deuterated species like D2CO (Loinard et al. 2001). The deuterium fractionation in the gas phase is initiated by deuteron transfer from H2D+, whose abundance relative to H is enhanced at low temperatures because of its smaller zero-point energy. In clouds with normal abundances, CO is the prime destroyer of H and H2D+, but when CO is heavily depleted onto grains, HD becomes the main reactant of H, enhancing H2D+ even further (Roberts et al. 2003).
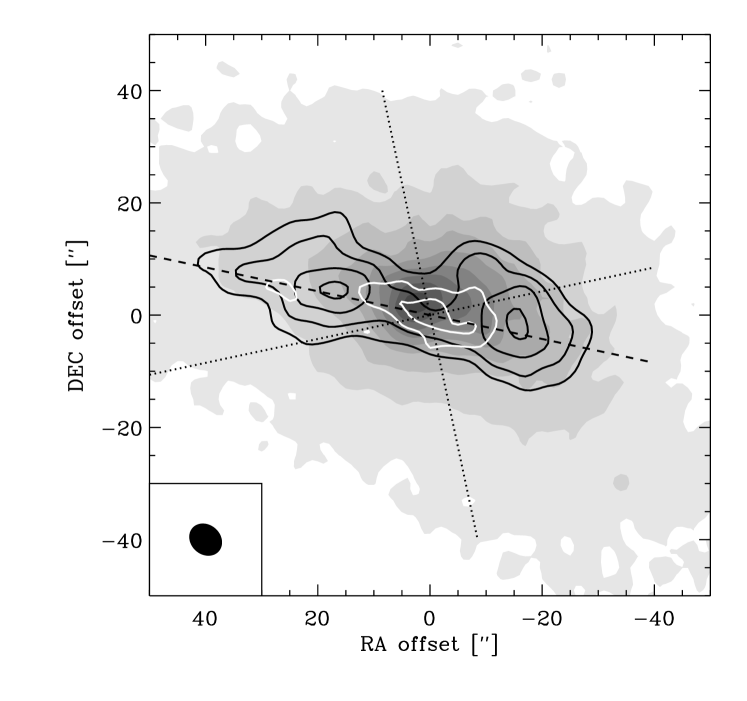
The physical and chemical structure presented in Figure 1 has been confirmed by interferometer studies at higher angular resolution for a selected set of objects. First, analysis of the continuum data has shown that the power-law density structure derived from single-dish data on scales of a few thousand AU can be extrapolated to scales of a few hundred AU (Schöier et al. 2004, Jørgensen et al. 2004b). Second, the drop-abundance profiles have been imaged directly for a few species, in particular CO, H2CO and N2H+. A particularly good example is provided by L 483, shown in Figure 4 (Jørgensen 2004). C18O is seen only in the inner region and freezes out beyond 300 AU, at which point N2H+ becomes very prominent out to radii of about 8000 AU. At larger radii, the density is too low for significant freeze-out, and also starts to fall below the critical density for exciting lines of species like N2H+. More generally, an accurate physical-chemical model of the outer envelope is a prerequisite for interpreting interferometric data of the inner envelope, since even if the line emission on larger scales is resolved out, it can still affect the inferred abundances in the inner region through optical depth effects (Schöier et al. 2004).
4 Warm inner envelope
Once the dust temperature reaches 90–100 K, even the most strongly-bound ices like H2O start to evaporate, resulting in a ‘jump’ in the gas-phase abundances of these molecules. In envelopes around high-mass protostars, this temperature is reached at a radius of more than 1000 AU, but it lies at less than 100 AU for the low-luminosity objects considered here. Thus, the typical diameters of these inner warm regions are less than 1′′ and their emission is severely diluted in the single-dish beams. Other effects such as holes, cavities and disks also start to become important on these scales. Nevetheless, if the abundance enhancements are sufficiently large (typically more than a factor of 100), the effects may become observable in the higher excitation lines.
An excellent example is provided by CH3OH. For high-mass sources, jumps in its abundance of a factor of 100 have been derived by simultaneously fitting the low- and high-excitation lines (e.g., van der Tak et al. 2000). Since many of these lines can be obtained in a single spectral setting (e.g., the setting at 338 GHz) uncertainties due to calibration and different beam sizes are minimized. For low-mass protostars like IRAS 16293–2422 and NGC 1333 IRAS2 similar abundance jumps from to around K are obtained (Maret et al. 2005, Maret, this volume, Jørgensen et al. 2005b, Schöier et al. 2002). For other sources like NGC 1333 IRAS 4B, however, the inferred is much lower and the lines are much broader. Here the enhancement may be due to the interaction of the outflow with the envelope which sputters the ice mantles, such as observed in other outflows offset from the central protostar (L1157: Bachiller & Pérez-Gutiérrez 1997; BHR71: Garay et al. 1998; NGC 1333 IRAS2A: Jørgensen et al. 2004c). Which of these two mechanisms dominates the observed emission depends on the relative filling factor of the thermal evaporation vs. shocked zones in the observing beam.
A second example is provided by H2CO. As an asymmetric rotor, H2CO has many lines originating from a wide range of energy levels throughout the (sub)millimeter windows and is therefore an excellent diagnostic probe (Mangum & Wootten 1993, Ceccarelli et al. 2003). However, even with so many lines, large abundance jumps in the inner hot core region are difficult to establish unambiguously. In one interpretation, Maret et al. (2004) derived significant jumps up to 3 orders of magnitude at K assuming an infalling velocity structure and a fixed ortho/para-H2CO ratio of 3. In an alternative analysis, Jørgensen et al. (2005b) find no evidence for or against such abundance jumps using a turbulent velocity structure and keeping the ortho/para-H2CO ratio as a free parameter (inferred to be typically 1.7). Both analyses agree well on the H2CO abundances in the outer envelope and their correlation with CO. Also, both studies agree on a drop abundance profile with =50 K for IRAS 16293 -2422, the one source for which both interferometer data and a large number of single-dish H2CO lines are available (Ceccarelli et al. 2000b, Schöier et al. 2004). These studies illustrate the importance of future high-resolution multi-line interferometer data to constrain the H2CO abundance profile.
5 Hot core chemistry: complex organics
From the above analysis of the dust continuum and molecular line data, it is clear that all low-mass protostars have inner warm regions where the ices can, and often have, evaporated. This is one definition of ‘hot cores’. High-mass hot cores are often characterized observationally by a true forest of molecular lines down to the confusion limit, including a multitude of features from complex organics such as CH3CN, CH3OCH3, HCOOCH3 etc. In the so-called ‘hot core chemistry’, these molecules are thought to be the second-generation products of gas-phase reactions with evaporated molecules (e.g., Charnley et al. 1992). Until recently, it was unclear whether low-mass protostars have a similar ‘hot core chemistry’.
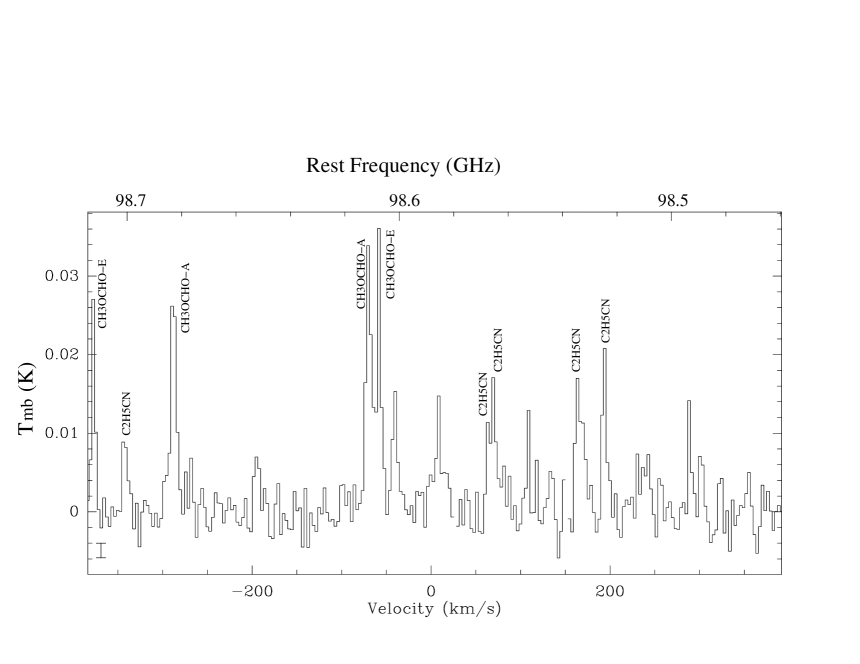
Deep single-dish integrations by Cazaux et al. (2003) have beautifully demonstrated that low-mass objects like IRAS 16293 -2422 can have a similarly rich chemistry as high-mass protostars (see Figure 5). Indeed, a recent JCMT survey by Caux et al. (in prep.) of this object shows a remarkable line density. Moreover, several of these molecules have been imaged with the SMA by Kuan et al. (2004) and with the Plateau de Bure by Bottinelli et al. (2004b), showing chemical differentiation on arcsec scales between the two sources in this protobinary object. A second example of a low-mass protostar showing a rich line spectrum from complex organic species is provided by NGC 1333 IRAS4A (Bottinelli et al. 2004a). Schöier et al. (2002) noted, however, that the timescales for crossing the hot core region in low-mass objects are very short in a pure infall scenario, only a few hundred yr, much shorter than the timescales of yr needed for the hot core chemistry. Thus, a major question is whether these species are actually first generation molecules produced on the grains rather than the result of high-temperature gas-phase chemistry. Alternatively, some mechanism may have slowed down the infall allowing sufficient time for the hot core chemistry to proceed.
6 Conclusions and future
A quantitative framework to constrain the physical and chemical structure of protostellar envelopes on scales of 300–10000 AU has been established and applied to a single-dish survey of a set of 18 low-mass objects. The temperature and power-law density structure derived from the single dish dust continuum data is found to work well down to scales of a few hundred AU, although departures from spherical symmetry and disks start to become important these scales. In the outer envelope, the chemistry is controlled by freeze-out of CO, which also affects the abundances of other species like HCO+ and N2H+. The multi-line data for most species are well fitted with a ‘drop’ abundance profile where the molecules are heavily depleted onto grains in an intermediate cold zone. Analyses of line profiles to derive dynamical processes such as infall should take into account the fact that the molecules may not be present throughout the entire envelope.
In the inner envelope, the chemistry is controlled by the evaporation of all ices, which can be released from the grains either by passive heating or by sputtering in shocks. Complex organic molecules characteristic of a hot-core chemistry have been found in at least two sources, and interferometer data reveal small scale chemical gradients. The origin of these complex molecules, in particular whether they are first- or second-generation species, is still unclear.
There are a number of obvious future observing programs for Herschel and ALMA. Herschel will be unique in its ability to observe a multitude of gas-phase water lines. Since H2O is the dominant ice species in the outer envelope, its freeze-out and evaporation will be just as important in controlling the chemistry as that of CO. In the innermost region and in shocks, high-temperature chemical reactions can drive all of the oxygen into water, enhancing its abundance even further. ISO-LWS has given a first glimpse of the rich science associated with H2O observation of low-mass Class 0 objects (e.g., Nisini et al. 2002, Maret et al. 2002), but Herschel will improve these data by orders of magnitude in sensitivity, spatial and spectral resolution. ALMA will have unparalleled sensitivity to image many of the molecules discussed here at spatial scales down to tens of AU, revealing the chemical gradients in both the outer and the inner envelope directly, and showing their relation with any circumstellar disk and outflow material.
Acknowledgments
Research in astrochemistry in Leiden is supported by a Spinoza grant from NWO and by the Netherlands Research School for Astronomy (NOVA).
References
- (1) André, P., Ward-Thompson, D., Barsony, M. 2000, in Protostars & Planets IV, ed. V. Mannings, A.P. Boss, & S.S. Russell (University of Arizona Press, Tucson), 59
- (2) Bachiller, R., Pérez-Gutiérrez, M. 1997, ApJ 487, L93
- (3) Bergin, E.A., Ciardi, D.R., Lada, C.J., Alves, J., Lada, E.A. 2001, ApJ 557, 209
- (4) Blake, G.A., van Dishoeck, E.F., Jansen, D.J., Groesbeck, T.D., Mundy, L.G. 1994, ApJ 428, 680
- (5) Bottinelli, S., Ceccarelli, C., Lefloch, B., et al. 2004a, ApJ 615, 354
- (6) Bottinelli, S., Ceccarelli, C., Neri, R., et al. 2004b, ApJL, in press
- (7) Buckle, J.V., Fuller, G.A. 2003, A&A 399, 567
- (8) Buckle, J.V., Fuller, G.A. 2002, A&A 381, 77
- (9) Cazaux, S., Tielens, A.G.G.M., Ceccarelli, C., et al. 2003, ApJ 583, L51
- (10) Ceccarelli, C., Castets, A., Loinard, L., Caux, E., Tielens, A.G.G.M. 1998, A&A 338, L43
- (11) Ceccarelli, C., Castets, A., Caux, E., et al. 2000a, A&A 355, 1129
- (12) Ceccarelli, C., Loinard, L., Castets, A., Tielens, A.G.G.M., Caux, E. 2000b, A&A 357, L9
- (13) Ceccarelli, C., Maret, S., Tielens, A.G.G.M., Vastets, A., Caux, E. 2003, A&A 410, 587
- (14) Charnley, S., Tielens, A.G.G.M., Millar, T.J. 1992, ApJ 399, L71
- (15) Collings, M.P., Dever, J.W., Fraser, H.J., McCoustra, M.R.S., Williams, D.A. 2003, ApJ 583, 1058
- (16) Doty, S.D., Schöier, F.L., van Dishoeck, E.F. 2004, A&A 418, 1021
- (17) Garay, G., Köhnenkamp, I., Bourke, T.L. et al. 1998, ApJ 509, 262
- (18) Hogerheijde, M.R., van Dishoeck, E.F., Salverda, J., Blake, G.A. 1999, ApJ 513, 350
- (19) Jørgensen, J.K., Schöier, F.L., van Dishoeck, E.F. 2002, A&A 389, 908
- (20) Jørgensen, J.K., Hogerheijde, M.R., van Dishoeck, E.F., Blake, G.A., Schöier, F.L. 2004b, A&A 413, 993
- (21) Jørgensen, J.K., Hogerheijde, M.R., Blake, G.A., van Dishoeck, E.F., Mundy, L.G., Schöier, F.L. 2004c, A&A 415, 1021
- (22) Jørgensen, J.K., Schöier, F.L., van Dishoeck, E.F. 2004a, A&A 416, 603
- (23) Jørgensen, J.K., Schöier, F.L., van Dishoeck, E.F. 2005a, A&A submitted
- (24) Jørgensen, J.K., Schöier, F.L., van Dishoeck, E.F. 2005b, A&A submitted
- (25) Kuan, Y., Huang, H., Charnley, S.B., et al. 2004, ApJ 616, L27
- (26) Lee, J.-E., Evans, N.J., Shirley, Y.L., Tatematsu, K. 2003, ApJ 583, 789
- (27) Lee, J.-E., Bergin, E.A., Evans, N.J. 2004, ApJ, in press
- (28) Loinard, L., Castets, A., Ceccarelli, C., Caux, E., Tielens, A.G.G.M. 2001, ApJ 552, L163
- (29) Mangum, J.G., Wootten, A. 1993, ApJS 89, 123
- (30) Maret, S., Ceccarelli, C., Caux, E., Tielens, A.G.G.M., Castets, A. 2002, A&A 395, 573
- (31) Maret, S., Ceccarelli, C., Caux, E., et al. 2004, A&A 416, 577
- (32) Maret, S., et al. 2005, in preparation
- (33) Motte, F., André, P. 2001, A&A 365, 440
- (34) Nisini, B., Giannini, T., Lorenzetti, D. 2002, ApJ 574, 246
- (35) Roberts, H., Fuller, G.A., Millar, T.J., Hatchell, J., Buckle, J.V. 2002, A&A 381, 1026
- (36) Roberts, H., Herbst, E., Millar, T.J. 2003, ApJ 591, L41
- (37) Schöier, F.L., Jørgensen, J.K., van Dishoeck, E.F., Blake, G.A. 2002 A&A 390, 1001
- (38) Schöier, F.L., Jørgensen, J.K., van Dishoeck, E.F., Blake, G.A. 2004, A&A 418, 185
- (39) Schöier, F.L., van der Tak, F.F.S., van Dishoeck, E.F., Black, J.H. 2005, A&A, in press
- (40) Shah, R.Y., Wootten, A. 2001, ApJ 554, 933
- (41) Shirley, Y.L., Evans, N.J., Rawlings, J.M.C., Gregersen, E.M. 2000, ApJS 131, 249
- (42) Tafalla, M., Myers, P.C., Caselli, P., Walmsley, C.M., Comito, C. 2002, ApJ 569, 815
- (43) van der Tak, F.F.S., van Dishoeck, E.F., Caselli, P. 2000, A&A 361, 327
- (44) van Dishoeck, E.F., Blake, G.A., Jansen, D.J., Groesbeck, T.D. 1995, ApJ 447, 760
- (45) van Zadelhoff, G.J., Dullemond, C.P., van der Tak, F.F.S., et al. 2002, A&A 395, 373
- (46) Wakelam, V., Castets, A., Ceccarelli, C., Lefloch, B., Caux, E., Pagani, L. 2004, A&A 413, 609