The broad-band spectrum of the persistent emission from SGR 1806-20
We present the results of an analysis of the quiescent X-ray emission from the Soft Gamma-Ray Repeater SGR 1806-20, taken during an INTEGRAL ultra-deep survey of the Galactic Center region in autumn 2003. The total effective exposure time spent on the source by the IBIS telescope during these observations exceeded 1.5 million seconds. Combining the INTEGRAL results with results from the XMM-Newton observatory, we present the broad band (1-200 keV) spectrum of the quiescent emission from this source. This is the first spectrum of the persistent emission from an SGR in the broad energy range up to 200 keV. The luminosity of SGR 1806-20 in this range was ergs s-1 for an assumed distance of 15 kpc. We show that weak undetected bursts should not contribute significantly to the quiescent emission. The spectrum of the source is very hard and has a power law shape without any trace of a high energy cutoff up to 160 keV. No strong cyclotron line was detected in the persistent spectrum in the previously reported 4-6 keV band. During our next observations in the autumn 2004 source went to active phase and its avereged flux between powerful bursts was 2-3 times higher than in 2003. During these observations two other SGR candidates, SGR 1801-23 and SGR 1808-20, were in the field of view. Neither persistent hard X-ray emission nor bursts were detected from them. The upper limit on the persistent flux from each of them in the energy band 18-100 keV is about erg s-1 cm-2.
Key Words.:
Gamma Rays: bursts; pulsars: general; stars: individual: SGR 1806-201 Introduction
Soft gamma repeaters (SGRs) are rare objects which have been discovered by their sporadic bursting activity. The bursts may last anywhere from 100 ms to many minutes in a few cases, and their spectra may extend up to 100 keV or beyond. These properties make them easily observable for small, isotropic hard X-ray and soft gamma ray experiments (see e.g. Mazets & Golenetskii 1981a , Hurley 2000, Aptekar et al. (2001), Woods & Thompson (2004) for reviews). In particular, SGR 1806-20 was discovered and localized on January 7, 1979 during a single short (duration less than a quarter of second) flare in soft gamma rays (Mazets & Golenetskii 1981b , Laros et al. (1986)). Numerous bursts have been detected from this source since then (Hurley (1986), Laros et al. (1987), Kuznetsov et al. (1987), Atteia et al. (1987), Kouveliotou et al. (1987)) and intermittent bursting activity has continued up to the present day.
The energy emitted by SGRs is in many cases significantly larger than that available from the rotational spin-down. Therefore an additional energy reservoir is needed to power the observed emission. The most widely accepted model for SGRs suggests that this power comes not from accretion but rather due to the decay of an ultra-strong magnetic field of an isolated neutron star (the “magnetar” model, Paczyński 1992; Duncan & Thompson 1992; Thompson & Duncan 1995).
Studies of the four known SGRs in soft X-rays (2-10 keV) have revealed that they emit a persistent X-ray flux (Hurley et al. (1996), Hurley et al. (1999), Kulkarni et al. (2003), Kouveliotou et al. (2003), Mereghetti et al. (2000), Woods et al. (2001)). The study of their persistent hard X-ray emission is more difficult, because of the weak fluxes and the locations of the sources in crowded fields. The INTEGRAL mission, however, with its imaging detectors operating in the hard X-ray and gamma-ray ranges (Winkler et al. 2003b ), has made the study of these sources possible up to energies which have not been explored before.
In this letter we present the broad band spectrum (1-200 keV) of the persistent emission of SGR 1806-20 obtained with long exposures by the INTEGRAL observatory in autumn 2003. The source flux was erg s-1 cm-2, which corresponds to a source luminosity erg s-1 in this energy band (assuming a source distance of 15 kpc). In a companion paper, Mereghetti et al. (2004) present independent evidence, from a separate observation, of hard, persistent X-ray emission from this source. Note that the persistent emission of SGR 1806-20 varies with time. For example, during recent 2004 observations The RXTE/PCA (Woods et al. (2004)) and INTEGRAL (Molkov et al. 2004a ) detected a high level of burst activity and 2-3 times more persistent flux in the hard X-rays (Molkov et al. 2004b ) than in the autumn of 2003.

2 Observations and data analysis
SGR 1806-20 is located from the Galactic Center and it was therefore observed by the wide field telescopes aboard INTEGRAL (IBIS and SPI), but was outside the field of view of JEM-X during the ultra-deep survey of the Galactic Center field performed during the Russian share of the INTEGRAL Open time AO-1 observing program (ID0120213; August 23 - September 24, 2003). The total exposure time of these observations is Msec. In order to distinguish the flux of SGR 1806-20 from that of nearby bright X-ray sources we used only data from the IBIS/ISGRI telescope (Ubertini et al. (2003)) which has moderate angular resolution (). The SPI telescope has angular resolution and cannot work in such a crowded field. IBIS/ISGRI effectively operates in the energy range 18–400 keV with typical sensitivity 1.5 mCrab for one orbit ( days) of observations. The fully coded field of view of this telescope is , and the zero response field of view is . Due to the fact that the source was practically always outside of the fully coded field of view (the region of maximum effective area of the telescope) the effective exposure is lower than the total exposure time, namely Msec. The distribution of exposure time as a function of offset angle is presented in Fig.1
The IBIS/ISGRI data analysis was done with the software developed by Eugene Churazov at the Space Research Institute, Moscow and described in the paper of Revnivtsev et al. (2004). For the spectral reconstruction we used the ratio of the fluxes measured in various energy channels to the fluxes measured by the ISGRI detector from the Crab Nebula in the same energy bands; wherever possible the ratios were calculated for the same positions in the telescope field of view.
In order to extend the spectrum of SGR 1806-20 to lower energies we have used the data from an XMM-Newton observation performed on October 7, 2003, i.e. practically simultaneously with our observation. In the analysis we have used the data of the PN and MOS1 cameras, which were processed with the Science Analysis System (SAS) v6.0.0.
3 Results
3.1 SGR 1806-20
The first deep IBIS/ISGRI map of Galactic Center region was presented in the work Revnivtsev et al. (2004). SGR 1806-20 was detected in the 18-60 keV energy range, along with sixty other sources. It was the first report of the detection of this source in hard X-rays.
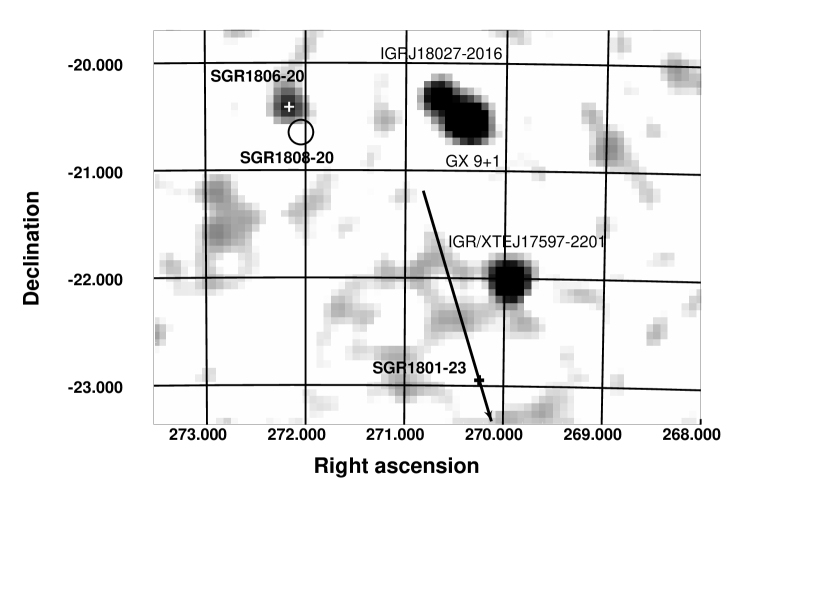
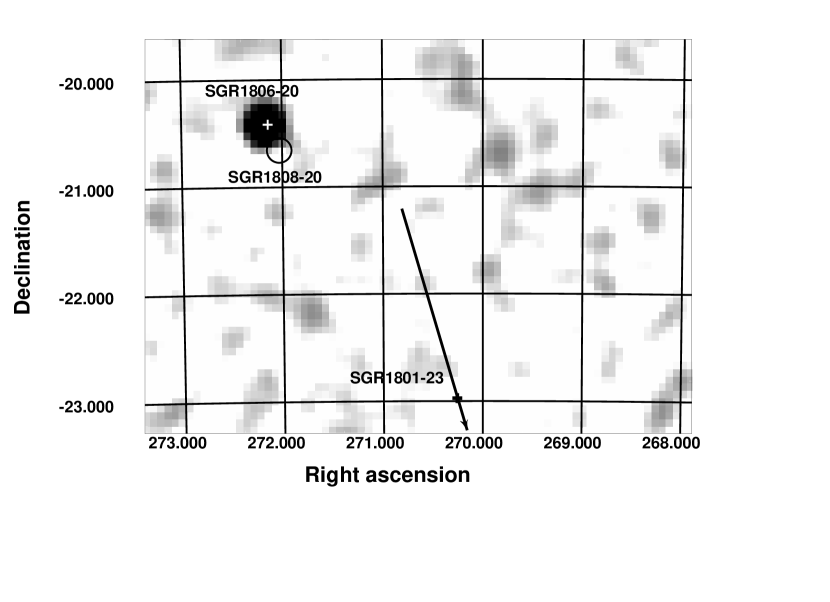
During our INTEGRAL observations the source burst numerous times (Sunyaev et al. (2003), Götz et al. 2004). In order to demonstrate that the origin of these bursts was SGR 1806-20 and not from other possible candidates (SGR 1808-20, Lamb et al. (2003) or SGR 1801-23, Cline et al. (2000)) in the wide field of view of IBIS/ISGRI we present the image around SGR 1806-20, collected during all the bursts which were detected during our observations. Detailed analysis of these bursts and others detected by INTEGRAL will be presented in a separate paper. On the lower panel of Fig.2 we present the time-averaged map for the same region. Note that SGR 1806-20 is clearly detected.
The burst and quiescent emission of SGR 806-20 are believed to originate from different regions on and around the neutron star, and are thought to be due to different mechanisms. Therefore, to obtain the spectrum of the quiescent emission, it is necessary to eliminate any possible contribution from bursts.

To do this, we constructed the statistical distribution of the detector count rates with time resolution 0.01 s. We identified candidate bursts as time intervals where the count rate during at least four consecutive bins exceeded the mean value of the count rate by more than four times the RMS value. Only those candidate bursts which demonstrated the clear presence of a point-like source on the image constructed during the burst intervals were considered as real. All the “real” bursts detected during our observations originated from SGR 1806-20. Their typical duration was msec. The minimum number of counts from the source during these bursts was 40-50, which corresponds to a minimum fluence erg cm-2. The majority of the remaining candidate events are probably caused by the anomalous short-term activation of one of the detector pixels (the so-called “short-lived hot pixels”). During these intervals more than 50% of all detected counts come from only one pixel, while for “real” bursts this fraction is typically less than 10%. Also, these bursts did not produce a point source image.
The summed spectrum of all the “real” bursts is presented in Fig.3. The best fit spectrum using an optically thin thermal plasma fit ( model in XSPEC fitting package) has , which is consistent with that presented by Götz et al. (2003) for one of the brightest bursts detected in a different set of observations.
We have filtered out the detected bursts from our data and have constructed the time-averaged spectrum of the total (i.e. pulsed plus unpulsed) persistent emission from SGR 1806-20. In order to complement this hard X-ray spectrum with the spectrum at lower, X-ray energies we have used the publicly available data from the XMM-Newton (EPIC-pn and EPIC-MOS1) observations of the source carried out on October 7, 2003. The broad- band spectrum of SGR 1806-20 is presented in Fig. 3. In this figure we have rescaled the XMM spectrum by 35% in order to match the INTEGRAL/IBIS normalization. This discrepancy in the normalization factor could be partially caused by the intrinsic source variability, but it is likely that most of the difference originates in the uncertain cross-calibration of the INTEGRAL and XMM instruments (see e.g. Courvoisier et al. (2003)). The spectrum can be well described by a single power law with photoabsorption (presumably interstellar). We have not detected statistically significant temporal variations of the source spectral shape in our observations. The best fit photon index for the time-averaged spectrum between 18 and 200 keV is and the absorption column cm-2. A lower limit on a possible exponential cutoff in the spectrum of the form is keV (2 lower limit). The reduced for the best fit model is 1.15 for 294 degrees of freedom. The total observed flux in the 1-200 keV energy band is erg s-1 cm-2 (not corrected for absorption). This is approximately 8 times higher than the source emissivity in X-rays keV. For an assumed source distance of 15 kpc (Corbel & Eikenberry (2004)) the observed broad-band source flux corresponds to a luminosity erg s-1. The energy loss due to the spin down of the neutron star in SGR 1806-20 is approximately three orders of magnitude smaller, namely erg s-1 (Kouveliotou et al. (1998)). Obviously the rotational energy loss cannot power either the observed X-ray emission or the hard X-ray (20-200 keV) emission.
The RXTE/PCA has detected a relatively strong narrow line at 5 keV during some bright bursts, interpreted as cyclotron absorbtion (Ibrahim et al. (2002, 2003)). The high quality 1-10 keV XMM spectrum of SGR 1806-20 allows us to put constraints on the possible presence of such a feature in the persistent spectrum of the source during this observation. Fixing the energy of the line to the 4.0-6.0 keV range, we can place an upper limit on a possible absorption line component in the spectrum. The 2 upper limit on the line equivalent width varies eV for 0.1 keV width of the line and 160 eV for 0.5 keV width of the line. This is significantly smaller than the equivalent width of the line detected by the RXTE/PCA during the bursts, eV. The large difference between the two equivalent widths may be connected with differences in the physical conditions leading to formation of burst and persistent spectra.
3.2 SGR 1801-23 and SGR 1808-20
During our INTEGRAL observations two SGR candidates were in the field of view. Both sources have rather large location uncertainties. SGR 1808-20 is localized to a arcmin radius circle and SGR 1801-23 to a arcmin error box. The error boxes of the both sources were entirely in the IBIS field of view (see the Fig.2). Neither persistent nor bursting emission was detected from these sources. The upper limit on the persistent flux from these sources is about erg s-1 cm-2.
4 Discussion
Although we do not know the exact mechanism which produces the persistent emission of SGR 1806-20, we can nevertheless exclude a significant contribution to it from weak, undetected bursts by the following argument. We can estimate the contribution using the number-intensity distribution of the bursts presented in Gogus et al. (2000) and Götz et al. (2004). The peak number of detected bursts with fluence ergs cm-2 is approximately 20-30 bursts per 10 days. The total flux that bursts with fluences lower than this can produce during the exposure time of our observations is not more than a few erg s-1 cm-2 if we assume that the number-fluence distribution of bursts from SGR 1806-20 can be described by a function (see Gogus et al. (2000), Götz et al. (2004)). This flux does not contribute even one percent to the detected persistent flux of SGR 1806-20. Therefore we can conclude that the detected quiescent spectrum of SGR 1806-20 cannot be strongly affected by weak undetected bursts. Additional indirect support for this conclusion comes from the completely different spectral shapes of the bright bursts and the quiescent emission detected during our observations (see Fig.3).
Acknowledgments. The authors thank E.Churazov for the development of the analysis methods for the IBIS data and software. This research has made use of data obtained through the INTEGRAL Science Data Center (ISDC), Versoix, Switzerland, Russian INTEGRAL Science Data Center (RSDC), Moscow, Russia. KH is grateful for support under the INTEGRAL U.S. guest investigator program, NASA grant NAG5-13738.
References
- Aptekar et al. (2001) Aptekar R.L., Frederiks S.V., Golenetskii V.N. et al., 2001, ApJSS, 137, 227
- Atteia et al. (1987) Atteia J.-L., Boer, M., Hurley, K. et al. 1987, ApJ, 320, L105
- Cline et al. (2000) Cline, T.L., Frederiks, D., Golenetskii, S. et al. 2000, ApJ,531, 407
- Duncan & Thompson (1992) Duncan, R.C., & Thompson, C. 1992, ApJ, 392, L9
- Gogus et al. (2000) Gogus E., Woods P, Kouveliotou C. et al. 2000, ApJ, 532, 121L
- Corbel & Eikenberry (2004) Corbel, S. & Eikenberry, S. S. 2004, A&A, 419, 191
- Götz et al. (2004) Götz D., Mereghetti S., Mirabel F. et al. 2003, Proceedings of the 5th INTEGRAL Workshop (in press), astro-ph/0405135
- Courvoisier et al. (2003) Courvoisier, T. J.-L., Beckmann, V., Bourban, G. et al. 2003, A&A, 411, L343
- Hurley (1986) Hurley, K., talk delivered at Los Alamos Workshop on “Gamma-Ray Stars”, Taos, NM
- Hurley et al. (1996) Hurley, K., Li, P., Vrba, F. et al. 1996, ApJ 463, L13
- Hurley et al. (1999) Hurley, K., Li, P., Kouveliotou, C., et al. 1999, ApJ 510, L111
- Hurley (2000) Hurley, K. 2000, AIP Conf. Proc. 526: Gamma-ray Bursts, 5th Huntsville Symposium, 526, 763
- Ibrahim et al. (2002) Ibrahim, A., Safi-Harb, S., Swank J. et al., ApJ, 574, L51-L55
- Ibrahim et al. (2003) Ibrahim, A., Swank, J. and Parke, W., ApJ, 584, L17-L21.
- Kouveliotou et al. (1987) Kouveliotou, C., Norris, J., Cline, T. et al. 1987, ApJ, 322, L21
- Kouveliotou et al. (1998) Kouveliotou, C., Dieters, S., Strohmayer, T. et al. 1998, Nature 393, 235
- Kouveliotou et al. (2003) Kouveliotou, C., Eichler, D., Woods, P. et al. 2003, ApJ, 596, L79
- Kulkarni et al. (2003) Kulkarni, S.R., Kaplan, D., Marshall, H. et al. 2003, ApJ, 585, 948
- Kuznetsov et al. (1987) Kuznetsov, A. V., Syunyaev, R. A., Terekhov, O. V., et al., 1987, Soviet Astronomy Letters, 13, 419
- Lamb et al. (2003) Lamb, D., Graziani, C., Shirasaki, Y. et al. 2003, GCN Circ. 2351
- Laros et al. (1986) Laros, J., Fenimore, E., Fikani, M., et al., 1986, Nature 322, 152
- Laros et al. (1987) Laros, J., Fenimore, E., Klebesadel, R. et al., 1987, ApJ, 320, L111
- (23) Mazets, E. P. & Golenetskii, S. V. 1981a, Astrophysics and Space Physics Reviews, 1, 205
- (24) Mazets, E.P. & Golenetskii, S.V. 1981b, Ap&SS, 75, 47
- Mereghetti et al. (2000) Mereghetti, S., Mignani, R., Covino, S. et al. 2000, A&A, 361, 240
- Mereghetti et al. (2004) Mereghetti, S. et al. 2004, Astron. Astrophysics Letters, this volume
- (27) Molkov, S., Ubertini, P., Jorgensen, C. et al. 2004, The Astronomer’s Telegram, 324
- (28) Molkov, S., Hurley, K., Lutovinov, A., & Sunyaev, R. 2004, The Astronomer’s Telegram, 325
- (29) Paczyński, B. 1992, Acta Astronomica 42, 145
- Revnivtsev et al. (2004) Revnivtsev M., Sunyaev R., Varshalovich D. et al. 2004, Astr.Lett. 30, 382
- Sunyaev et al. (2003) Sunyaev, R.A., Zheleznyakov V. V., Cherepashchuk, A. M. et al. 2003, ATel.183
- Thompson & Duncan (1995) Thompson, C., & Duncan, R.C. 1995, MNRAS, 275, 255
- Ubertini et al. (2003) Ubertini P., Lebrun F., Di Cocco G., et al. 2003, Astron. Astrophysics, v.411, p.L131-L139
- (34) Winkler, C., Courvoisier, T.J.-L., Di Cocco, G. et al. 2003, Astron. Astrophys., 411, L1
- (35) Winkler, C., Gehrels, N., Schönfelder, V. et al. 2003, Astron. Astrophys., 411, L349
- Woods et al. (2001) Woods P.M., Kouveliotou, C., Gogus, E. et al. 2001, ApJ, 552, 748
- Woods & Thompson (2004) Woods P.M. & Thompson C. 2004, astro-ph 0406133
- Woods et al. (2004) Woods, P. M., Kouveliotou, C., Gogus, E. et al. 2004, The Astronomer’s Telegram, 313