INTEGRAL discovery of persistent hard X-ray emission from the Soft Gamma-ray Repeater SGR 1806–20††thanks: Based on observations with INTEGRAL, an ESA project with instruments and science data centre funded by ESA member states (especially the PI countries: Denmark, France, Germany, Italy, Switzerland, Spain), Czech Republic and Poland, and with the participation of Russia and the USA.
We report the discovery of persistent hard X-ray emission extending up to 150 keV from the soft gamma-ray repeater SGR 1806–20 using data obtained with the INTEGRAL satellite in 2003-2004. Previous observations of hard X-rays from objects of this class were limited to short duration bursts and rare transient episodes of strongly enhanced luminosity (“flares”). The emission observed with the IBIS instrument above 20 keV has a power law spectrum with photon index in the range 1.5–1.9 and a flux of 3 milliCrabs, corresponding to a 20-100 keV luminosity of 1036 erg s-1 (for a distance of 15 kpc). The spectral hardness and the luminosity correlate with the level of source activity as measured from the number of emitted bursts.
Key Words.:
Gamma Rays: bursts – Pulsars: general – Stars: individual: SGR 1806–201 Introduction
Soft gamma-ray repeaters (SGRs) are a small group of high-energy sources that were discovered through the observation of short bursts in the hard X/soft -ray range (for a review see Hurley 2000). The bursts have typical durations of the order of a few hundred milliseconds and are emitted during sporadic “active” periods that can last from weeks to months. Their spectra above 20 keV have been well described by optically thin thermal bremsstrahlung with temperatures 30-40 keV (but see Feroci et al. 2004 and Olive et al. 2004 for the spectra of bursts at other energies).
For several years after their discovery, SGRs could not be unambiguously associated with persistent sources at other wavelengths, with the exception of SGR 0525–66. The precise localization of the latter source placed it in the Large Magellanic Cloud supernova remnant N49, hinting at a neutron star origin (Cline et al. 1982). More recent observations of the SGR burst locations with X-ray imaging satellites led to the identification of their persistent counterparts in the 0.5–10 keV X-ray range. This proved to be crucial in confirming the neutron star hypothesis through the discovery of coherent pulsations (periods of 7.5 and 5.2 s) and secular spin-down in the range 10-11–10-10 s s-1 in two of these sources (SGR 1806–20 and SGR 1900+14 ; Kouveliotou et al. 1998; Hurley et al. 1999a). Furthermore, the association with clusters of massive stars (Mirabel et al. 2000) indicates that SGRs are relatively young objects. The most successful model advanced to explain the SGRs involves neutron stars with a very high magnetic field, or “magnetars” (Duncan & Thompson 1992, Thompson & Duncan 1995). In magnetars, which are assumed to have internal fields much higher than the quantum critical value G, the dominant source of free energy is the magnetic field, rather than rotation as in the ordinary radio pulsars. This energy is enough to power both the bursts and the persistent X-ray emission (L1034-1035 erg s-1).
The study of the persistent emission from SGRs has been carried out at energies below 10-20 keV to date. The only observations of SGRs at higher energies, besides those of the bursts, were limited to a small number of exceptionally bright transient events, the so called “giant” and “intermediate” flares, which occurred in SGR 0525–66 (Mazets et al. 1979) and in SGR 1900+14 (Hurley et al. 1999b, Guidorzi et al. 2004). Here we report the discovery of emission extending up to 150 keV from the quiescent counterpart of the soft gamma-ray repeater SGR 1806–20. Some evidence for this high-energy component was reported in a preliminary analysis of a subset of the data presented here (Götz et al. 2004b, Bird et al. 2004). In a companion paper Molkov et al. (2005) report independent evidence from different INTEGRAL observations of persistent hard X-ray (20 keV) emission from this source.
| Observing | Net exposure | Flux 20-60 keV | Flux 60-100 keV |
|---|---|---|---|
| Period | (ksec) | (counts s-1) | (counts s-1) |
| 2003 March 12 - April 23 | 233 | 0.2860.043 | 0.100.03 |
| 2003 September 27 - October 15 | 278 | 0.3440.041 | 0.090.03 |
| 2004 February 17 - April 19 | 285 | 0.3410.043 | 0.050.03 |
| 2004 September 21 - October 14 | 213 | 0.5110.050 | 0.190.03 |
| 2003 March 12 - 2004 Oct. 14 | 1033 | 0.3750.022 | 0.1020.015 |
2 Data Analysis and Results
The location of SGR 1806–20 has been repeatedly observed by the INTEGRAL gamma-ray satellite in 2003-2004 (Winkler et al. 2003) in the course of Core Program (consisting of regular scans along the Galactic plane and bulge), deep exposures of the Galactic Center region, and Target of Opportunity observations. Here we concentrate on the Core Program data obtained with the IBIS instrument (Ubertini et al. 2003), which provides imaging above 15 keV with an unprecedented combination of sensitivity (milliCrab) and angular resolution (12′) using the coded mask imaging technique.
The available data consist of more than 500 individual pointings in which SGR 1806–20 was observed at different off-axis angles. The typical integration time of most pointings is 1800 s (those obtained after May 2004 lasted 2200 s each). We restrict our analysis to the pointings in which SGR 1806–20 was in the central part of the field of view (radius 8∘), where the sensitivity is higher and the instrument calibration is better known. This results in a total exposure time of one million seconds (corrected for the vignetting effect). The observations, spanning almost two years, were concentrated in four periods of 1-2 months each due to the visibility constraints of the satellite, as indicated in Table 1. We used the data obtained with the IBIS lower energy detector ISGRI (Lebrun et al. 2003), an array of 128128 CdTe pixels providing a geometric area of 2600 cm2 in the nominal energy range 15 keV - 1 MeV.
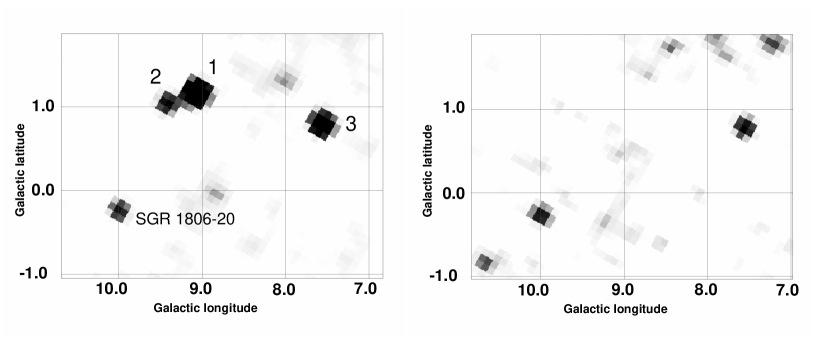
The detector images in the 20-60 and 60-100 keV energy ranges of the individual pointings were deconvolved, cleaned and co-added using version 4.1 of the Offline Scientific Analysis software (Goldwurm et al. 2003) provided by the INTEGRAL Science Data Center (Courvoisier et al. 2003). A 4.54.5∘ region of the resulting mosaics is shown in Fig. 1. A source with a significance of 17.2 is detected in the lowest energy range at the Chandra position of SGR 1806–20 (Kaplan et al. 2002). Several other sources are visible in the image (see figure caption for details). SGR 1806–20 is also detected in the 60-100 keV energy range, with a significance of 6.9. The source count rates of 0.3750.022 counts s-1 and 0.1020.015 counts s-1 measured in the soft and hard energy ranges correspond to a flux of 3 mCrabs.
Except for the period March-April 2003, the source was in a bursting state during the reported observations, leading to the detection of several bursts in the IBIS data111the analysis of those observed in September-October 2003, showing an anticorrelation between hardness and intensity of the bursts, has been reported in Götz et al. (2004a). A few pointings containing some strong bursts (Mereghetti et al. 2004a, Golenetski et al. 2004) were removed from the analysis described above. The effect of the remaining ones is negligible: their cumulative contribution of 16,000 counts in about 50 bursts, corresponds to 4% of the total number of source counts in the integrated images.
Analyzing the data for the four observing periods separately in the same way, we derived the fluxes reported in Table 1, which give some evidence for an increase in the source hard X-ray luminosity with time (see Fig. 3b). A fit of the 20-60 keV count rate values with a constant flux gives a =12.3, corresponding to a 6.510-3 probability.
For the spectral analysis we produced images in 9 energy intervals in the range 15-300 keV. The count rates extracted from the images were fit using the latest available response matrices (RMF v11, ARF v5). Since the first three observing periods yielded consistent spectral parameters, we analyzed them together, obtaining a best fit power law photon index =1.90.2 and a 20-100 keV flux F20-100=(4.70.5)10-11 erg cm-2 s-1 (all errors are 1). During the last observing campaign (Sept-Oct 2004) the corresponding parameters were =1.50.3 and F20-100=(8.00.9)10-11 erg cm-2 s-1. Thus there is some evidence for a harder spectrum coupled with a flux increase. The two spectra are shown in Fig. 2a and 2b. Note that the higher flux and harder spectrum of the Sept.-Oct. 2004 period lead to a significant detection of SGR 1806–20 up to the 100-150 keV energy bin. For comparison, Fig. 2c shows the typical spectrum of one of the bursts (note that the intensity has been scaled down by a factor 104). It can be seen that the bursts have a much softer spectrum than the persistent emission.
3 Discussion
Observations of SGR 1806–20 below 10 keV carried out with BeppoSAX and ASCA indicated a power law spectrum with photon index 2 and unabsorbed 2-10 keV flux of 1.610-11 erg cm-2 s-1 (Mereghetti et al. 2000). Although the detection of pulsations in the 10-20 keV range with RossiXTE (Göǧüş et al. 2002) showed that the emission from SGR 1806–20 extends above the soft X-ray range, no spectral information was available above 10 keV and the BeppoSAX spectrum could be fitted equally well by a thermal bremsstrahlung model with temperature kT=11 keV. The extrapolation of the BeppoSAX power law spectrum lies below the average value obtained with INTEGRAL. On the other hand, a good agreement is found between the INTEGRAL spectra and those measured below 10 keV with XMM-Newton in 2003-2004 (Mereghetti et al. 2004b). This is shown by the dashed lines in Fig. 2, which indicate the extrapolations of the XMM-Newton power law spectra measured at dates consistent with the INTEGRAL observations (Fig.2a: 7 October 2003; Fig.2b: 6 October 2004).
In Fig. 3 we compare the hard X-ray flux measured with INTEGRAL with the level of activity from SGR 1806–20 as a function of time. This is indicated by the number of bursts detected by the Interplanetary Network (IPN). The source was quiescent during the first INTEGRAL observing period and moderately active in the two following periods. The last INTEGRAL observations, in which a harder and brighter persistent emission was detected, took place after the strong reactivation of the Summer 2004. SGR 1806–20 was still particularly active in September-October 2004 (Mereghetti et al. 2004a, Golenetski et al. 2004).
The detection of pulsed hard X-rays (20-150 keV) from the Anomalous X-ray Pulsar 1E 1841–045 has been recently reported by Kuiper et al. (2004). Anomalous X-ray Pulsars (AXPs) share many similarities with the SGRs (Mereghetti et al. 2002) and are also thought to be magnetars (see Woods & Thompson 2004 for a recent review). It is therefore interesting to compare our results with those obtained for this source. The high-energy emission from 1E 1841–045, with a power law photon index =1.470.05, is definitely harder than that displayed by SGR 1806–20 before September 2004. This value of the photon index, obtained with the RXTE/HEXTE instrument, refers to the total (pulsed plus unpulsed) flux and is consistent with the results of the INTEGRAL flux measurements in the 18-60 and 60-120 keV ranges (Molkov et al. 2004). The spectrum of the pulsed component in 1E 1841–045 is even harder (=0.940.16; Kuiper et al. 2004). When compared to lower energy measurements, these results imply that the spectrum of the AXP has a significant hardening above 10 keV. This contrasts with the situation seen in Figs. 2(a) and 2(b) for SGR 1806–20.
The hard X-ray emission from magnetars has been discussed in the context of a model involving currents in a globally twisted magnetosphere by Thompson, Lyutikov & Kulkarni (2002). A non-thermal tail in the X-ray spectrum is predicted as a result of multiple resonant cyclotron scattering. According to these authors, the differences between SGRs and AXPs, i.e. the emission of bursts in SGRs, as well as their harder spectra and faster spin down rate, are explained by a larger degree of twist in the external magnetic field. Our observation of a harder persistent spectrum when the bursting activity of SGR 1806–20 was at its highest level indicates that this correlation, previously seen when comparing different sources, also holds within the same object.


4 Conclusions
Thanks to the high sensitivity of the INTEGRAL IBIS instrument we have discovered a hard X-ray component extending to 150 keV in the persistent emission from SGR 1806–20. The imaging capabilities of IBIS have been crucial for the observation of this crowded region of the Galactic plane: they allow us to unambiguously associate the observed hard X-ray emission with SGR 1806–20.
The hard X-rays correlate in intensity and spectral hardness with the level of bursting activity, and, contrary to what is observed in the AXP 1E 1841–045, a comparison with lower energy data does not indicate evidence for a spectral hardening at 10-20 keV. The INTEGRAL data provide the first detection of persistent emission in this energy range for a SGR and open a new important diagnostic to study the physics of magnetars (see, e.g., Thompson & Beloborodov 2004).
Acknowledgements.
This work has been partially supported by the Italian Space Agency. KH is grateful for support under NASA’s INTEGRAL U.S. Guest Investigator program, grant NAG5-13738.References
- (1) Bird A.J., Barlow E.J., Bassani L. et al. 2004, ApJ 607, L33
- (2) Cline T.L., Desai U.D., Teegarden B.J., et al. 1982, ApJ 255, L45
- (3) Courvoisier T. et al. 2003, A&A 411, L53
- Duncan & Thompson (1992) Duncan, R.C., & Thompson, C. 1992, ApJ, 392, L9
- (5) Feroci M., Caliandro G. A., Massaro E., Mereghetti S. & Woods P. M. 2004, ApJ 612, 408
- Göğüş et al. (2001) Göğüş, E., Kouveliotou, C., Woods, P.M., et al. 2002, ApJ, 577, 929
- (7) Goldwurm A., David P., Foschini L. et al. 2003, A&A 411, L223
- (8) Golenetskii S.V., Aptekar R., Mazets E. et al. 2004, GCN Circular n. 2769
- (9) Götz, D., Mereghetti S., Mirabel F.I. & Hurley K. 2004a, A&A 417, L45
- (10) Götz, D., Mereghetti S., Mirabel F.I. et al. 2004b, in proceedings of the 5th INTEGRAL Workshop, The INTEGRAL Universe, V.Schönfelder, G.Lichti & C.Winkler eds., ESA SP-552, 615
- (11) Guidorzi C., Frontera F., Montanari E. et al. 2004, A&A 416, 297
- (12) Hurley K. et al. 1999a, ApJ 510, L111.
- (13) Hurley K., Cline T., Mazets E. et al. 1999b, Nature 397, 41
- Hurley (2000) Hurley, K. 2000, in AIP Conf. Proc. 526, 5th Hunstville Symp. on Gamma-Ray Bursts, ed. R.M. Kippen, R.S. Mallozzi, & G.F. Fishman (New York: AIP), 763
- Kaplan et al. (2002) Kaplan, D.L., Fox, D.W., Kulkarni, S.R., et al. 2002, ApJ 564, 935
- (16) Kouveliotou C. et al. 1998, Nature 393, 235.
- (17) Kuiper L., Hermsen W. & Mendez M. 2004, ApJ 613, 1173
- Lebrun et al. (2003) Lebrun, F., Leray, J.P., Lavocat, P., et al. 2003, A&A, 411, L141
- (19) Lutovinov A., Walter R., Belanger, G. et al. 2003, ATel 155
- (20) Mazets E.P. et al. 1979, Nature 282, 587
- Mereghetti et al. (2000) Mereghetti S., Cremonesi D., Feroci M. & Tavani M. 2000, A&A 361, 240
- (22) Mereghetti S., Chiarlone L., Israel G.L. & Stella L. 2002, in Neutron Stars, Pulsars and Supernova Remnants, eds. W.Becker, H.Lesch and J.Trümper, MPE-Report 278, 29.
- (23) Mereghetti S.,Götz D., Borkowski J. et al. 2004a, GCN Circular n. 2763
- Mereghetti et al. (2004) Mereghetti S., Tiengo A., Esposito P. et al. 2004b, submitted to The Astrophysical Journal
- (25) Mirabel I.F., Fuchs Y. & Chaty S. 2000, in AIP Conf. Proc. 526, 5th Hunstville Symp. on Gamma-Ray Bursts, ed. R.M. Kippen, R.S. Mallozzi, & G.F. Fishman (New York: AIP), 814
- (26) Molkov S.V et al. 2005, A&A this issue, astro-ph/0411696
- (27) Molkov S.V., Cherepashchuk A.M., Lutovinov A.A. et al. 2004, Astronomy Lettes 30, 534
- (28) Olive J-F., Hurley K., Sakamoto T. et al. 2004, ApJ 616, 1148
- (29) Revnivtsev M.G., Sunyaev R.A., Varshalovich D.A. et al. 2004, Astronomy Letters 30, 382
- Thompson & Duncan (1995) Thompson, C., & Duncan, R.C. 1995, MNRAS, 275, 255
- (31) Thompson C., Lyutikov M. & Kulkarni S.R. 2002, ApJ 574, 332
- (32) Thompson C. & Beloborodov A.M. 2004, astro-ph/0408538
- Ubertini et al. (2003) Ubertini P. et al. 2003, A&A, 411, L131
- Winkler et al. (2003) Winkler, C, Courvoisier, T.J.-L., Di Cocco G., et al. 2003, A&A, 411, L1
- (35) Woods P.M. & Thompson C. 2004, astro-ph/0406133