Survey for Galaxies Associated with Damped Lyman Systems I: Spectroscopic Calibration of BVRI Photometric Selection
Abstract
We present a survey for Lyman break galaxies (LBGs) associated with damped Lyman systems (DLAs) with the primary purpose of determining the DLA-LBG cross-correlation. This paper describes the acquisition and analysis of imaging and spectroscopic data of 9 quasar fields having 11 known DLAs covering an area of 465 arcmin2. Using deep BVRI images, 796 LBG candidates to an apparent RAB magnitude of 25.5 were photometrically selected from 17,343 sources detected in the field. Spectroscopic observations of 529 LBG candidates using Keck yielded 339 redshifts. We have conservatively identified 211 objects with . We discuss our method of LBG identification and present a model of the BVRI photometric selection function. We use the 339 spectra to evaluate our BVRI Lyman break photometric selection technique.
1 INTRODUCTION
Over the last decade, high redshift surveys to detect Lyman break galaxies (LBGs) by photometric pre-selection, (Steidel et al., 1996a, b; Lowenthal et al., 1997), have been successful in compiling catalogs of galaxy spectra at . This has become an efficient technique to obtain statistical information of high redshift galaxies via their emission properties. Analysis of the LBG spatial distribution shows significant clustering which supports the belief that they are biased tracers of mass and form in overdense regions. The LBG auto-correlation function (Steidel et al., 1998; Adelberger et al., 1998, 2003) and best-fit star formation models (Shapley et al., 2001) suggest LBGs are massive objects that most likely evolve into early-type galaxies by the present day. LBG surveys, such as the spectroscopic sample, are magnitude limited and only probe the higher end of the proto-galactic mass distribution.
By contrast, quasar (QSO) absorption line systems represent a population of high redshift protogalaxies whose detections are not biased by their intrinsic magnitude. Their detection is dependent only on the strengths of their absorption line features and the brightness of the background QSO. The Damped Lyman systems (DLAs) are the highest column density absorbers, defined to have N(HI) atoms cm-2 as established by Wolfe et al. (1986). DLAs are drawn from the bulk of the proto-galactic mass distribution and harbor the majority of the neutral hydrogen present in the universe. The agreement between the comoving mass density of neutral gas at and the mass density of visible stars in local galactic disks (Wolfe et al., 1995) lends credibility to the idea that DLAs evolve to form present-day galaxies such as the Milky Way (Kauffmann, 1996). However, this agreement in baryon mass cannot differentiate between passive models in which DLAs are protogalaxies having properties similar to those of local galaxies with constant comoving densities from CDM models in which DLAs are numerous, low-mass objects with comoving densities that decrease with time.
These two interpretations have been substantiated largely from detailed analyses of DLA gas kinematics. Prochaska & Wolfe (1997, 1998) and Wolfe & Prochaska (2000a, b) best described the asymmetries in the absorption line profiles using large thick centrifugally-supported disks drawn from a Schecter luminosity/mass function that obey the Tully-Fisher relation. Conversely, hierarchical CDM scenarios confine DLAs to compact low-mass sub-L* systems. Models of irregular merging clumps are shown to reproduce the observed absorption line kinematics as well (i.e. Haehnelt et al., 1998; Haehnelt et al., 2000). A reliable determination of the mass of typical individual DLAs is needed to break the degeneracy between these interpretations and provide a vital parameter for numerical models of galaxy formation.
DLAs offer a wealth of information from their absorption line characteristics but their baryonic mass cannot be determined without knowing their typical cross-sectional area. The incidence of DLAs along quasar lines-of-sight only determines the product of their comoving densities and cross-sections. It is possible, however, to infer the dark-matter mass of typical DLAs in the context of CDM cosmology. Hierarchical structure formation models predict that the most massive galaxies will preferentially form clustered together in regions of mass overdensity. Under the assumption of a Gaussian distribution of density fluctuations in the density field, nearly all of the density fluctuations that give rise to massive galaxies (with the exception of those on the high-end tail of the distribution) have initial density contrasts below that necessary for collapse against the Hubble flow. However, these density fluctuations receive a boost in density when superimposed onto a larger wavelength fluctuation from an over-dense region. In this situation, the number of the fluctuations exceeding the threshold of collapse that correspond to massive galaxies is increased with the tendency of these fluctuations to be clustered near the peak of the underlying overdense region. Conversely, density fluctuations that give rise to low-mass galaxies have a relatively high initial density contrast and are predicted to form more uniformly throughout space.
An enhancement in the clustering of galaxies is referred to as bias (Kaiser, 1984). Therefore, the measurement of the bias of a population of galaxies provides a means to infer their mass distribution. The bias of a particular sample of galaxies can be derived from their spatial auto-correlation or by their cross-correlation with another population of galaxies with known bias. DLAs are detected in absorption in quasar lines-of-sight and their sparse sampling at makes the measurement of the DLA auto-correlation function difficult. Since spectral analysis from previous surveys for LBGs in emission has yielded the LBG auto-correlation function and established the LBG galaxy bias at (Adelberger et al., 2003), an effective way, and perhaps the only way, to determine the DLA bias is through the DLA-LBG cross-correlation.
In general, the Poisson probability that two volume elements, and , in the field separated by a distance are occupied by a DLA and an LBG is:
| (1) |
where and are the mean number densities of each population. The presence of a DLA in one volume element enhances the probability of the presence of an LBG in another volume element by an amount described by the DLA-LBG cross-correlation function . Therefore, the probability of finding an LBG in a volume element at a distance from a known DLA is expressed as:
| (2) |
At high redshift, where a linear bias to the underlying dark matter correlation function (i.e. Peacock, 1997) is a reasonable model, the DLA-LBG cross-correlation is:
| (3) |
where and are the bias parameters for the two populations. Since the LBG bias at is known, and once the DLA-LBG cross-correlation is measured, the dark matter mass of typical individual DLAs can be inferred directly from the resulting value of the DLA bias using the approach of Mo et al. (1998).
To measure the DLA-LBG cross-correlation function, we use a photometric selection technique similar to previous successful surveys, Steidel et al. (1998), to efficiently detect LBGs in QSO fields with known DLAs. We are able to construct the DLA-LBG spatial cross-correlation function from both angular and spectroscopic measurements. Recently, Bouché & Lowenthal (2003) estimated the two-dimensional DLA-LBG angular cross-correlation function in three wide fields using photometric redshifts. They found a positive DLA-LBG clustering amplitude to a confidence level based on Monte Carlo simulations. Their photometric redshift measurements constrained their results to spatial clustering within redshift slices on the order of their photometric redshift uncertainties . Conversely, Adelberger et al. (2003) measured the mean overdensity of LBGs within cylindrical cells with a height and radius of up to centered on the four DLAs in their spectroscopic sample at . They compared this mean overdensity with the mean overdensity of LBGs within similar cylindrical cells centered on LBGs drawn from their complete sample that had similar redshifts as two of their DLAs. From their analysis, they argued that the three-dimensional DLA-LBG cross-correlation is weak and concluded that DLAs and LBGs do not have similar spatial distributions. Since the statistical accuracy of both investigations was limited, neither confirms, nor rules out a significant value of the DLA bias.
Because DLAs may be a population of protogalaxies having a range of masses, a statistical determination of the DLA-LBG cross-correlation function from multiple DLA fields is required. This paper presents the results of BVRI photometric selection of LBG candidates in a survey of 9 QSO fields containing 11 known DLAs. We address the efficiency of using BVRI filters to detect LBGs and apply 339 spectra to calibrate the BVRI photometric selection process. The BVRI filters are naturally suited to select Lyman break objects at and are distinct from the filter set of Steidel & Hamilton (1992) in that they have the advantage of being readily available at most observatories.
This marks the second step in an observing program designed to measure the DLA bias by searching for galaxies in emission that are clustered with DLAs or directly responsible for the damped absorption. Previous work by Gawiser et al. (2001) and Prochaska et al. (2002) detail the acquisition and analysis of galaxies associated with DLAs at using deep BRI imaging. The regime is more challenging due to a relatively low LBG number density to R, a large number of low- interlopers having similar colors, and the fact that the relevant interstellar absorption features are redshifted to wavelengths that coincide with a dense array of bright night-sky emission lines. By contrast, at there are three times as many LBGs at a given magnitude, fewer low- objects with similar colors, and the expected Lyman and metal absorption line features are redshifted to a region with few night-sky emission lines and high CCD quantum efficiency.
This paper is organized as follows: § 2 describes the deep imaging observations and reduction process, § 3 discusses the photometry and the photometric color selection, § 4 describes the spectroscopic observations and analysis, § 5 addresses the use of spectroscopically identified galaxies to refine the selection criteria, and § 6 provides a brief summary. The DLA-LBG cross-correlation and analysis are presented in Paper II. All magnitudes reported in this paper are given using the (Fukugita et al., 1996) scale unless otherwise stated. We adopted the following transformations from the standard Johnson-Cousins magnitude system to the system: = UJC + 0.70, BAB = BJC – 0.15, VAB = VJC – 0.01, RAB = RJC + 0.18, and IAB = IJC + 0.43.
2 IMAGING OBSERVATIONS
We chose QSO fields that contained at least one DLA in the redshift path consistent with the LBG detection volumes probed by BVRI photometric color selection. We also maintained a preference for systems near where the photometric selection is most efficient and avoided systems with less than 3000 km sec-1 separation from the background QSO. Fields were chosen by their coordinate accessibility and, when more than one field was observable, we chose the field that would be observed through the lowest airmass and in the direction of lowest Galactic reddening. These considerations minimized the attenuation of the light from the LBGs and eased their detection using reasonable integration times, especially in the -band. Prior to this survey, there were 10 known DLAs in the selected 9 QSO sight lines. Our spectroscopy revealed a second DLA in the field PSS0808+5215 at =2.936 and was confirmed using the moderate resolution Keck ESI data of Prochaska et al. (2003). Table 1 lists the 9 QSO fields and 11 DLAs used in this survey. Our BVRI color selection technique does not efficiently detect LBGs near the 4.18 DLA near PSS0957+3308. Although the imaging depths of the PSS0957+3308 field allowed for reasonable color selection of LBG candidates using BVRI color criteria similar to those described in Gawiser et al. (2001), no follow-up spectroscopy has been acquired to date for these candidates.
The imaging data were acquired during the interval 2000 April through 2003 November at the Palomar and Keck Observatories. We used the Carnegie Observatories Spectrograph and Multi-Object Imaging Camera (; Kells et al., 1998) on the Hale telescope at Palomar to obtain deep images for the first two fields in our survey. Both the PSS1432+3940 and JVAS2344+3433 fields were imaged in BR filters using equipped with a Tektronix 20482048 thinned CCD ( pixel-1). Subsequent observations in V and I were obtained using the Low Resolution Imager and Spectrometer (; Oke et al., 1995). The field of view (FOV) is arcmin whereas FOV is arcmin. Two pointings with provided 70% coverage of each field. Table 2 presents a journal of the observations for the 9 fields in the survey.
All other fields in our survey were imaged wholly using with ,B,V,R,(Rs), and I filters. is a dual arm instrument with both red and blue sensitive sides. Prior to January, 2001, all images were taken using the red arm equipped with a back-side illuminated Tektronix 20482048 thinned CCD ( pixel-1). From January, 2001 through June, 2002, and B-band images were obtained using the blue arm of with a SITe 20482048 thinned CCD ( pixel-1). After June, 2002, and B-band data were obtained using equipped with 2 Marconi 20484096 blue-sensitive CCDs ( pixel-1).
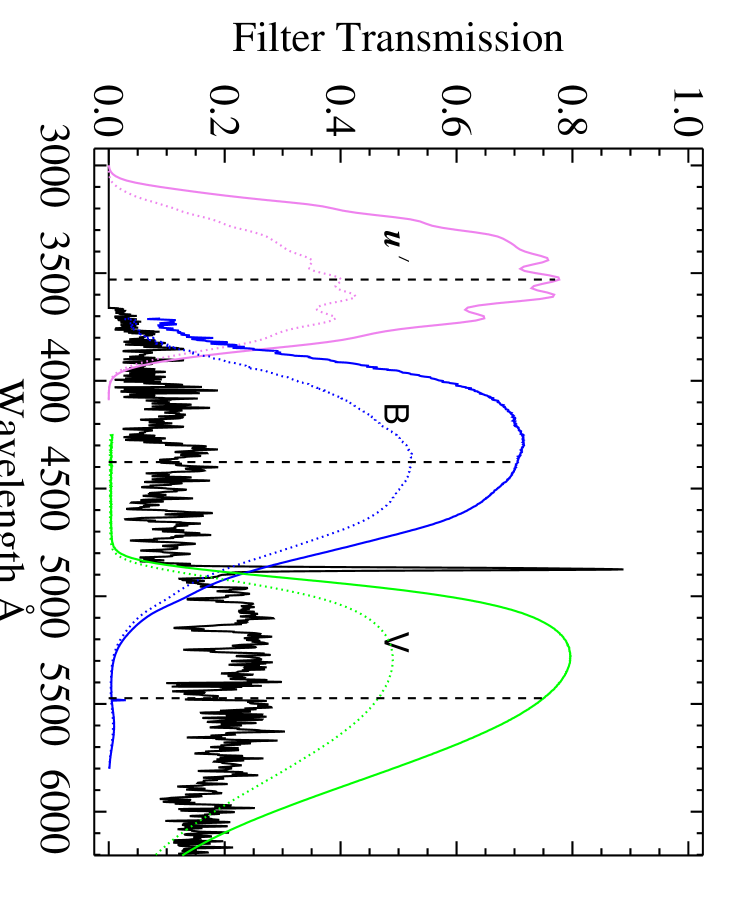
Figure 1 plots the transmissions of the filters used in this survey. The transmissions of the and Rs filters are indicated by the dashed curves. The and filters were both used during the course of this survey as a result of their availability at Keck. Since the and filters have nearly identical bandpasses, effective wavelengths, transmission efficiencies, and application in this paper, the filter will be referred hereafter as the filter for simplicity, unless otherwise noted. The Rs filter was used wholly or partially to image three fields as the survey progressed in an attempt to increase the number of Lyman break candidate detections since it has a higher throughput and sharper transmission cutoffs than the RJC.
All observations were taken as close to the meridian as possible in an effort to minimize the effects of atmospheric extinction and dispersion. We imposed a non-repeating dithering pattern between consecutive images to minimize the effects of bad pixels and to allow for the creation of a sky flat by combining unregistered images (super-sky flat). Dithering by this amount had the effect of reducing the field size common to all images by in both dimensions. The integration times were varied depending on filter, observing conditions, and telescope/instrument configuration in an attempt to achieve our targeted 1 magnitude sky fluctuation depths of = 29.0, BAB, VAB, and RAB = 28.5, and IAB = 27.8 with a seeing element goal of . The average observed 1 magnitude sky fluctuation depths per seeing element were = 29.1, BAB = 28.7, VAB = 28.6, RAB = 28.7, and IAB = 27.6 with an average seeing element of . Since the seeing for most fields was consistent, any , B, V, or I image with a seeing FWHM differing from the corresponding R filter image by more than was not used. This resulted in compatible seeing for each field in the final stacked images. For the three fields LBQS0056+0125, PKS0336–017, and PC1643+4631A, the stacked images consisted of only four filters. This was due to these fields having either a broad seeing FWHM from poor seeing or non-science grade images in a particular filter. These fields were only used in specific photometric selection and LBG candidate density results.
The data were reduced using standard and routines. Images were flat-fielded using super-sky flats whenever possible. In a few cases, the instrument condition or the particular night’s agenda forced the use of a twilight flat or dome flat. Final images were combined with an in-house package that inversely weights each image by the measured variance, scales by the exposure time, and creates error images based on Poisson statistics. Photometric calibrations were calculated for each night by observing multiple photometric standard stars (Landolt, 1992) in each filter over a full range of airmass. Conventional tasks, such as and were employed to solve zero-point magnitudes, airmass correction coefficients, and appropriate color correction coefficients for the photometric data. Typical rms magnitude errors were and respectively. In the few cases where a unique solution was not found, we adopted fixed values for the airmass correction coefficients. These values are: 0.56, 0.35, 0.17, 0.13, 0.07 for BVRI filters respectively at Palomar and 0.41, 0.19, 0.12, 0.11, and 0.07 for BVRI filters respectively at Keck. Finally, the photometric zero-points were corrected for Galactic extinction using values measured from the far-IR dust emission maps of Schlegel et al. (1998). The values for each field are given in Table 2. To correct our fields for Galactic extinction, we adopted the following relations interpreted from Cardelli et al. (1989):
3 PHOTOMETRY
We defined our source detection catalogs in the R-band (Rs in 2 fields) after considering the spectral profile of LBGs and the imaging sensitivity of the and cameras. An additional consideration was that of the PSS1432+3940 and JVAS2344+3433 fields (imaged with the larger FOV of the camera) had only BR filter coverage. The sources in all nine QSO fields were identified with the software package (v.2.1.6) created by Bertin & Arnouts (1996). We varied the ‘ detection threshold’ and ‘minimum pixel area’ input parameters by comparing the output segmentation map of each stacked R image with that of the segmentation map of the negative stacked R image to minimize spurious source detections. Typical values were 1.6 detection threshold and 6 pixel minimum area. An in-house code was used to calculate the magnitudes and errors of each object detection in each filter. This code determines the sky flux by taking the bi-weight (Beers et al., 1990) of the sky in an annulus around each object containing at least 103 pixels not flagged as an object in the segmentation map created by . Magnitude errors were derived from variance in the sky flux and the systematic uncertainty in the photometric calibration.
A goal in imaging the survey fields was to achieve photometric completeness to the spectroscopic limiting magnitude of R. The number of objects detected in our survey versus their R magnitude is shown in Figure 2. The upper histogram displays the number counts of sources for each filter in 0.2 magnitude bins for the five fields with BVRI imaging. A logarithmic fit to the binned number counts to R is used to estimate the completeness of our sample and is shown in the central plot. The lower plot displays the photometric completeness for all 5 filters. These fields are complete to R25 and are complete to R=25.5 using this form of analysis. From the deep galaxy survey of Steidel et al. (2003), the average number of faint galaxies in the apparent magnitude range of was found to be 25.9 with a field-to-field scatter of arcmin-2. We report an average faint galaxy number of arcminute-2 that meet our source identification criteria over the same magnitude range in the R-band.
To facilitate the design and milling of reliable spectroscopic multislit masks, accurate astrometry was performed over the full area of each field using USNO A2.0 and USNO B1.0 (Monet et al., 1998, 2003) astrometric catalogs. We then used the PAL_COORDS routine111Available by anonymous ftp at: ftp.astro.caltech.edu/palomar/pal_coordinates/pal_coordinates.doc to determine the astrometric solution for both and cameras. Typical position errors of were reported by this method and confirmed when fine aligning the slitmasks on sky.
3.1 Photometric Color Selection
We chose to identify the color of all LBG candidates in a consistent manner from their coarse spectral features. We searched for star forming galaxies having a strong continuum long-ward of rest-frame Lyman (1215Å) and a flux decrement short-ward of the rest-frame Lyman limit (912Å). This decrement is due to absorption by H I optically thick at the Lyman limit which is intrinsic to the galaxy and present in foreground systems. At , these spectral characteristics are redshifted to optical wavelengths. The photometric selection of LBG candidates in color-color space has been spectroscopically verified with ground-based telescopes (Steidel et al., 1996a) using broad band filters and with the Hubble Space Telescope [Steidel et al. (1996b) and Lowenthal et al. (1997)] using similar bandpasses. Here we use five widely available filters, , B, V, R, and I, to formulate our LBG candidate selection criteria.
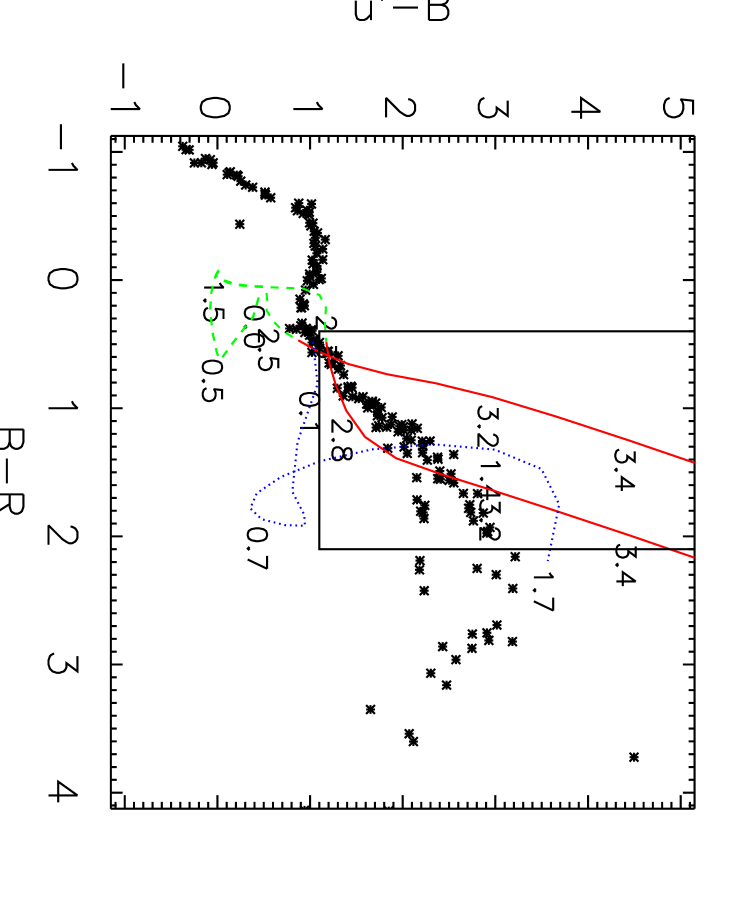
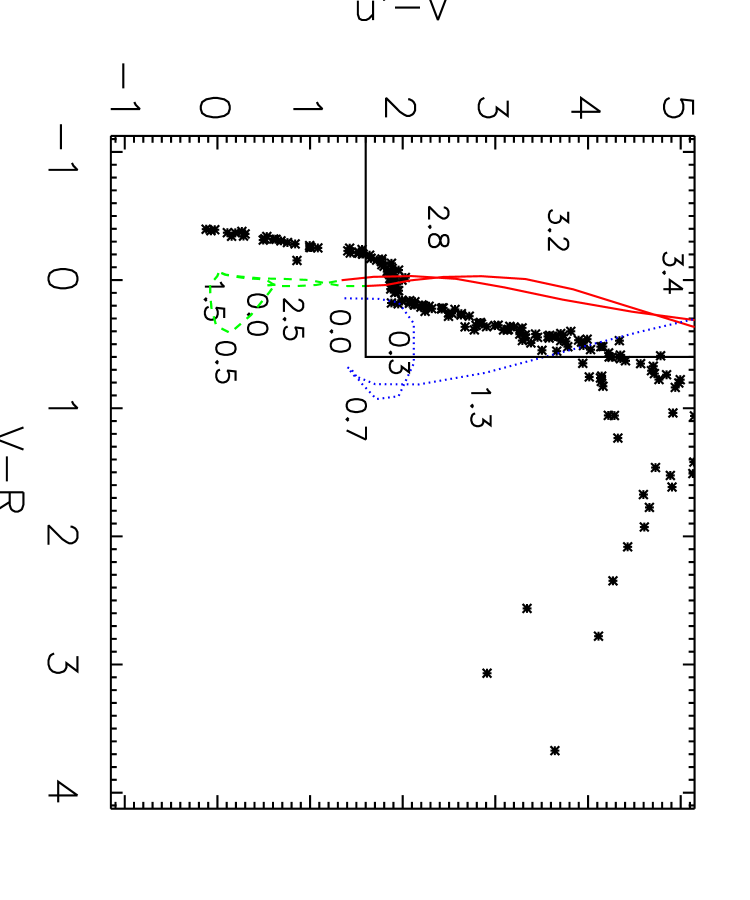
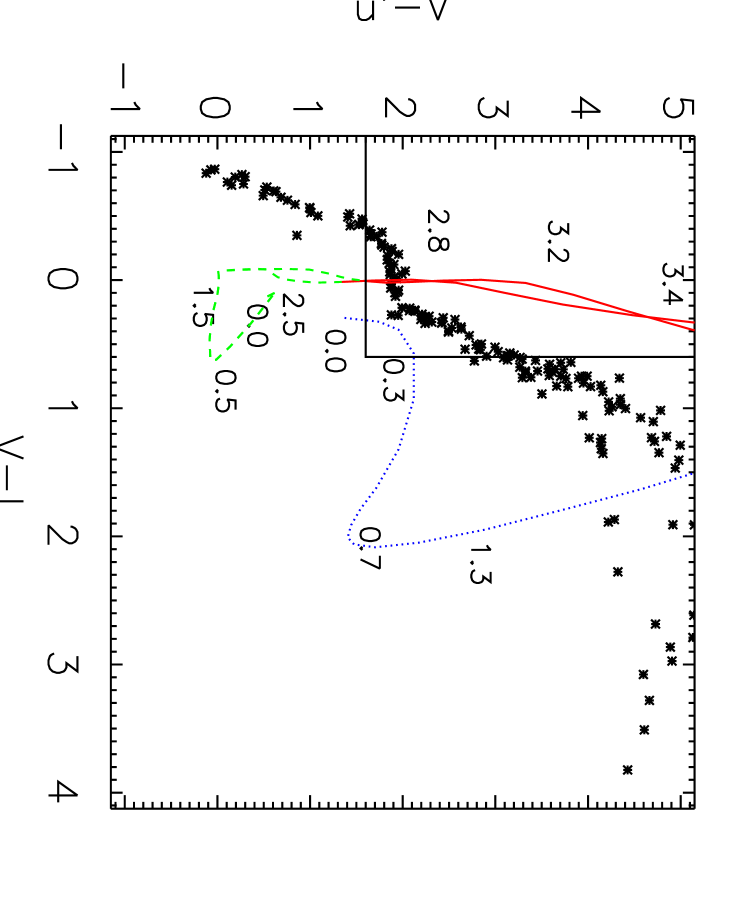
Galaxies meeting our selection criteria exhibit virtually no flux in the -bandpass, a varying flux decrement in the B-bandpass due to the Lyman forest, and relatively constant flux in the VRI bandpasses. Figure 3 displays a graphical representation of this in the , B, and V filter bandpasses. The placements of the Lyman and Lyman limit breaks in the continuum are readily apparent. We derived theoretical galaxy colors using six star-forming galaxy templates (Yahata et al., 2000) and simulated the color-color evolution of these galaxies to high redshift. Figure 4 plots the expected vs. , vs. , and vs. colors of a starbursting galaxy (dashed green curve) and an elliptical galaxy (dotted blue curve) as they are evolved from . Star symbols are used to denote the colors of Galactic stars from the Gunn & Stryker (1983) catalog. From approximately in each plot, the starbursting galaxy is indicated by two solid red lines. The separate red lines indicate the decrements in the continuum of the galaxy caused by a reasonable range of Lyman forest absorption (Madau, 1995). The expected colors of these objects were used to determine the appropriate color criteria that would efficiently detect Lyman break candidates at and reject low redshift objects. The color selection regions are shown as the boxed regions in the upper-central and upper-left portions of the plots.
Objects were selected as LBG candidates that satisfied the following constraints:
| (4) |
| (5) |
| (6) |
| (7) |
| (8) |
| (9) |
LBG candidates for the first two spectroscopic slitmasks of the field JVAS2344+3433 were determined using the vs. color-color plot only (constraints ). This was necessary prior to complementary V and I imaging at Keck and remains the color selection criteria for the regions of fields PSS1432+3940 and JVAS2344+3433 having only BR imaging. LBG candidates in fields where the images in all five filters were usable were required to meet the full color criteria (constraints ). Constraints 4, 5, and 6 were imposed to reflect the relative discontinuities in the continuum at rest-frame 912Å and 1215Å from the continuum at rest-frame 1300Å. Constraints 7 & 8 were used to eliminate a large number of low redshift reddened elliptical galaxies and Galactic stars. The R magnitude (equation 9) of all objects was constrained on the bright end (R to avoid saturated sources in the combined images and constrained on the faint end (R to only include objects bright enough to meet the spectroscopic limit of on Keck. The imposition of color constraints similar to the ones mentioned above selects the majority of the galaxies at from field objects but does not allow for the selection of objects with excessive intrinsic far-UV extinction. Therefore, this survey is not complete to all possible types of galaxies at , but does include a significant number of galaxies to provide meaningful statistics toward the goal of cross-correlating LBGs with DLAs.
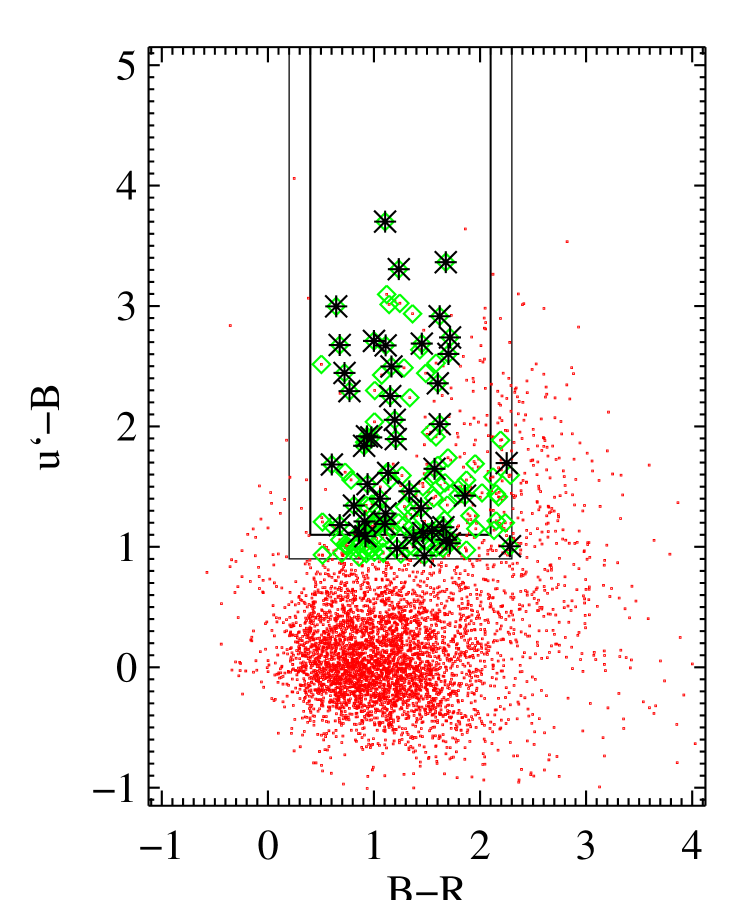
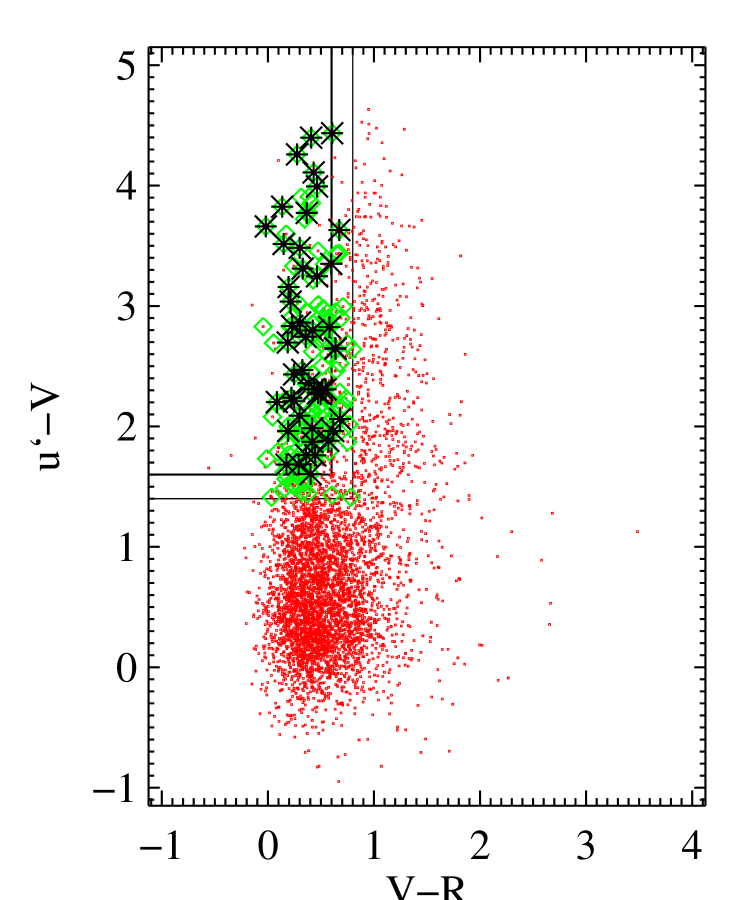
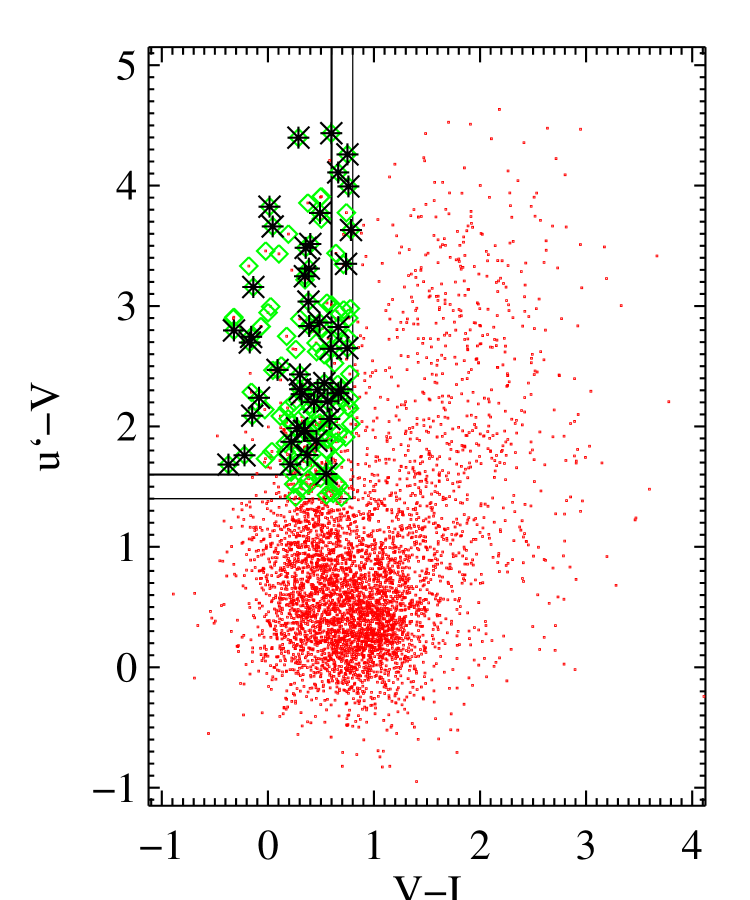
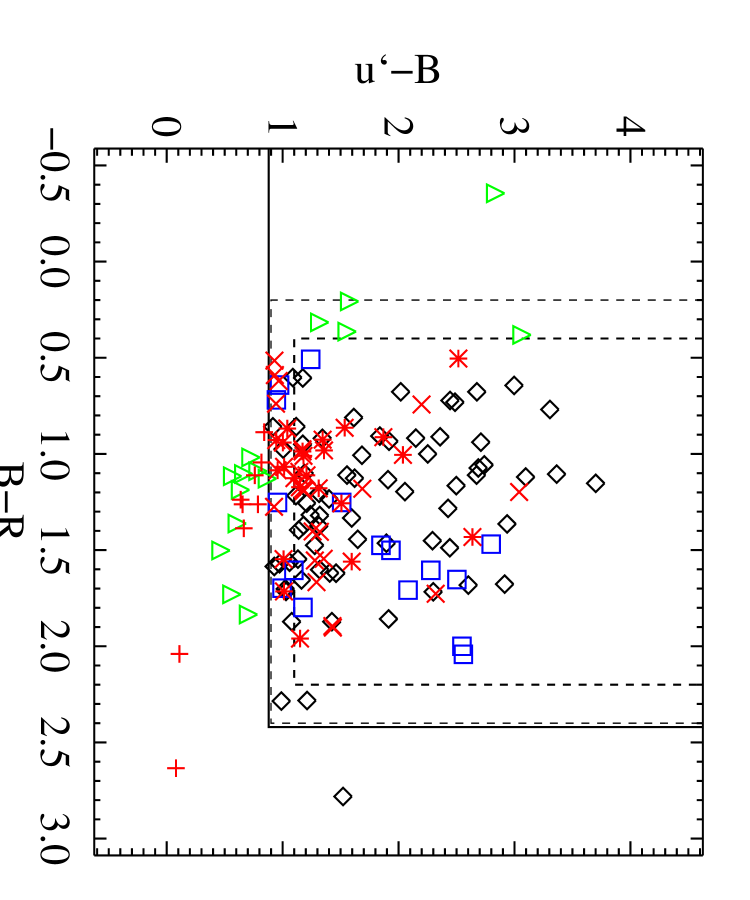
Objects meeting the full BVRI color criteria (constraints ) were given the highest priority as slitmask targets. Objects meeting only VRI and BRI color criteria were given successively lower priorities. To compensate for photometric errors due to both statistical and systematic uncertainties, objects within 0.2 magnitudes outside of these constraints were also identified as LBG candidates and given respectively lower priorities. LBG candidates within a separation of in radius from a QSO sight-line were marked and chosen over other objects that were in conflict in the dispersion direction of the particular slitmask in an effort to identify the galaxy responsible for the damped absorption. A separation of represents the maximum impact parameter of an absorber inferred from absorption line statistics (Storrie-Lombardi & Wolfe, 2000). In some cases, the conflicting LBG candidates were placed on subsequent slitmasks. No other factor contributed to the choice of candidates for spectroscopy except the physical constraints of the slitmask itself, as described in 4. The three color-color plots in Figure 5 display the data from 5 fields (PSS0808+5215, PSS0957+3308, BRI1013+0035, PSS1057+4555, and PSS1439+3940) having full BVRI color selection. In this figure, all objects in the five fields are shown as red points. Green diamonds are overlayed to indicate those objects that met the imposed BVRI color selection criteria (including objects within 0.2 magnitudes) and the black asterisks denote the objects that have secure spectroscopic redshift identifications.
Overall, a total of 796 objects were photometrically selected using these color criteria. In the four fields where all five filters could not be utilized, candidates were chosen that met the color criteria of the usable filters. Firstly, the initial slitmasks for the JVAS2344+3433 field included LBG candidates chosen by BR color selection prior to V and I filter imaging. Secondly, the LBG candidates in both the LBQS0056+0125 and PC1643+4631A fields were chosen using VRI color selection. An instrument failure resulted in non-science grade B filter images for the LBQS0056+0125 field and time constraints forced the full bandpass of the B filter to be compromised by a dichroic centered at 4600Å for the PC1643+4631A field. Lastly, the LBG candidates in the PKS0336–017 field were chosen using BRI color selection due to complications from merging a broad and shallow FWHM of 1.″7 in the V filter. All LBG candidates in this field were required to meet an additional color criterion of:
| (10) |
Table 3 displays the area common to all filters for each targeted field and summarizes the number of LBG candidates detected using BR(I), VRI, and BVRI color selection criteria and the resulting VRI and BVRI LBG number densities. In the five fields with BVRI photometry, the two-dimensional LBG color candidate density is 0.79 arcmin arcmin-2. Comparison of the average LBG candidate density with that of similar surveys can be used as a photometric selection check. From Steidel et al. (2003), the LBG candidate density using I filters is 1.6 arcmin-2 from 2347 selected objects in 17 fields. Our average LBG candidate density using the relatively comparable VRI filters is consistent at 1.45 arcmin-2 from 365 objects in 6 applicable smaller fields. Although the VRI criteria select a larger number of objects than the BVRI criteria, we find the VRI method to be less efficient in resulting spectroscopic confirmations (see 5).
4 SPECTROSCOPIC DATA
To optimize spectroscopic slitmask design, objects on the LBG candidate lists were visually inspected in the two-dimensional images to eliminate false detections (e.g. satellite trails, diffraction spikes, asteroid tracks, and CCD defects). LBGs have a half-light radius of from Hubble Space Telescope images (Steidel et al., 1996b; Lowenthal et al., 1997; Gardner et al., 2001) and should appear nearly point-like with the resolution of and . Therefore, several objects were rejected if they were overly extended [although some objects appear to be extended (i.e. Erb et al., 2004)]. Each slitmask was then designed to include the highest priority objects and to have empty regions filled with objects of successively lower priorities. We chose to use 6 minimum slitlet lengths to maximize the number of objects observed without compromising sky subtraction. Slitmasks were designed using the software AUTOSLIT 3.07 222Autoslit and support files are available at http://astro.caltech.edu/pls/autoslit/ and ftp://astro.caltech.edu/users/pls/autoslit/. Typically, each slitmask was able to include objects which resulted in an average slitlet length of for each candidate.
Multislit spectroscopic observations of the LBG candidates were obtained between 2000 November through 2004 February, using both the red arm and new blue arm of on the Keck I telescope. We used the 300 line mm-1 grating (red side) and the 300 line mm-1 grism (blue side), both blazed at 5000Å in first order. The red side grating has a dispersion of 2.47Å pixel-1 over the CCD and was tilted to allow a minimum wavelength range of Å for each slitlet regardless of their placement on the mask. The blue side grism has a dispersion of 1.43Å pixel-1 ( pixel size) over two Marconi high quantum efficiency (QE) blue sensitive CCDs. The grism is fixed and designed to allow a possible instrumental wavelength range of Å for multislit spectroscopy. This results in an observational minimum wavelength coverage from the atmosphere cut-off at to 7500Å for each slitlet. We designed the widths of the slitlets on most slitmasks to be to account for errors in the astrometry, atmospheric dispersion over long integrations, and moderate seeing. Since these are sky-dominated objects, when possible, we designed alternate slitmasks with narrower slitlet widths to accommodate good seeing and observations at low airmass through the meridian. The spectral resolution evaluated from night sky emission lines was 12Å FWHM and, because Lyman break objects are near point sources, typical object resolution was seeing limited and resulted in an effective spectral resolution of 9Å FWHM.
The total exposure time for each slitmask was 7200 seconds when using the red arm and seconds when using the blue arm of . The higher throughput, lower read-out noise, and higher CCD quantum efficiency of the blue arm permitted considerably shorter exposure times to achieve equivalent magnitude depths as compared to the red arm. Each slitmask was observed in a series of consecutive second exposures with small dithers ) along the direction of the slits to sample different parts of the CCD, minimize fringing effects, avoid hot pixels, and provide better sky subtraction options. The details of the spectroscopic observations are summarized in Table 4. The slitmasks were designed to be observed at position angles equaling the parallactic angle determined mid-way through their scheduled time of observation. In some instances (to help compensate for uncertain weather and instrument conditions), two masks were designed with position angles reflecting two different times of possible observation. This practice minimized wavelength dependent flux loss through the slit due to atmospheric dispersion as the slitmasks were only observed within 30 minutes of their scheduled time. Calibration exposures were taken either before, mid-way, or after the science exposures to minimize the effects of instrument flexure. Flat field exposures were obtained using an internal halogen lamp. Internal arc lamp exposures used for wavelength solutions were taken with a combination of Cd, Zn, Hg, Ne, Ar, Kr, and Xe, depending whether the science exposures were taken with the red or blue arm of LRIS. For proper flux calibration, two or more spectroscopic standard stars (Massey et al., 1988) were observed each night at different airmass to replicate the range of airmass sampled by the slitmasks during the course of the night.
We used IRAF and in-house IDL scripts to perform the initial reduction of the CCD data including overscan correction, gain normalization, trimming, bias subtraction of all images. We used the routine bogus.cl 333bogus.cl is available at: http://zwolfkinder.jpl.nasa.gov/stern/homepage/bogus.html to handle the division of each full two-dimensional multislit image into separate two-dimensional slitlet images of each object and for the application of calibration frames. The bogus.cl routine calls tasks for flat fielding the individual slitlet images by their corresponding continuum-normalized portion of the flat field image. Background sky subtractions were determined by using low-order polynomial fits appropriate to the length of each slitlet to background sky sections. The routine also performs fringe subtraction, identifies cosmic rays morphologically, and shifts and stacks the spectra. Additionally, bogus.cl creates two-dimensional slitlet images during selected steps for later inspection and analysis. We chose to operate interactively on all spectra to achieve our goals considering the faint magnitude of typical objects in our survey.
We traced the reduced two-dimensional stacked spectra using spectroscopic analysis routines and fitted low-order (usually first-order) polynomials to subtract any remaining background sky offset. Corresponding arc lamp traces of each object were extracted in the identical manner as the object. Wavelength solutions were obtained on the extracted arc lamp spectra using low order polynomials with residuals 1Å. Further refinement to the wavelength solution was performed by comparing the arc lamp wavelength solution to multiple night sky emission lines corresponding to each object and applying the calculated sub-pixel offset. Each spectrum was then corrected for extinction, flux calibrated using sensitivity functions obtained from the corresponding spectrophotometric standard stars, and corrected to vacuum wavelengths.
4.1 Spectroscopic Identification and Analysis
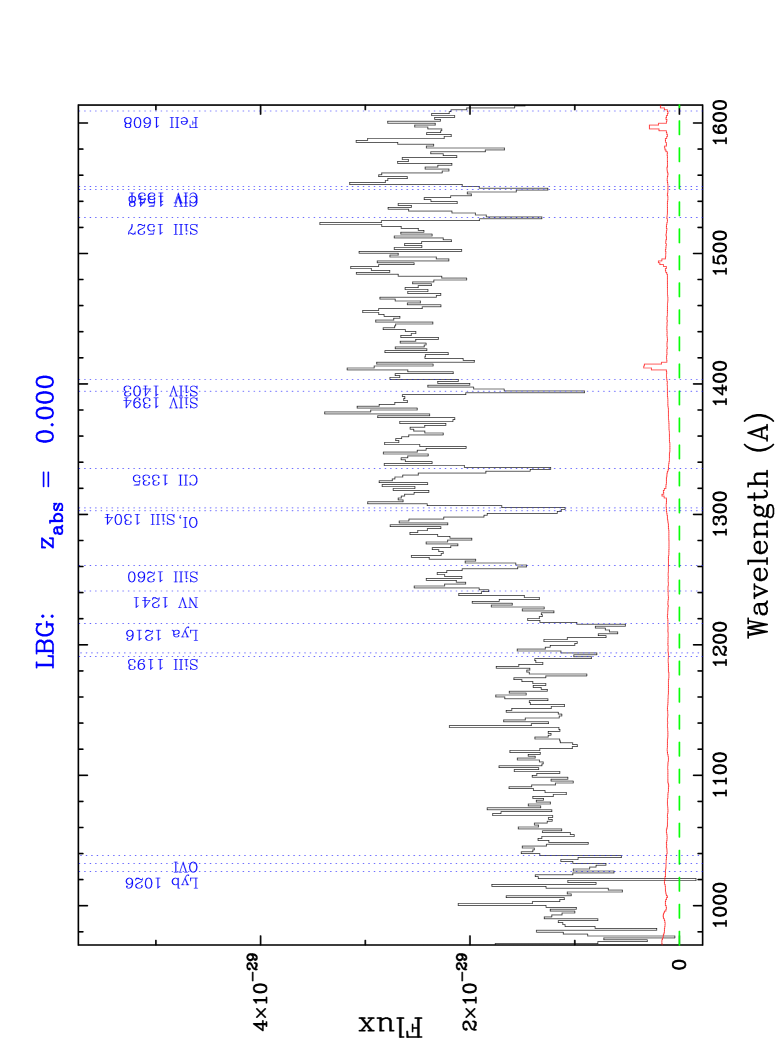
LBGs display identifiable rest-frame UV spectral features from 912Å to 1700Å. For galaxies at , these features are shifted to optical wavelengths from Å. The objects in this survey were identified mainly using Lyman and interstellar emission and absorption features described by Pettini et al. (2000), Adelberger et al. (2003), and Shapley et al. (2003). These features have typical equivalent widths of Å and can be relatively easy to identify even though the spectra have a signal-to-noise ratio of only a few.
We chose to separate the LBGs detected by this survey into two simple populations: (a) emission-identified LBGs – galaxies showing Lyman in emission and (b) absorption-identified LBGs – galaxies showing Lyman in absorption. Confirmation for all LBGs involved the individual search through each continuum for a possible decrement due to the Lyman forest short-ward of the Lyman feature at rest-frame 1215Å, a second decrement (where spectral coverage allowed) due to Lyman limit absorption short-ward of rest-frame 912Å , and the identification of expected interstellar absorption and/or emission features. The differing coarse spectral characteristics of LBGs as described by Shapley et al. (2003) prompted slightly different identification expectations for each population. Spectra exhibiting Lyman in emission and appropriate continuum breaks were additionally inspected for the presence of interstellar absorption lines (usually weak) and a flat continua long-ward of Lyman to aide in their identification. Spectra with Lyman in absorption were inspected for the appropriate continuum break characteristics and multiple strong absorption lines with a somewhat reddened continua long-ward of Lyman . At no time were the spectra required to have all of these features, although nearly all identified galaxies fulfilled these expectations.
In practice, and depending on the wavelength coverage of an individual spectrum, usually 6 or more absorption lines were used to secure the redshift of a particular LBG. Due to the overall low signal-to-noise nature of these spectra, it becomes necessary to assign secure and probable LBG redshifts. Both the secure and the probable LBGs exhibit the characteristic continuum profile. Relevant expected stellar and interstellar metal lines used for identification included: Si II 1193, 1260, 1304, 1527, Si IV 1394, 1403, C II 1335, C IV 1548, 1551, O I 1302, Fe II 1608, He II 1640, Al II 1671, Al III 1855, 1863 , and CIII] 1909 among others. Low redshift galaxies were identified by comparison to templates of E+SO, E+A, and starbursting galaxies. Since the break in the continua of low redshift galaxies near 4000Å can mimic the Lyman break of LBGs, low signal to noise absorption spectra must be carefully checked to avoid misidentification. Emission lines, such as [O II] 3728, [O III] 4959, 5007, [N II] 6584 and [S II] 6724 and typical absorption and/or emission features such as the Hydrogen series, Ca II H & K lines, Mg II 2796, 2804, Mg I 2852, 5175, He I 4471, 5876, 6678, 7065 and Na I 5890, 5896 were used to confirm low redshift galaxies and Galactic stars.
In total, we acquired spectra of 529 objects from the 796 LBG candidates that met either BR(I), VRI, or BVRI photometric selection criteria. Using an in-house analysis routine, we interactively examined each one-dimensional and two-dimensional spectrum individually for identifiable features following the prescription described above. All objects were then placed in one of the following seven categories: (0) stars, (1) secure galaxies, (2) probable objects, (3) probable objects, (4) secure galaxies, (5) high redshift QSOs, and (6) unidentified objects. Objects placed in categories 2 and 3 were identified as low or high redshift objects respectively, but did not satisfy the identification requirements as rigidly as categories 1 and 4. The probable identifications usually resulted from lower signal-to-noise and lack of apparent emission lines yet still showed reasonable continuum breaks and the tentative identification of several to many absorption lines. Some objects were placed in the probable LBG category due to a slight ambiguity in redshift. Objects were classified as unidentified (category 6) if they displayed very low signal-to-noise (possibly from a portion of these objects falling outside the slitlet) or a strong ambiguity in redshift assignment. These are listed for each field in Table 5 with the separate categories indicated by the parentheses.
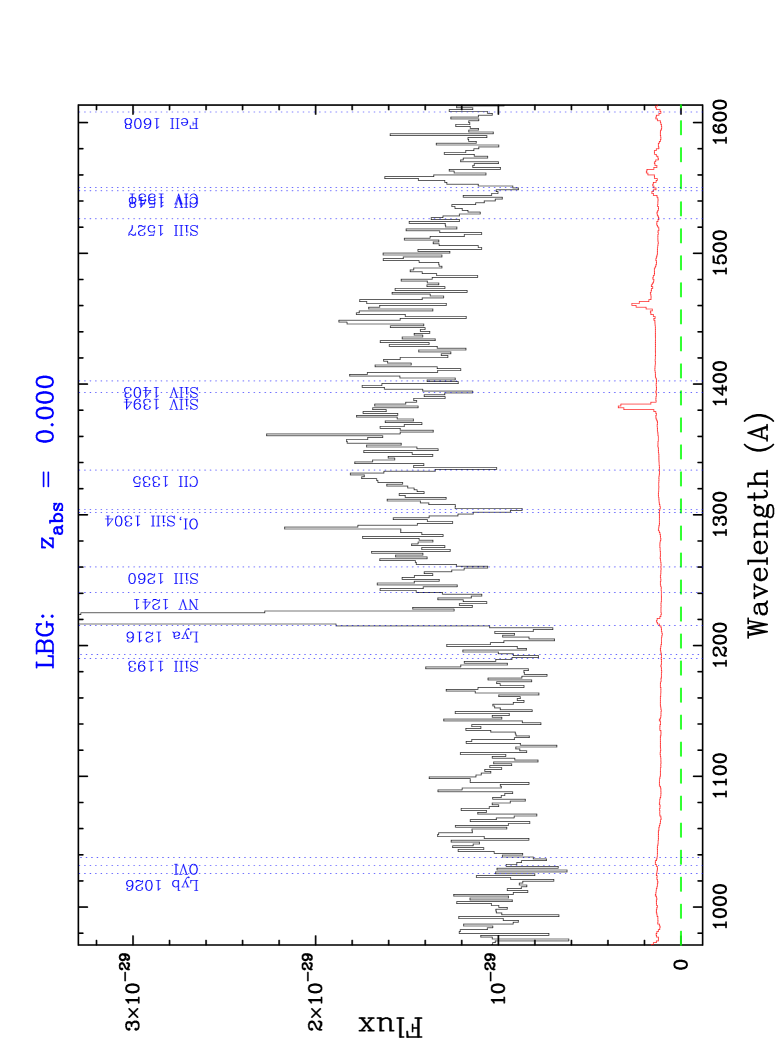
Two composite LBG spectra are shown in Figure 6. Each spectrum was constructed by stacking the rest-frame spectra of individual LBGs that exhibit similar properties. The upper spectrum is a composite of LBG spectra with prominent Lyman emission. This spectrum displays visibly weak (narrow) interstellar metal absorption lines and a relatively flat continuum long-ward of 1215Å. The Lyman feature is redshifted with respect to the interstellar lines by an average of km sec-1, in agreement with Adelberger et al. (2003). This is interpreted to be due velocity differences within the galaxy arising from stellar and supernovae-driven winds. The higher redshift of the Lyman feature results from dust absorption of the resonantly scattered photons in the blueshifted portion of the expanding galactic shell. Emission-identified LBGs comprise of our sample. This is a greater fraction of LBGs of an equivalent type than found by Steidel et al. (2003) and may be due to a more conservative redshift identification process. The lower spectrum combines LBG spectra having Lyman in absorption, revealing a somewhat reddened continuum and noticeably stronger (broader) interstellar absorption lines. The assessment of the overall continuum profiles of LBGs from our data is in agreement with the results of the analysis of intrinsic LBG properties by Shapley et al. (2001, 2003). The fluxing of the spectra long-ward of 1500Å in Figure 7 is not reliable due to the fact that no order blocking filter was used for these observations. Since standard stars used for fluxing tend to be very blue, their second order light can significantly affect the spectrum at observed wavelengths long-ward of 6400Å. This corresponds to rest-frame wavelengths long-ward of 1600Å for objects at . Moreover, the composite spectra comprise LBGs of varying redshifts. As a result, the effects from the flux degradation is spread over rest-frame wavelengths greater than 1500Å.
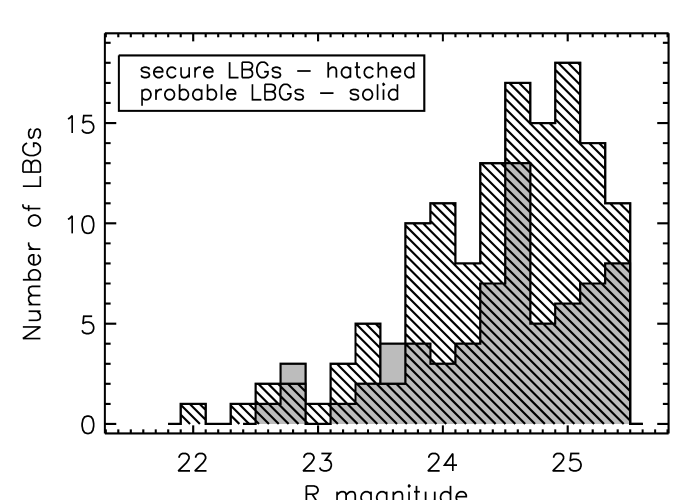
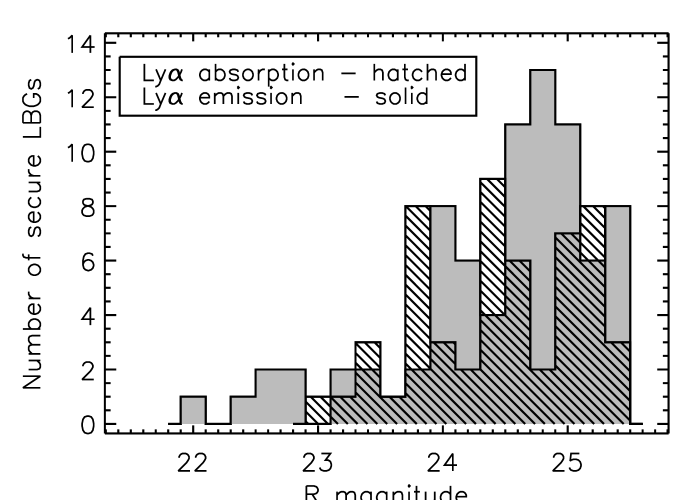
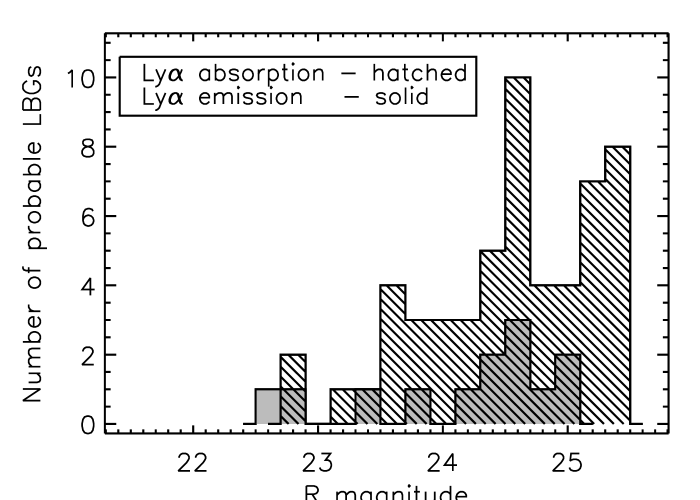
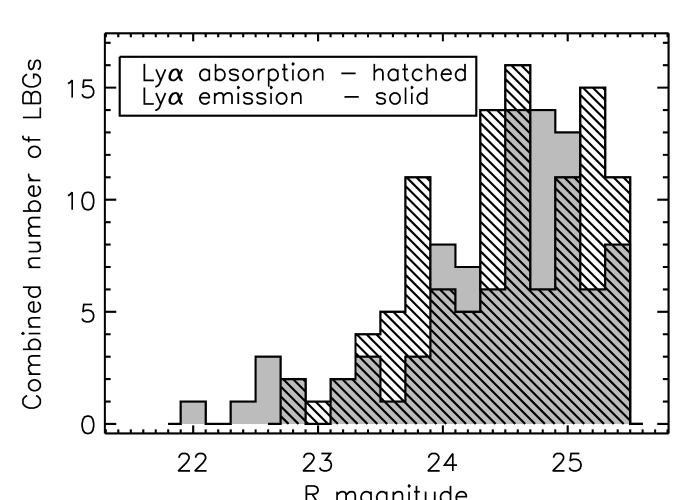
To test our identification process for any bias toward magnitude, we performed a two-sided Kolmogorov-Smirnov (K-S) test of the secure and probable LBG R magnitude distributions. This resulted in an 88% K-S confidence level for the null hypothesis, making it very unlikely that they are drawn from separate distributions. Figure 7 shows a histogram of the secure and probable LBGs versus R magnitude binned in R=0.2. Additionally, we tested for any bias in magnitude toward LBGs displaying Lyman in emission versus LBGs displaying Lyman in absorption since the presence of a strong emission feature could enhance the confidence of identification. This is especially the case for low signal-to-noise spectra. Figure 8 presents R magnitude histograms of emission-identified LBGs with absorption-identified LBGs. The K-S tests on the secure, probable, and combined LBG distributions resulted in a 29%, 46%, and 51% confidence for the null hypothesis, respectively. In all three cases, the values are consistent with the hypothesis that the secure emission-identified and absorption-identified LBGs are drawn from the same parent distributions.
The ability to securely identify an emission-identified LBG relative to absorption-identified LBG for the faintest objects tends to diminish with magnitude but will actually increase beyond R. This is reflected in Figure 8 where it can be seen that there are no emission-identified LBGs and 15 absorption-identified LBGs with R . Although this is partially due to the presence of the Lyman feature adding confidence to these lowest signal-to-noise spectra, it is also an effect of the photometric selection criteria which is designed to select galaxies based on the decrements in their continua. Due to the finite magnitude depths of the and B-band images combined with strict and constraints, only the bluest objects selected with R and greater can meet the selection criteria. The bluest LBGs are typically emission-identified LBGs. Because of this, the 15 R absorption-identified probable LBGs are the least confident of the sample.
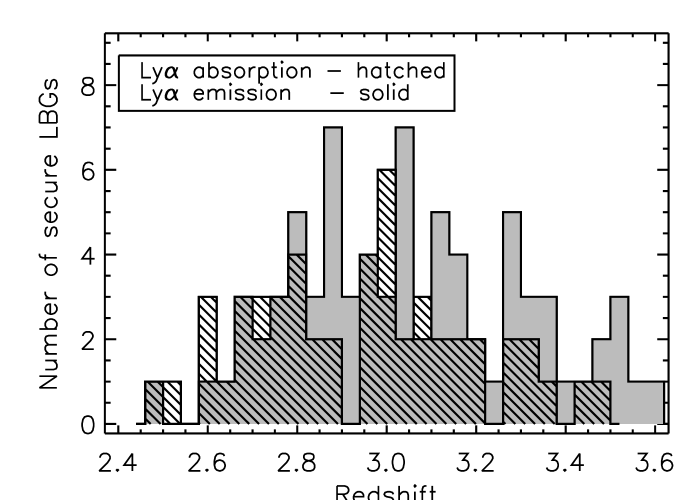
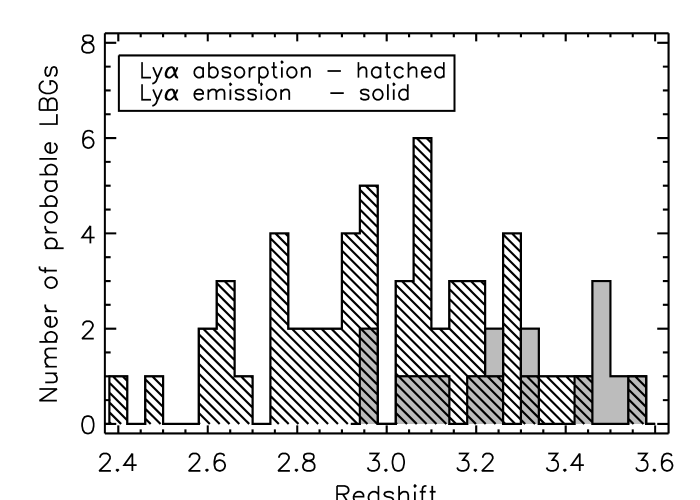
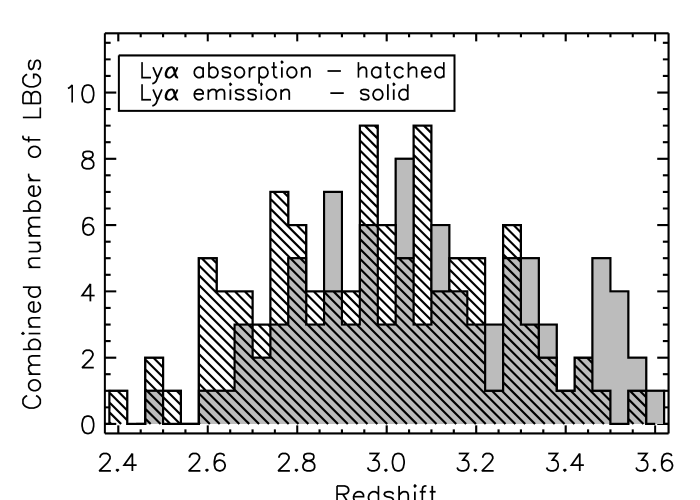
The redshift distribution of the identified LBGs is another regime to test our identification process and lends insight into the overall distribution of LBGs detected by this selection method. Figure 9 presents histograms that display secure, probable, and a combination of the two LBG categories in the upper, central, and lower histograms respectively. The broad agreement in the absorption-identified LBG redshift distributions lends confidence to the overall redshift assignments. The separate sets of emission-identified and absorption-identified LBGs show a small offset in the centers of their distributions. The secure emission-identified LBG distribution centers at while the secure absorption-identified LBG distribution centers at . Nevertheless, a K-S test on the two secure distributions resulted in a 21% confidence of the null hypothesis and is consistent with the two distributions being drawn from a similar parent distribution.
Performing the K-S test on the probable LBG redshift distributions resulted in a 99% confidence that the emission-identified and absorption-identified LBGs are likely to be drawn from different distributions. This assessment is considered in future analysis and can be seen by the apparent lack of probable emission-identified LBGs with . Although emission features add to the general confidence of spectral identifications, emission-identified Lyman break objects at the higher end of the redshift range probed by our method become less confident since the majority of their expected stellar and interstellar features begin to compete with a dense array of night sky emission lines. This is also the case for the most common low redshift interlopers. The LRIS instrument is less capable of subtracting these lines effectively for very low signal-to-noise spectra.
From the full spectroscopic sample, we arrive at a secure (category 4) LBG number density of 0.37 arcmin-2 with a field-to-field scatter of arcmin-2 and arcmin-2 for the combined set of secure and probable LBGs (categories 3 and 4). Approximately two-thirds of the photometrically selected R LBG candidates have spectroscopic coverage and approximately of the obtained spectra are identified. Assuming similar results for the remaining R LBG color candidates gives a projected LBG number density of arcmin-2 for the secure LBGs and arcmin-2 for the secure and probable LBGs.
4.2 The Photometric Selection Function
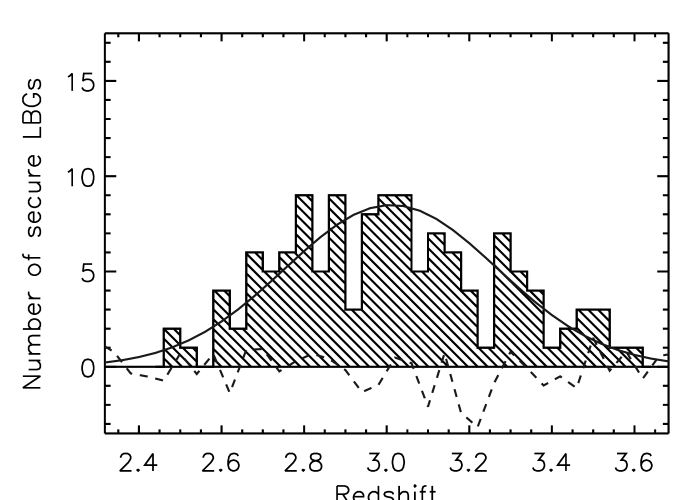
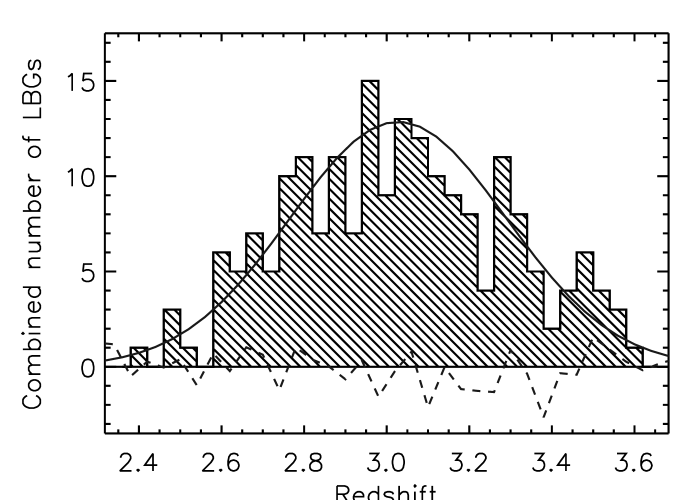
The selection criteria described in § 3 were designed to be sensitive to objects over a redshift path from . The previous large LBG survey at by Steidel et al. (2003) probes a similar redshift path with a distribution of for their catalog of 940 identified spectra. They used their spectra to establish several fundamental properties of LBGs at . Our color selection technique was intentionally designed to select LBGs over the same redshift path to utilize the LBG properties defined by Steidel and coworkers. The redshift distributions of the LBGs detected by this survey are presented in the upper two histograms of Figure 10. The top histogram displays the 137 secure LBG redshifts from binned in . The central histogram represents the distribution of the combined set of LBGs, which includes 74 additional probable LBG redshifts. The secure LBG distribution has a mean of with a standard deviation of . The combined set of 211 objects is nearly identical with . These distributions include the five faint QSOs discovered in this survey.
Observed redshift distributions combine the actual LBG redshift distribution with the effects of the photometric selection method. To measure the clustering properties of LBGs associated with DLAs, the observed LBG densities per redshift interval must be corrected for the photometric selection effects caused by the efficiencies and transmissions of the instruments and filters as well as the photometric uncertainties. These corrections can be used to recover the true LBG background redshift distribution from the observed LBG redshift distributions once the true photometric selection function is determined. Both observed LBG redshift distributions from the data (Figure 10) were fit by Gaussian functions (solid curves) using the mean, standard deviation, and the same total number of objects of each distribution. The normalized residuals to the fits with respect to the expected Poisson fluctuations per bin are () for the secure (combined) set of LBGs and are over-plotted on Figure 10 as dashed curves. The fits indicate that in both cases the product of the photometric selection function and the true LBG redshift distribution are well described by Gaussian functions.
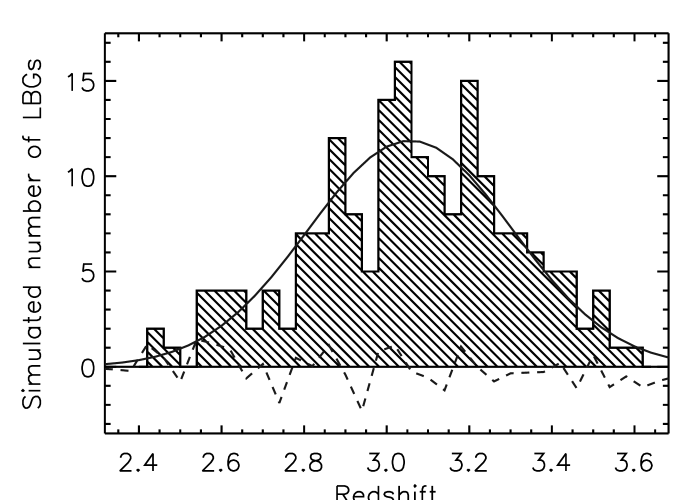
To model the true photometric selection function, we generated a catalog of 1000 starbursting galaxies with random magnitudes drawn uniformly from and random redshifts from . These galaxies were then assigned respective BVI magnitudes according to their assigned redshifts using the theoretical galaxy templates of Yahata et al. (2000). The quantum efficiency of the CCDs, atmospheric attenuation, and transmission characteristics were factored into the response of each filter. We fit a function to the photometric errors of the data with respect to magnitude and assigned Gaussian random errors multiplied by this function to each galaxy accordingly. Under the assumption that the LBG spatial density varies slowly with redshift, we assumed a uniform background LBG redshift distribution and corrected the expected observed LBG background to include the fact that a standard candle diminishes by magnitudes from . In doing this, we incorporated the fact that our survey is magnitude limited by only considering objects with a corrected magnitude of R.
The results of this simulation are shown in the lower histogram in Figure 10. This simulation shows that the product of a uniform LBG redshift distribution and the simulated true photometric selection function is well described by a Gaussian (solid line) and results in a distribution with nearly identical mean and standard deviation as the data. In an identical manner as the data, the normalized residuals of the Gaussian fit to the simulation are over-plotted as the dashed curve and have a mean of .
Since the simulated redshift distribution which incorporated the effects of our photometric selection method and assumed a uniform background LBG redshift distribution is shown to be described well by a Gaussian function, and since the observed redshift distributions can similarly be described by Gaussian functions, it is reasonable to assume a uniform background number density from . Knowledge of the LBG background number density per redshift interval is required for proper determination of the DLA-LBG clustering amplitude. Although the true background LBG number density from may not be strictly uniform, any slow varying non-uniformity in the large-scale distribution of LBGs will not affect the DLA-LBG clustering amplitude significantly. Indeed, the spatial distribution of LBGs is clustered on small scales, but bin-by-bin averaging over the 9 fields and 11 DLAs in this survey will in effect “wash out” an individual field’s clustering signal.
5 COLOR SELECTION EFFICIENCIES AND CRITERIA REFINEMENT
The BVRI photometric color selection technique presented here is an efficient means to detect LBGs over the intended redshift path of . Although the original intent of this survey was to perform BVRI photometric color selection in all 9 fields, various instrument and imaging concerns, described above, required the use of a subset of the full color criteria in four fields: LBQS0056+0125, PKS0336-017, PC1643+4631A, and JVAS2344+3433. Restricting these fields to a subset of the BVRI filters did not significantly hinder our ability to detect LBGs. For the five fields with BVRI imaging, the number density of LBG candidates meeting BVRI color criteria allowed room on each slitmask to include objects meeting lesser color constraints. This allowed an additional opportunity to examine the efficiencies of these alternate criteria.
Table 6 summarizes the efficiencies of the BVRI color selection criteria and subset criteria from the spectroscopic data. Adhering to the imposed BVRI color selection criteria outlined in 3.1 and the spectroscopic identification process in 4.1, we find 79% of the identified objects selected for spectroscopy as secure and probable Lyman break objects, 0% were Galactic stars, and 21% were secure or probable galaxies. The efficiency is clearly influenced by the conservative nature of our redshift assignments and subjective object placement in the probable categories. Re-categorizing the probable spectroscopic placements would lead to as much as 95% and as few as 59% of the identified objects with .
Nearly 60% of the unidentified spectra can be attributed to cirrus during the 2003 February observing run for the PKS0336-017 field and an instrument failure for the 2002 December observations of the PSS1057+4555 and JVAS2344+3433 fields in which the CCD shutter could not be closed. In the latter case, we corrected for the additional light striking the CCD during read-out by subtracting a one-second image taken immediately after each observation image. This was surprisingly effective in removing global flux levels, but was by no means perfect, especially in the complete removal of bright galaxy and star trails.
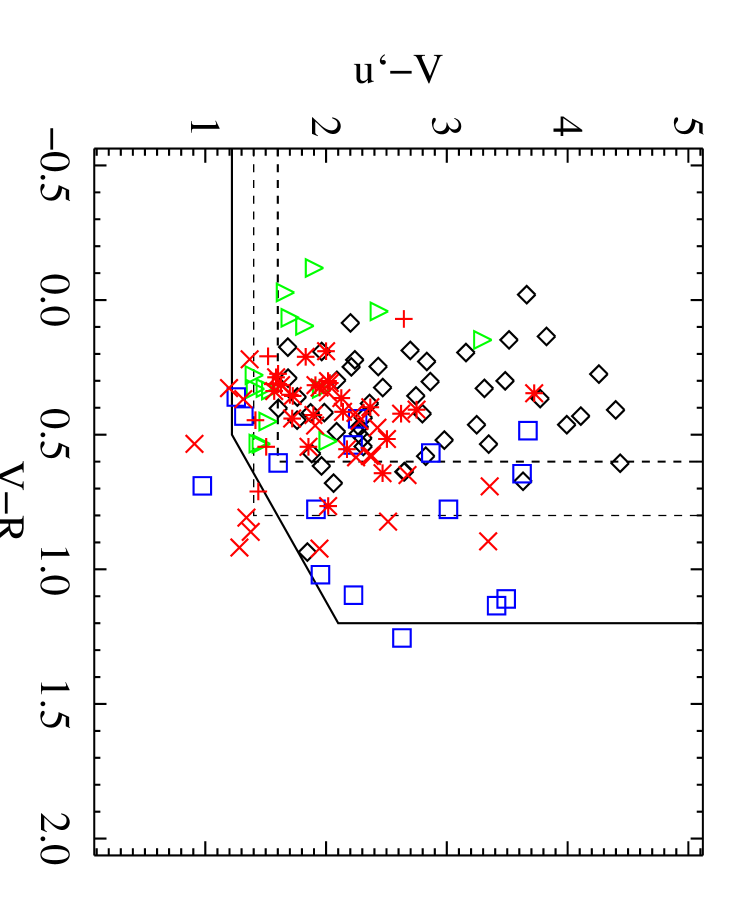
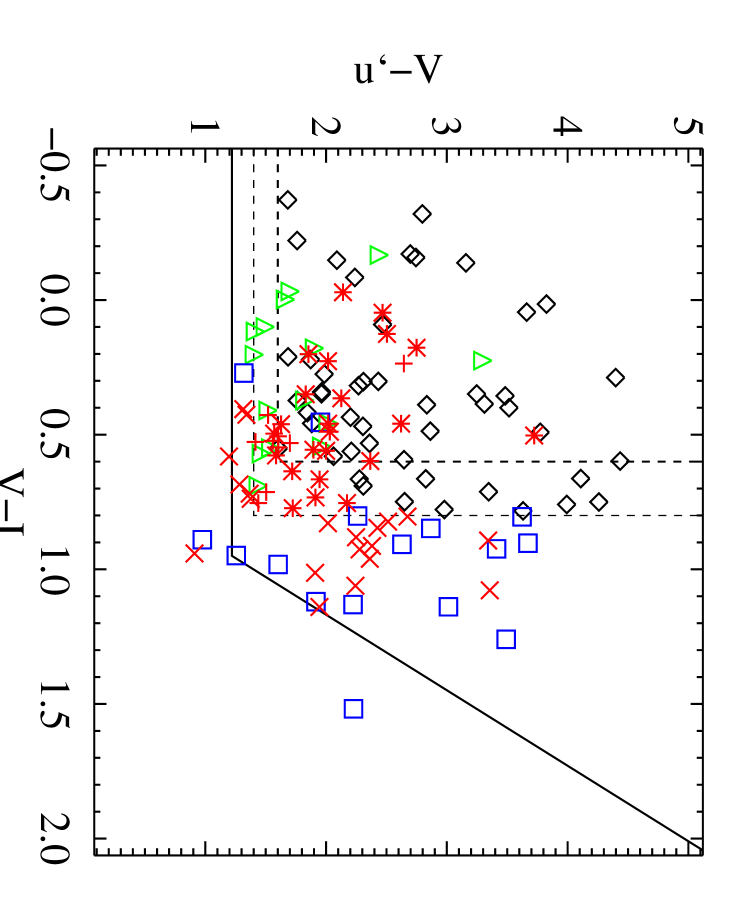
A review of the placement of spectroscopically confirmed LBGs on the color-color plots allows an opportunity to assess and possibly refine the color selection criteria. Figure 11 displays the spectroscopic results from the five fields (PSS0808+5215, PSS0957+3308, BRI1013+0035, PSS1057+4555, and PSS1432+3940) that have BVRI color selection. Zoomed-in views of the selection regions are shown and indicated by the boxed regions (dashed lines). LBGs (both secure and probable) selected by their BVRI color criteria are shown as black diamonds, those selected by only their BR(I) color criteria are shown as blue squares, and those selected by only their VRI colors are shown as green triangles. All objects with identifications are shown in red. The galaxies and Galactic stars meeting BVRI color criteria are shown collectively as asterisks and those meeting BR(I) or VRI color criteria are shown as plus ‘+’ signs or ‘X’s respectively.
The practice of obtaining spectra of the lower priority candidates revealed and helped quantify the fraction of the galactic population at that is missed when using the full set of BVRI filters. Additionally, objects detected and confirmed using only BR(I) color criteria are missed when using only VRI color selection and vice-versa. This can be seen in Figure 11. The blue squares to the right of the selection region in the vs. plot were detected and confirmed using BR(I) color selection. Similarly, the green triangles below and to the left of the selection region in the vs. were detected and confirmed using VRI color selection. The original BVRI color criteria (dashed lines) provide a very efficient method to discern the largest possible number of Lyman break objects from fields objects with a minimum number of undesired low-redshift objects. To acquire a more complete sample of all populations of galaxies at , the data suggest refinements to the selection regions if either all or a subset of the BVRI filters are used.
From the vs. plot in Figure 11, it appears that the original color cut is effective and any relaxation of the criterion beyond 0.2 magnitudes would include a large number of less desired field objects (review Figure 5 for the field object distributions). Additionally, the extension of the color cut to low values would help to include or confirm objects detected via VRI color selection. Due to the lack of field objects in this region, this extension does not risk a loss to efficiency. A refinement to this plot (solid lines) would be to set the criterion to and modify the original color criterion from to .
A modification of the color criteria in the vs. color-color plot (solid lines) is intended to include objects that would be detected via BR(I) color selection. This refinement would modify the current criteria from to . Unfortunately, the distribution of low redshift interlopers extends into the modified selection region. This refinement would include a broader sample of galaxies at the risk of diminishing the LBG detection efficiency.
Several objects chosen by only their BR(I) colors (blue squares), show up to the right of the original selection region in the and color-color plot. To include these objects and to search for others with reasonable SEDs without the high cost of many interfering field objects, a suggested refinement to the vs. color criteria is shown (solid lines). The suggested refinement involves modifying the original color cuts from to and .
Finally, in our analysis of the 529 color selected objects, we also analyzed as many field objects as possible that randomly fell into our slitlets. These objects provide a small sample of the full population of galaxies at high redshift free from color selection bias. From the 132 serendipitous field objects, and using the categories described above, we found 0 Galactic stars, 16 secure galaxies, 27 probable objects, 8 probable galaxies, 4 secure galaxies, 0 QSOs, and 77 unidentified objects. Three of the secure galaxies are and would not have been detected by our selection criteria. The fourth galaxy is an emission-identified LBG at that falls below the spectroscopic magnitude cut-off for our survey of R=25.5. Of the probable galaxies, 3 have and the remaining 5 were found to have and R. Although the 55 serendipitous objects identified sample a very small area of the sky relative to the entire survey, none of these objects were found within the redshift path probed by our selection method and brighter than our magnitude limit of R=25.5. These statistics are consistent with the idea that our selection method detects the majority of objects at .
6 SUMMARY
This paper presents the first spectroscopic survey designed to detect galaxies associated with known DLAs at . A primary goal of this survey is to measure the spatial clustering of LBGs and DLAs to determine the DLA-LBG cross-correlation and infer the typical mass of DLAs in the context of CDM cosmology. Since DLAs may have a range of mass, a survey for LBGs in multiple QSO fields with known DLAs is required to achieve proper statistics. We present and analyze the imaging and spectroscopic data for objects in 9 QSO fields having 11 known DLAs, including one DLA discovered by this survey, for the purpose of measuring the DLA-LBG cross-correlation.
We selected a total of 796 objects as LBG candidates using the color criteria described in §3 from 17,343 sources detected over the 465 arcmin2 in our survey. We find an LBG color candidate number density of 0.79 arcmin-2 in the five fields with BVRI imaging and 1.45 for six fields with VRI imaging.
We obtained spectroscopic observations of 529 LBG candidates and identified 339 redshifts in which 211 are secure and probable LBGs with a distribution of . Of the 211 LBGs, display Lyman in emission and the remaining display Lyman in absorption. We find no bias in the confidence of our LBG identifications with magnitude and no bias in magnitude based on individual LBG spectral features. Additionally, we find no statistically significant difference in the redshift distributions between LBGs identified by spectral features yet we find an effect in confidence of our probable identifications with redshift. We obtained spectroscopic data for of the photometrically selected LBG color candidates in nine fields and identified of the obtained spectra. We find an LBG number density of arcmin-2 for secure LBGs and arcmin-2 for the combined set of secure and probable LBGs.
We modeled the photometric selection function based on the redshifted galaxy colors from the theoretical galaxy templates used in this survey and included photometric uncertainties modeled from the data. We combined the effects on the color selection caused by the characteristics of the CCDs and BVRI filters and assumed a uniform LBG background redshift distribution. The modeled data is in excellent agreement to that of the observed data and is well described by a Gaussian function using the parameters of the modeled data distribution. Moreover, a Gaussian function fits the observed redshift distributions of the data as well using the parameters from each of the observed distributions. We used these results to validate the assumption of a uniform or slowly varying LBG background number density from . The spatial information of the 211 spectroscopically identified LBGs from this survey will be used to measure the DLA-LBG cross-correlation with the 11 known DLAs in Paper II.
Following the success of the Lyman break photometric selection method demonstrated by Steidel et al. (1996a), several surveys for LBG candidates have extended the Lyman break selection method to conventional UBVRI filters (e.g.Ouchi et al., 2001; Bouché & Lowenthal, 2003; Ferreras et al., 1998; Radovich et al., 2004). These surveys rely on photometric redshifts to determine galaxy spatial distributions and have a typical accuracy of . The survey presented here provides deep, low resolution spectroscopy using the 10 meter Keck telescopes to measure the spatial distribution of LBGs at to . The 339 identified spectra obtained from this survey are used to calibrate the overall efficacy of an LBG photometric selection method using conventional BVRI filters. From our spectroscopic sample and conservative identifications, we find that the criteria for the BVRI filters yield a high LBG detection efficiency (79% identified redshifts). The inclusion of objects within 0.2 magnitudes of the imposed BVRI color criteria, made to compensate for photometric uncertainties, allowed for a near doubling of the number of objects with little loss in efficiency (75% identified redshifts). Although the use of all five filters with the color criteria presented in this paper may be too restrictive in detecting the full population of LBGs at , we find the use of a subset of these filters (VRI, BRI,BR) allow the inclusion of more objects as LBG candidates but are less efficient (69%, 63%, and 62% identified redshifts respectively).
We used the spectroscopic information to offer a possible refinement to our original BVRI color criteria to increase the efficiency and provide insight into the entire population of LBGs at . Although a spectroscopic analysis of the serendipitous objects suggests that the original color criteria imposed by our selection method detects most of the objects at , they may not include all objects such as galaxies that are highly reddened. Several LBGs selected exclusively from a subset of the BVRI filters were detected outside the regions chosen for the original color cuts. To obtain a more complete census of objects at , modifications to the existing color cuts are suggested.
References
- Adelberger et al. (1998) Adelberger, K. L., Steidel, C. C., Giavalisco, M., Dickinson, M., Pettini, M., & Kellogg, M. 1998, ApJ, 505, 18
- Adelberger et al. (2003) Adelberger, K. L., Steidel, C. C., Shapley, A. E., & Pettini, M. 2003, ApJ, 584, 45
- Beers et al. (1990) Beers, T. C., Flynn, K., & Gebhardt, K. 1990, AJ, 100, 32
- Bertin & Arnouts (1996) Bertin, E. & Arnouts, S. 1996, A&AS, 117, 393
- Bouché & Lowenthal (2003) Bouché N. & Lowenthal, J. D. 2003, ApJ, 596, 810
- Cardelli et al. (1989) Cardelli, J. A., Clayton, G. C., & Mathis, J. S. 1989, ApJ, 345, 245
- i.e. Erb et al. (2004) Erb, D. K., Steidel, C. C., Shapley, A. E., Pettini, M., & Adelberger, K. L. astro-ph/0404235
- Ferreras et al. (1998) Ferreras, I., Benitez, N., Martinez-Gonzalez, E. 1998 A&A, 333, 43
- Fukugita et al. (1996) Fukugita, M., Ichikawa, T., Gunn, J. E., Doi, M., Shimasaku, K., & Schneider, D. P. 1996, AJ, 111, 1748
- Gawiser et al. (2001) Gawiser, E., Wolfe, A. M., Prochaska, J. X., Lanzetta, K. M., Yahata, N., & Quirrenbach, A. 2001, ApJ, 562, 628
- Gardner et al. (2001) Gardner, J. P., Brown, T. M., & Ferguson, H. C. 2000, ApJ, 542L, 79
- Gunn & Stryker (1983) Gunn, J. E. & Stryker, L. L. 1983, ApJS, 52, 121
- i.e. Haehnelt et al. (1998) Haehnelt, M. G., Steinmetz, M., & Rauch, M. 1998, ApJ, 495, 647
- Haehnelt et al. (2000) Haehnelt, M. G., Steinmetz, M., & Rauch, M. 2000, ApJ, 534, 594
- Kaiser (1984) Kaiser, N. 1984, ApJ, 284, 9
- Kauffmann (1996) Kauffman, G. 1996, MNRAS, 281, 475
- ; Kells et al. (1998) Kells, W., Dressler, A., Sivaramakrishnan, A., Carr, D., Koch, E., Epps, H., Hilyard, D., & Pardeilhan, G. 1998, PASP, 110, 1487
- Landolt (1992) Landolt, A. U. 1992, AJ, 104, 340
- Lowenthal et al. (1997) Lowenthal, J. D. et al. 1997, ApJ, 481, 673
- Lu et al. (1998) Lu, Limin; Sargent, W. L. W., Barlow, T. A. 1998, AJ, 115, 55
- Madau (1995) Madau, P. 1995, ApJ, 441, 18
- Massey et al. (1988) Massey, P., Strobel, K., Barnes, J. V., & Anderson, E. 1988, ApJ, 328, 315
- Mo et al. (1998) Mo, H. J., Mao, S., & White, S. D. M. 1998, MNRAS, 295, 319
- Monet et al. (1998) Monet, D. et al. 1996 VizieR Online Data Catalog
- Monet et al. (2003) Monet, D. G. et al. 2003, AJ, 125, 984
- ; Oke et al. (1995) Oke, J. B. et al. 1995, PASP, 107, 375
- e.g.Ouchi et al. (2001) Ouchi, M. et al. 2001, ApJ, 558L, 83
- i.e. Peacock (1997) Peacock, J. A. 1997, MNRAS, 284, 885
- Péroux et al (2001) Péroux, C., Storrie-Lombardi, L. J., McMahon, R. G., Irwin, M., Hook, I. M. 2001, AJ, 121, 1799
- Pettini et al. (2000) Pettini, M., Steidel, C. C., Adelberger, K. L., Dickinson, M., & Giavalisco, M. 2000, ApJ, 528, 96
- Prochaska & Wolfe (1997) Prochaska, J. X. & Wolfe, A. M. 1997, ApJ, 487, 73
- Prochaska & Wolfe (1998) Prochaska, J. X. & Wolfe, A. M. 1998, ApJ, 507, 113
- Prochaska et al. (2001) Prochaska, J. X., Wolfe, A. M., Tytler, D., Burles, S., Cooke, J., Gawiser, E., Kirkman, D., O’Meara, J. M., & Storrie-Lombardi, L. 2001, ApJS, 137, 21
- Prochaska et al. (2002) Prochaska, J. X., Gawiser, E., Wolfe, A. M., Quirrenbach, A., Lanzetta, K.M., Chen, H.-W., Cooke, J., & Yahata, N. 2002, AJ, 123, 2206
- Prochaska et al. (2003) Prochaska, J. X., Gawiser, E., Wolfe, A. M., Cooke, J., Gelino, D. 2003, ApJS, 147, 227
- Radovich et al. (2004) Radovich, M. et al. 2004, A&A, 417, 51
- Schlegel et al. (1998) Schlegel, D. J., Finkbeiner, D. P., & Davis, M. 1998, ApJ, 500, 525
- Schneider et al. (1991) Schneider, D. P., Schmidt, M., Gunn, J. E. 1991, AJ, 101, 2004
- Shapley et al. (2001) Shapley, A. E., Steidel, C. C., Adelberger, K. L., Dickinson, M., Giavalisco, M., & Pettini, M. 2001, ApJ, 562, 95
- Shapley et al. (2003) Shapley, A. E., Steidel, C. C., Adelberger, K. L., & Pettini, M. 2003, ApJ, 588, 65
- Steidel & Hamilton (1992) Steidel, C. C. & Hamilton, D. 1992, AJ, 104, 941
- Steidel et al. (1996a) Steidel, C. C., Giavalisco, M., Pettini, M., Dickinson, M., & Adelberger, K. L. 1996, ApJ, 462L, 17
- Steidel et al. (1996b) Steidel, C. C., Giavalisco, M., Dickinson, M., & Adelberger, K. L. 1996, AJ, 112, 352
- Steidel et al. (1998) Steidel, C. C., Adelberger, K. L., Giavalisco, M., Dickinson, M., Pettini, M., & Kellogg, M. 1998, ApJ, 492, 428
- Steidel et al. (2003) Steidel, C. C., Adelberger, K. L., Shapley, A. E., Pettini, M., Dickinson, M., & Giavalisco, M. 2003, ApJ, 592, 728
- Storrie-Lombardi & Wolfe (2000) Storrie-Lombardi, L. & Wolfe, A. M. 2000, ApJ, 543, 552
- Wolfe et al. (1986) Wolfe, A. M., Turnshek, D. A., Smith, H. E., & Cohen, R. D. 1986, ApJS, 61, 249
- Wolfe et al. (1995) Wolfe, A. M., Lanzetta, K. M., Foltz, C. B., & Chaffee, F. H. 1995, ApJ, 454, 698
- Wolfe & Prochaska (2000a) Wolfe, A. M. & Prochaska, J. X. 2000, ApJ, 545, 591
- Wolfe & Prochaska (2000b) Wolfe, A. M. & Prochaska, J. X. 2000, ApJ, 545, 603
- Yahata et al. (2000) Yahata, N., Lanzetta, K. M., Chen, H-W., Fern ndez-Soto, A., Pascarelle, S. M., Yahil, A., & Puetter, R. C. 2000, ApJ, 538, 493
| Field | R.A.(J2000.0) | Dec.(J2000.0) | log N(HI) | ||
|---|---|---|---|---|---|
| LBQS0056+0125 | 00 59 17.62 | +01 42 05.30 | 3.16 | 2.775 | 11Wolfe et al. (1995) |
| PKS0336–017 | 03 39 00.65 | -01 33 19.20 | 3.20 | 3.062 | 22Prochaska et al. (2001) |
| PSS0808+5215 | 08 08 49.43 | +52 15 14.90 | 4.45 | 2.936, 3.113 | 33From this work, 44Prochaska et al. (2003) |
| PSS0957+3308 | 09 57 44.50 | +33 08 23.00 | 4.25 | 3.280, 4.180 | 44Prochaska et al. (2003) , 44Prochaska et al. (2003) |
| BRI1013+0035 | 10 15 48.96 | +00 20 19.52 | 4.41 | 3.103 | 55Storrie-Lombardi & Wolfe (2000) |
| PSS1057+4555 | 10 57 56.39 | +45 55 51.97 | 4.12 | 3.050, 3.317 | 55Storrie-Lombardi & Wolfe (2000) ,66Péroux et al (2001) , 77Lu et al. (1998) |
| PSS1432+3940 | 14 32 24.90 | +39 40 24.00 | 4.28 | 3.272 | 44Prochaska et al. (2003) |
| PC1643+4631A | 16 45 01 09 | +46 26 16.44 | 3.79 | 3.137 | 20.788Schneider et al. (1991) |
| JVAS2344+3433 | 23 44 51.25 | +34 33 48.64 | 3.01 | 2.908 | 44Prochaska et al. (2003) |
| Field | Instrument and Dateaa: The Low Resolution Imaging Spectrometer; : with the new blue sensitive CCD chips; : The Carnegie Observatories Spectrograph and Multi-Object Imaging Camera. | Filter | Exp.(s) | FWHM | Depth bb1 sky fluctuations per seeing element. | |
|---|---|---|---|---|---|---|
| LBQS0056+0125 | Dec 2001 | 9000 | 1.5 | 28.9 | 0.03 | |
| Dec 2001/Feb 2003 | B | 1530/1300 | 2.0/1.2 | 28.1 | ||
| Dec 2001/Dec 2002 | V | 3060/600 | 1.4/1.5 | 28.2 | ||
| Dec 2001/Feb 2003 | RsccThe Rs filter was used instead of, or in addition to, the RJC in this field. /R | 2800/600 | 1.4/1.7 | 28.3 | ||
| Dec 2001 | I | 2800 | 1.5 | 27.8 | ||
| PKS0336–017 | Dec 2002/Nov 2000 | 7200/2400 | 1.3/0.8 | 29.1 | 0.14 | |
| Sep 1998 | B | 1500 | 0.6 | 28.9 | ||
| Dec 2002 | V | 2400 | 1.7 | 28.0 | ||
| Sep 1998 | R | 1200 | 0.6 | 28.9 | ||
| Sep 1998 | I | 1080 | 0.5 | 27.6 | ||
| PSS0808+5215 | Dec 2002 | 4500 | 1.2 | 29.3 | 0.04 | |
| Nov 2000/Dec 2002 | B | 1200/1680 | 0.9/0.8 | 29.2 | ||
| Dec 2002 | V | 1740 | 1.2 | 28.8 | ||
| Nov 2000/Dec 2002 | R | 1200/2600 | 1.1/1.2 | 28.8 | ||
| Dec 2002 | I | 1000 | 1.1 | 27.3 | ||
| PSS0957+3308 | Dec 2002 | 4500 | 1.0 | 29.6 | 0.01 | |
| Jan 2001 | B | 3645 | 1.0 | 28.9 | ||
| Dec 2002 | V | 1800 | 1.0 | 29.1 | ||
| Jan 2001 | R | 1860 | 1.0 | 28.6 | ||
| Jan 2001/Dec 2002 | I | 1400/1000 | 1.1/1.0 | 27.8 | ||
| BRI1013+0035 | Dec 2002 | 4600 | 0.9 | 29.7 | 0.03 | |
| Nov 2000 | B | 1200 | 1.1 | 28.5 | ||
| Dec 2002 | V | 1400 | 0.9 | 29.0 | ||
| Dec 2002 | R | 1500 | 0.9 | 28.9 | ||
| Dec 2002 | I | 1000 | 0.9 | 27.7 | ||
| PSS1057+4555 | Apr 2001 | 9000 | 0.7 | 29.2 | 0.01 | |
| Jan 2001 | B | 3600 | 0.8 | 28.9 | ||
| Apr 2001 | V | 1800 | 0.7 | 28.6 | ||
| Jan 2001/Apr 2001 | R/RsccThe Rs filter was used instead of, or in addition to, the RJC in this field. | 2320/1680 | 0.8/0.7 | 29.0 | ||
| Jan 2001/Apr 2001 | I | 1160/1320 | 0.8/0.7 | 28.1 | ||
| PSS1432+3940 | Apr 2000 | 19800 | 1.0 | 28.7 | 0.01 | |
| Apr 2000 | B | 10800 | 1.1 | 28.8 | ||
| Jan 2001 | V | 3200 | 0.9 | 28.3 | ||
| Apr 2000 | R | 9000 | 0.9 | 28.5 | ||
| Jan 2001 | I | 1200 | 0.8 | 27.6 | ||
| PC1643+4631A | Apr 2001 | 7300 | 0.9 | 28.8 | 0.02 | |
| Apr 2001 | BddJohnson B filter convolved with the transmission of the 460nm dichroic installed on | 3720 | 0.9 | 28.5 | ||
| Apr 2001 | V | 1800 | 0.8 | 28.4 | ||
| Apr 2001 | RsccThe Rs filter was used instead of, or in addition to, the RJC in this field. | 1740 | 0.7 | 28.5 | ||
| Apr 2001 | I | 1200 | 0.7 | 28.1 | ||
| JVAS2344+3433 | Sep 2000 | 32400 | 1.4 | 29.2 | 0.08 | |
| Sep 2000 | B | 8400 | 1.2 | 28.8 | ||
| Jan 2001 | V | 2400 | 1.2 | 28.9 | ||
| Sep 2000 | R | 7980 | 1.0 | 28.7 | ||
| Jan 2001 | I | 1200 | 1.3 | 26.7 |
| Field | AreaaaCommon area to all filters. | BR(I) | VRI | BVRI | VRI LBG | BVRI LBG |
|---|---|---|---|---|---|---|
| (arcmin | Candidates | Candidates | Candidates | DensitybbNumber of LBG candidates per arcmin2 using VRI filters for comparison to previous surveys. | DensityccNumber of LBG candidates per arcmin2 using BVRI filters. | |
| LBQS0056+0125 | 41.96 | … | 77 | … | 1.84ddLBG candidates were chosen using VRI filters. | …ddLBG candidates were chosen using VRI filters. |
| PKS0336–017 | 40.95 | 87 | … | … | … | …eeLBG candidates were chosen using BRI filters. |
| PSS0808+5215 | 45.01 | 61 | 54 | 42 | 1.20 | 0.93 |
| PSS0957+3308 | 39.75 | 47 | 34 | 29 | 0.86 | 0.73 |
| BRI1013+0035 | 37.21 | 45 | 19 | 16 | 0.51 | 0.43 |
| PSS1057+4555 | 41.49 | 68 | 81 | 46 | 1.95 | 1.11 |
| PSS1432+3940 | 87.16/57.40ffArea common to the 3 COSMIC filters (,B,R) and area common to all 5 filters [ (,B,R) and (V,I)], respectively. | 165 | 79 | 42 | 1.38 | 0.73 |
| PC1643+4631A | 38.08 | … | 91 | … | 2.39ddLBG candidates were chosen using VRI filters. | …ddLBG candidates were chosen using VRI filters. |
| JVAS2344+3433 | 93.14/59.62ffArea common to the 3 COSMIC filters (,B,R) and area common to all 5 filters [ (,B,R) and (V,I)], respectively. | 155 | 51 | 40 | 0.86ggLBG candidates were chosen using BR filters. | 0.67ggLBG candidates were chosen using BR filters. |
| Field | Date | SlitmaskaaName of slitmask for reference. | AreabbApproximate area covered by the slitmasks in arcminute2. Slitmasks overlapped in most fields. | Exp.(s) | NObjccNumber of slitlets milled to obtain object spectra. Some objects were observed on more than one mask to obtain a higher signal-to-noise ratio. | FWHMddSeeing FWHM taken from alignment stars in arcseconds. |
|---|---|---|---|---|---|---|
| LBQS0056+0125 | Nov 2003 | q0056l15 | 41.3 | 4500 | 37 | 0.8 |
| Nov 2003 | q0056r15 | 41.3 | 2400 | 37 | 0.9 | |
| PKS0336–017 | Feb 2003 | 295n0336 | 41.3 | 4500 | 41 | 1.1 |
| Feb 2004 | 405q0336 | 41.3 | 3600 | 28 | 0.8 | |
| Feb 2004 | 420q0336 | 41.3 | 3600 | 27 | 0.9 | |
| PSS0808+5215 | Feb 2003 | q0808n15 | 41.3 | 5234 | 27 | 0.9 |
| Nov 2003 | 122q0808 | 41.3 | 4200 | 30 | 0.9 | |
| Feb 2004 | q0808c15 | 41.3 | 4500 | 25 | 0.8 | |
| PSS0957+3308 | Feb 2003 | 180p0957 | 41.3 | 4500 | 21 | 0.9 |
| Nov 2003 | 100q0957 | 41.3 | 3600 | 25 | 1.0 | |
| Feb 2004 | 100r0957 | 41.3 | 4500 | 19 | 0.9 | |
| BRI1013+0035 | Feb 2003 | q1013n13 | 41.3 | 4500 | 26 | 0.9 |
| Nov 2003 | q1013r15 | 41.3 | 3600 | 22 | 1.0 | |
| Feb 2004 | q1013r15 | 41.3 | 4500 | 22 | 1.0 | |
| PSS1057+4555 | Dec 2002 | r1057n10 | 41.3 | 3600 | 36 | 1.0 |
| Dec 2002 | l1057t10 | 41.3 | 6000 | 33 | 1.1 | |
| PSS1432+3940 | Feb 2003 | q1432p15 | 41.3 | 4500 | 31 | 1.2 |
| PC1643+4631A | May 2003 | q1643r15 | 41.3 | 4800 | 30 | 0.7 |
| Feb 2004 | 245q1643 | 41.3 | 3400 | 40 | 0.8 | |
| JVAS2344+3433 | Nov 2000 | q2342l10 | 31.5 | 7200 | 18 | 0.8 |
| Nov 2000 | q2342c10 | 31.5 | 7200 | 23 | 0.9 | |
| Oct 2001 | q2342r15eeThese images were degraded due to an optical oil leak onto the collimator of . Objects from this slitmask were not included in the sample. | 31.5 | 7200 | 21 | 1.2 | |
| Dec 2002 | 2342p280 | 41.3 | 7200 | 30 | 1.5 |
| Field | NObsaaTotal number of LBG candidates observed spectroscopically | StarbbNumber of identified Galactic stars | Low-zgalccNumber of spectroscopically secure galaxies | Low-zprobddNumber of objects with probable identifications | High-zprobeeNumber of objects with probable identifications | LBGffNumber of spectroscopically secure galaxies | QSOggNumber of identified QSOs with | UnidentifiedhhNumber of unidentified objects |
|---|---|---|---|---|---|---|---|---|
| (Category) | (0) | (1) | (2) | (3) | (4) | (5) | (6) | |
| LBQS0056+0125 | 73 | 3 | 12 | 26 | 9 | 12 | 1 | 10 |
| PKS0336–017 | 73 | 0 | 0 | 5 | 8 | 14 | 1 | 45 |
| PSS0808+5215 | 59 | 0 | 4 | 11 | 13 | 14 | 1 | 16 |
| PSS0957+3308 | 48 | 4 | 6 | 6 | 5 | 16 | 1 | 10 |
| BRI1013+0035 | 39 | 3 | 0 | 5 | 7 | 16 | 0 | 8 |
| PSS1057+4555 | 63 | 0 | 2 | 2 | 5 | 20 | 1 | 33 |
| PSS1432+3940 | 31 | 0 | 5 | 5 | 5 | 2 | 0 | 14 |
| PC1643+4631A | 73 | 0 | 3 | 6 | 13 | 29 | 0 | 22 |
| JVAS2344+3433 | 70 | 1 | 15 | 4 | 9 | 9 | 0 | 32 |
| Totals | 529 | 11 | 47 | 70 | 74 | 132 | 5 | 190 |
| FiltersaaObjects meet the criteria of the listed filters only | StarbbNumber of identified Galactic stars | Low-zgalccNumber of spectroscopically secure galaxies | Low-zprobddNumber of objects with probable identifications | High-zprobeeNumber of objects with probable identifications | LBGffNumber of spectroscopically secure galaxies | QSOggNumber of identified QSOs with | UnidentifiedhhNumber of unidentified objects | iiFraction of secure and probable objects with |
|---|---|---|---|---|---|---|---|---|
| BVRI | 0 | 3 | 10 | 12 | 35 | 1 | 15 | 0.79 |
| BVRI jjColor criteria extended 0.2 magnitudes to compensate for photometric uncertainties | 5 | 9 | 16 | 24 | 61 | 3 | 41 | 0.75 |
| VRI | 1 | 3 | 5 | 8 | 11 | 1 | 15 | 0.69 |
| VRI jjColor criteria extended 0.2 magnitudes to compensate for photometric uncertainties | 3 | 18 | 27 | 18 | 37 | 1 | 47 | 0.54 |
| BRI | 0 | 4 | 12 | 12 | 14 | 1 | 45 | 0.63 |
| BRI jjColor criteria extended 0.2 magnitudes to compensate for photometric uncertainties | 2 | 5 | 21 | 19 | 24 | 1 | 69 | 0.61 |
| BR | 0 | 6 | 4 | 8 | 8 | 0 | 14 | 0.62 |
| BR jjColor criteria extended 0.2 magnitudes to compensate for photometric uncertainties | 1 | 15 | 4 | 9 | 9 | 0 | 28 | 0.47 |