Millimeter observations and modeling of the AB Aurigae system
Abstract
We present the results of millimeter observations and a suitable chemical and radiative transfer model of the AB Aurigae (catalog ) (HD 31293 (catalog )) circumstellar disk and surrounding envelope. The integral molecular content of this system is studied by observing CO, C18O, CS, HCO+, DCO+, H2CO, HCN, HNC, and SiO rotational lines with the IRAM 30-m antenna, while the disk is mapped in the HCO+(1-0) transition with the Plateau de Bure interferometer. Using a flared disk model with a vertical temperature gradient and an isothermal spherical envelope model with a shadowed midplane and two unshielded cones together with a gas-grain chemical network, time-dependent abundances of observationally important molecules are calculated. Then a 2D non-LTE line radiative transfer code is applied to compute excitation temperatures of several rotational transitions of HCO+, CO, C18O, and CS molecules. We synthesize the HCO+(1-0) interferometric map along with single-dish CO(2-1), C18O(2-1), HCO+(1-0), HCO+(3-2), CS(2-1), and CS(5-4) spectra and compared them with the observations. Our disk model successfully reproduces observed interferometric HCO+(1-0) data, thereby constraining the following disk properties: (1) the inclination angle , (2) the position angle , (3) the size AU, (4) the mass (with a factor of uncertainty), and (5) that the disk is in Keplerian rotation. Furthermore, indirect evidence for a local inhomogeneity of the envelope at AU is found. The single-dish spectra are synthesized for three different cases, namely, for the disk model, for the envelope model, and for their combination. An overall reasonable agreement between all modeled and acquired line intensities, widths, and profiles is achieved for the latter model, with the exception of the CS(5-4) data that require presence of high density clumpy structures in the model. This allows to constrain the physical structure of the AB Aur inner envelope: (1) its mass-average temperature is about K, (2) the density goes inversely down with the radius, , starting from an initial value cm-3 at AU, and (3) the mass of the shielded region within 2 200 AU is about (the latter two quantities are uncertain by a factor of ). Also, evolutionary nature and lifetime for dispersal of the AB Aur system and Herbig Ae/Be systems in general are discussed.
1 Introduction
Nowadays the study of planet formation attracts particular attention in astrophysics since the recent discovery of extrasolar planets (e.g., Marcy & Butler, 2000). One of the main goals of this study is to envisage the evolutionary scenario for protoplanetary disks around young low- and intermediate-mass stars in which planets might have formed or are forming (e.g., Beckwith, Henning, & Nakagawa, 2000). High-resolution observations with infrared and millimeter interferometers as well as UV-to-cm ground-based and space-borne single-dish telescopes have clearly demonstrated that such disks exist and provided a wealth of information concerning their gas and dust content (see, e.g., Telesco & Knacke, 1991; Kawabe et al., 1993; Mannings & Emerson, 1994; Dutrey, Guilloteau, & Guelin, 1997; van Dishoeck & Blake, 1998; Padgett et al., 1999; van den Ancker et al., 2000; Thi et al., 2001; Wilner et al., 2002; Wahhaj et al., 2003; Apai et al., 2004). On the other hand, increasing computer power and the development of sophisticated numerical algorithms during the last years have made possible a more realistic modeling of their hydrodynamical and chemical evolution (e.g., Gail, 1998; Willacy et al., 1998; Aikawa et al., 2002; Markwick et al., 2002; van Zadelhoff et al., 2003; Ilgner et al., 2004; Semenov, Wiebe, & Henning, 2004). Coupled with appropriate (line) radiative transfer simulations, this offers an unique way to account for relevant observational data not only qualitatively but also quantitatively (e.g., Guilloteau & Dutrey, 1998; Hogerheijde & van der Tak, 2000; Hogerheijde, 2001; van Zadelhoff et al., 2001; Bergin et al., 2003).
The aim of the present paper is to develop the first comprehensive model of the physical, chemical, and dynamical structure of the circumstellar matter orbiting around an intermediate-mass Herbig Ae star based on available observations. We focus on AB Aur, which is one of the nearest and best-studied object among the entire class of the Herbig Ae stars. The AB Aur system consists of a pre-main-sequence (PMS) star with spectral type A0Ve+sh (mass , radius , Thé, de Winter, & Pérez, 1994) located at a distance of pc (van den Ancker et al., 1997; van den Ancker, de Winter, & Tjin A Djin, 1998), which is surrounded by a AU rotating circumstellar disk (Mannings & Sargent, 1997) and an extended ( AU) envelope (Nakajima & Golimowski, 1995; Grady et al., 1999; Roberge et al., 2001). As it is a PMS object, the age of AB Aur can be roughly estimated by using evolutionary track modeling, giving a value of -5 Myr (Thi et al., 2001; DeWarf et al., 2003).
One of the long-standing mysteries that is related to this object is the value of the disk inclination angle. Mannings & Sargent (1997) have spatially resolved a disk-like configuration around AB Aur using OVRO (Owens Valley Radio Observatory) aperture-synthesis imaging in the 13CO(1-0) line. From the aspect ratio of the disk major and marginally resolved minor semiaxes, AU/450 AU, they have derived a disk inclination angle (almost “edge-on” orientation), which is in close agreement with mid-infrared (MIR) observations of Marsh et al. (1995). However, near-infrared (NIR) interferometric observations by Millan-Gabet et al. (1999, 2001) have revealed that the AB Aur system looks nearly spherically-symmetric at AU scale, implying that the inclination angle is close to (“face-on”). This is in accordance with a value of deduced from scattered-light Hubble Space Telescope (HST) coronographic imaging by Grady et al. (1999) and estimated by Eisner et al. (2003) using NIR measurements with the Palomar Testbed Interferometer (PTI). Recently, using coronographic NIR-imaging with the Subaru telescope, Fukagawa et al. (2004) have found an inclination . Moreover, Miroshnichenko et al. (1999) have obtained in the framework of their best-fit “disk-in-envelope” model to the observed spectral energy distribution (SED). A similar value of has been used by Dominik et al. (2003), who have successfully fitted the AB Aur SED by a flared disk model with a puffed-up inner rim. Obviously, there is a general disagreement regarding the disk orientation observed with IR- and mm-interferometers or derived from the SED modeling, though more recent studies point to a face-on configuration. A combination of high-quality observational data and appropriate theoretical modeling would allow to determine precisely, among many other parameters, the orientation of the AB Aur system.
In this paper, we report on the results of our observations at millimeter wavelengths and modeling of the AB Aur system. The object was observed at low resolution (-) using the IRAM 30-m antenna between 2000 and 2001 and at a higher resolution in the HCO+(1-0) line with the IRAM Plateau de Bure Interferometer (PdBI) in 2002. About a dozen rotational transitions of CO, C18O, CS, HCN, HNC, HCO+, DCO+, SiO, and H2CO were detected with the IRAM 30-m telescope. These single-dish and interferometric data as well as supplementary data from the literature form the observational basis for our study.
First, we simulate the time-dependent chemical evolution of the AB Aur system using a gas-grain chemical network and assuming a two-component model of a flared passive accretion disk enshrouded in a diffuse spherical envelope. Second, we apply a 2D non-LTE line radiative transfer code to translate the calculated molecular abundances of CS, CO, and HCO+ to the corresponding synthetic beam-convolved single-dish and interferometric spectra. Next, we compare the observed and synthesized emission lines in a systematic way in order to determine the model parameters consequently, each after another. Iterating these three stages of the modeling, we find the best-fit model of the AB Aur disk and envelope and estimate uncertainties of the constrained parameters.
Our primary intention is to verify the strength of such an advanced theoretical approach to account for various observed interferometric and single-dish molecular spectra simultaneously. As a by-product of this study, many important parameters describing the physical, chemical, and dynamical structure of the AB Aur system can be constrained independently from other investigations performed so far.
This paper is organized as follows. In Sect. 2 we describe our single-dish and interferometric millimeter observations of AB Aur with the PdBI array and IRAM 30-m antenna. The relevant physical and chemical models of the disk and envelope are presented and discussed in Sect. 3. We briefly outline the algorithm and limitations of the 2D line radiative transfer code “URAN(IA)” and calculate excitation temperatures of several rotational transitions of the CS, CO, C18O, and HCO+ molecules in Sect. 4. Using the best-fit model of the AB Aurigae system, the corresponding interferometric map of the HCO+(1-0) emission and single-dish CO(2-1), HCO+(1-0), HCO+(3-2), C18O(2-1), and CS(2-1) spectra are synthesized and compared with the observed spectra in Sect. 5. In this Section, we also discuss how parameters of the best-fit model and their uncertainties are constrained, and what the evolutionary status and lifetime of the AB Aur system are. A summary and final conclusions follow in Sect. 6.
2 Millimeter observations of AB Aur
2.1 The IRAM 30-m data
The observations of AB Aur with the IRAM 30-m dish were performed during two runs in
September 2000 and October 2001. We measured several spectral
line settings at the following sky position:
= 04h 55m 45s.8,
= 33 04.3.
The observations were carried out with all four receivers, A, B, C, D as the frontends and the autocorrelator as the backend. We used the autocorrelator split into different subbands with resolution between 20 kHz and 80 kHz, depending on the presence of (hyper-) fine structure in the transition under investigation. During the first run, the data were obtained applying both the beam wobbling mode with a beamthrow of 240 and the frequency switching mode with a frequency shift of 5 MHz. It turned out that at the position 240 away from the center the emission from the nearby remnant nebulosity is still strong enough to contaminate the observations. Therefore, during the second set of observations, the same frequency switching and a position switching with a larger offset position were used. The typical spectral resolution was about 0.2 km s-1. The total integration time varied between 5 min for CO and min for HCN, depending on the signal strength. The pointing of the instrument was checked about every hour, which resulted in a typical error of . In the case of several measurements of a particular molecular transition with the on-off and frequency switching techniques, we relied always on that which had the highest signal-to-noise ratio. The chopper-wheel method was applied to calibrate the spectra in units of the antenna temperature . To reduce all spectroscopic data, the standard GILDAS software package was used.
We summarize all single-dish detections in Table 1. In total, nine different molecular species were detected: CO, C18O, CS, HCO+, DCO+, H2CO, HCN, HNC, and SiO. The observed intensities (mJy) were converted to the antenna temperatures (Kelvin) and afterwards to the main beam temperatures: = . The beam efficiency values, , were taken from the IRAM Newsletter, N. 18, 1994 (see also Table 1, Col. 10). In addition, the following spectral lines were only marginally detected (with sigma): CN(=3/2-1/2, =5/2-3/2), H2CO(=-), and H2CO(=-). Other observationally interesting lines, like HC3N(=10-9), N2H+(=1-0), C2H(=3/2-1/2), CH3OH(=-), and CH3CN(=5-4, =0) were not detected at all.
Spectra of firmly detected lines are shown in Fig. 1. As can be clearly seen, they basically exhibit three different types of line profiles. The CO(2-1), C18O(2-1), HCO+(1-0), and CS(2-1) lines are single-peaked, centered at the system velocity ( km s-1), and narrow, km s-1 (except for CO(2-1) which is broader than km s-1). In contrast, the HCN(1-0, =2-1) and HNC(1-0) line profiles are slightly broader and apparently have a more complicated asymmetric structure. Furthermore, HCO+(2-1), HCO+(3-2), DCO+(2-1), CS(5-4), and H2CO(31,2-21,1) spectra show a narrow single-peaked shape and a blueshift up to km s-1 from the system velocity, whereas SiO(2-1, 0) has a km s-1 redshift.
The reason for such a diversity in the observed line profiles is not completely understood. We suppose that the blueshifted single lines could actually be broad double-peaked asymmetric spectra, with their less intense redshifted wings being lost in the noise. As we show below, all these lines but CO(2-1) are optically thin and their double-peaked appearance would imply that they trace mainly the rotating AB Aur disk but not much of the quiescent envelope material, whereas the asymmetry of the line profiles can be explained by the pointing errors of the IRAM 30-m antenna during the measurements. This idea is partly confirmed by the fact that some of these spectra, like HCO+(3-2) and CS(5-4), require high densities for the excitation and were measured with small beam sizes of about (which is comparable with the disk).
On the other hand, the IRAM beam for the HCO+(1-0) and CS(2-1) lines is , a few times larger than the apparent disk size, and due to a significant beam dilution in this case, both emission lines come from the extended envelope around AB Aur. This suggestion is further supported by the narrow km s-1 width and central position of these emission lines, typical of cool and quiet gas. This is certainly true also for the CO(2-1) and C18O(2-1) lines, though the broad width of the former spectrum indicates that the CO(2-1) emission is contaminated by moving gas along the line of sight to AB Aur.
We find strong evidence for a large reservoir of cold gas located within around the central star that is indirectly probed by our DCO+(2-1) measurements (see Table 1, footnote “c)”). The negative intensity of this line was detected only in the case of the on-off observations, which can be easily explained. It is known that deuterium fractionation proceeds most efficiently in cold environments, K, (e.g., Bacmann et al., 2003) but not in the inner (warm) parts of protoplanetary disks (see Aikawa & Herbst, 1999). Consequently, the DCO+(2-1) signal is stronger for the cold outer region of the envelope at a distance of AU ( offset) than for the warm inner AU part ( IRAM beam). Therefore, the measured intensity of this emission line became negative after the on-off subtraction of the strong background signal. Note that the HCN(1-0, =2-1) single-peaked asymmetrical spectrum was observed with the same beam wobbling technique and may suffer from a similar contamination.
It is worth to mention that an extended AU region of thermal emission from cold dust grains around AB Aur has been observed by the IRAS satellite at m (Wheelock et al., 1991).
2.2 The Plateau de Bure interferometric data
We mapped the AB Aur system in the HCO+(1-0) line at GHz with the PdBI. These observations were obtained with five 15-m antennas using the compact configuration CD (baselines of 20-80 meters) in March 2002. The phase reference center of our measurements was the same as given in the previous section.
We applied one correlator unit with a total bandwidth of only 10 MHz in order to achieve high frequency resolution of km s-1. The HCO+(1-0) line was centered at the system velocity km s-1. The underlying continuum was detected with broad bands only and has a very low intensity.
The band pass and phase calibration were performed on the objects CRL 618, 0528+134, and 0415+3790. Maps of square pixels with pixel size were produced by the Fourier transformation of the calibrated visibilities using natural weighting. The synthesized HPBW (Half Power Beam Width) size of the beam was ( AU at 144 pc) with a position angle of . For the data reduction and final phase calibration, we applied the Grenoble Software Environment GAG.
We checked the observed HCO+(1-0) spectra by adding the corresponding single-dish IRAM data as missed zero-spacing information to the interferometric visibilities. Different weightings were used, but finally it turned out that the appearance of the interferometric spectral map did not change much. Also, we estimated that only of the flux is recovered by utilizing the zero-spacing data. Therefore, in our modeling we use the HCO+(1-0) PdBI data without zero-spacing correction.
As an example, in Fig. 2 we show the distribution of the HCO+(1-0) intensity-weighted velocities within the AB Aur system, over plotted by the integrated line intensity (contour lines). Though not well spatially resolved with our beam, it appears as a nearly spherically symmetric ( AU) structure with a peculiar “two-lobe” (blueshifted and redshifted) velocity pattern. This is a typical sign of a rotating disk-like configuration that is seen close to face-on (compare with the upper right panel in Fig. 3 by Mannings & Sargent, 1997). The lack of spatial resolution does not allow to determine the radius of this structure precisely, and only an upper limit can be put on this value, AU. The border between two velocity lobes (zero-velocity gradient, ) corresponds to the projection of the disk rotational axis on the sky plane. This implies that the disk positional angle is about .
Whether the disk size and orientation are indeed close to these first-order observational estimates is verified by the extensive modeling in the following sections.
3 Model of the AB Aur system
In this section, we describe and discuss the physical and dynamical model of the AB Aur system in detail. A schematic sketch of this object is presented in Fig. 3. Briefly, it is assumed that the AB Aur system consists of a passive flaring rotating disk surrounded by an extended infalling spherical envelope. This dense protoplanetary disk shades off a torus region in the diffuse envelope from strong stellar UV flux, which allows many complex molecules to form and survive there. In contrast, the composition of the two unshielded envelope lobes is mainly atomic. Since the star directly heats these lobes, they have to be hotter; in a pure hydrostatic equilibrium it would also imply that they are less dense than the shadowed part of the envelope. Thus, an observationally significant amount of molecules is only reached during the chemical evolution of the AB Aur disk and shielded part of the envelope.
3.1 Disk structure and parameters
The UV-to-mm surveys of Herbig Ae stars have unveiled that many of these stars are surrounded by circumstellar gas and dust distributed in flattened (disk-like) configurations (e.g., Natta et al., 2001). Indeed, the presence of a compact structure ( AU) around AB Aur has been revealed from IR interferometric measurements (e.g., Marsh et al., 1995; Millan-Gabet et al., 1999, 2001; Eisner et al., 2003), at visual wavelengths by the photometric and polarimetric observations of Grinin & Rostopchina (1996), and from millimeter interferometric observations of Mannings & Sargent (1997). Moreover, the latter authors have reported on the Keplerian rotation of the gas in this object. All these facts indicate that a rotating protoplanetary disk encircles the AB Aur star. Given that the measured mass accretion rate on the central star is low, yr-1 (e.g., Grady et al., 1996), the vertical structure of the AB Aur disk is globally sustained by reprocessing stellar radiation (passive disk) but not due to viscous dissipation.
Some clues concerning the dust content of the AB Aur system can be gained from the analysis of the SED. The emission bands of various dust materials have been detected in the IR spectra of AB Aur with the Infrared Space Observatory (ISO), most notably those of iron oxide, PAHs, amorphous silicates, and water ice (van den Ancker et al., 2000). The strong silicate emission band at m points to the presence of a large amount of warm (- K) and small (-m) amorphous silicate grains in this object. Together with the absence of crystalline silicate features in the spectra, it implies that the dust in AB Aur is thermally unprocessed and may still resemble pristine interstellar grains even after a few Myr of the evolution (for more details, see Bouwman et al., 2001; Meeus et al., 2001).
A large amount of warm dust and gas observed in the AB Aur system (e.g. Thi et al., 2001) cannot be accounted for without invoking a flared geometry of the disk or/and an additional disk heating by the surrounding envelope (importance of the latter effect is discussed in Vinković et al., 2003). This idea is further supported by the results of the detailed modeling of Eisner et al. (2003) and Brittain et al. (2003), who have found that a flared disk model with a puffed-up inner rim provides a suitable fit to their NIR- and MIR-observational data.
Unfortunately, the disk of AB Aur is detected with the PdBI array only in one line and at modest resolution. Thus it is not possible to unravel the disk thermal and density structure in both radial and vertical directions, using these observational data alone. On the other hand, many other parameters of the AB Aur system have been revealed from previous observations, which can be used to construct a disk chemical model.
In this paper, we adopt the passive flared disk model of Dullemond & Dominik (2004). This disk model is calculated using a 2D axisymmetric continuum radiative transfer code and silicate dust opacity data (Draine & Lee, 1984) under the assumption of hydrostatic equilibrium in vertical direction. The a priori fixed disk parameters are as follows.
We assume that the dust grains are uniform spheres with radius of 0.3m, though the additional case of larger 1m particles is also considered. In the model, we focus only on a single-size grain distribution instead of a range of dust sizes because otherwise it would significantly slow down the chemical computations and 2D disk modeling, thus making impossible efficient fitting of the model parameters. The disk surface density as a function of radius obeys a power law, , with the exponent and the initial value to be constrained. Note that the adopted radial gradient is somewhat steeper than the usually assumed value between about and (see, Miroshnichenko et al., 1999; Natta et al., 2001). Therefore, we consider two additional models with (minimum-mass solar nebula) and (uniform disk).
The disk has its inner boundary at 0.7 AU (dust sublimation radius, K) and extends up to several hundreds AU in radial direction, where its vertical height ranges a comparable spatial scale. The ratio of the disk outer radius to the vertical height at which the star is still sufficiently obscured, , is used to estimate what fraction of the entire AB Aur envelope is shadowed (see Fig. 3, dark gray region).
We adopt the following parameters of the central star: K, , (see Table Millimeter observations and modeling of the AB Aurigae system). It is assumed that the disk is illuminated by the UV radiation from the star and by the interstellar (IS) UV radiation. The intensity of the stellar UV flux is calculated using the Kurucz (1993) ATLAS9 of stellar spectra. It is converted to the standard factor, at the distance of 100 AU, where corresponds to the mean interstellar UV field of Draine (1978). To calculate the visual extinction by dust grains toward the central star at a given disk location, we use the following expression (1D plane-parallel case):
| (1) |
where is the total column density of hydrogen nuclei between the point and the star and the column density to reach is cm-2 and cm-2 for the grain radius m and m, respectively. The extinction of the interstellar UV radiation () is computed in the same way but in vertical direction only. We calculate the penetration of cosmic rays (CR) into the disk by Eq. (3) from Semenov, Wiebe, & Henning (2004, hereafter Paper I) assuming an initial value of the ionization rate s-1. Finally, ionization due to the decay of short-living radionuclides, like 26Al, is considered with a total rate s-1 (Umebayashi & Nakano, 1981).
Overall, a wide range of relevant physical parameters characterizes the disk model, namely, temperatures between 35 K and 1 500 K, densities between g cm-3 and g cm-3, factors , between 0 and more than 100 mag, and ionization rates between s-1 and s-1. The disk thermal and density structure is shown in Fig. 4.
3.2 Envelope model
The body of observational data about the extended nebulosity surrounding AB Aur allows constraining some of its basic parameters prior to the detailed modeling.
The visual extinction observed toward this star is low, - (van den Ancker et al., 1997, 2000; Roberge et al., 2001; Fuente et al., 2002), and can be attributed to light scattering and absorption by dust grains in the nearby envelope and interstellar matter (ISM). Thus, the AB Aur envelope is diffuse and its average density has to be low.
The apparent size and morphology of the envelope depends on the spectral region at which observations are performed. For instance, an extended ( AU) cloud of cold dust has been observed with the IRAS satellite at m, which is confirmed by our IRAM single-dish observations. At visual wavelengths, the spherically-symmetric envelope has been traced from AU to AU with the HST coronographic imaging by Grady et al. (1999), who have also found that it is highly inhomogeneous from hundreds AU down to tens of AU (spiral arches). They have mentioned that this symmetric (inner) envelope is further surrounded by a large band of the reflection nebulosity that has been detected with ground-based telescopes. An envelope of almost the same structure has been observed by Nakajima & Golimowski (1995) using the John Hopkins University Coronograph. They have put a lower limit on the mass of the reflection nebulosity using its visual brightness, (this seems to be a strong underestimation). Di Francesco et al. (1998) have not resolved the AB Aur envelope with the Kuiper Airborne Observatory at 50m and m and gave an upper limit to its size, AU.
At millimeter wavelengths, the global distribution of the circumstellar matter around AB Aur has been probed in several low rotational lines of CO isotopomers with the IRAM 30-m antenna by Fuente et al. (2002). Fuente et al. have estimated the envelope mass within 0.08 pc ( AU) to be . They have classified AB Aur as a Class II object according to their notation (a star embedded in the remnant natal cloud), which implies a power-law radial density profile with an exponent. With these two limiting cases of the density profile, the derived mass , and assuming that the envelope extends down to the dust sublimation radius AU, we find that the typical density at is between and cm-3.
Moreover, Miroshnichenko et al. (1999) have fitted the SED of AB Aur using a model of a flat disk immersed in a spherically-symmetric diffuse envelope. Their best-fit parameters for the AB Aur envelope are the following: the mass is about , the radial density distribution follows a broken power law, for and for AU with initial density of cm-3, and the temperature scales with radius as .
Recently, Elia et al. (2004) have fitted the AB Aur SED from UV to the radio domain with a similar model of a pure spherical envelope and assuming large porous grains (dust emissivity ). They have adopted radial power-law temperature () and density () distributions with K and cm-3 at AU.
Using these observational facts and theoretical constraints, we construct a model of the AB Aur envelope. Since we probed the molecular content of the AB Aur envelope in several lines with the IRAM 30-m antenna, it allows to derive the temperature and density structure of the envelope directly from these data. Thus, extensive modeling of its physical structure with an advanced radiative (hydro-) code can be omitted.
We focus on the inner part of the entire AB Aur envelope and assume that it is spherically symmetric, homogeneous, and has a radius of AU (restricted by the largest IRAM beam size used in our single-dish observations). Given a low inclination of the disk inferred from the interferometric data, the shielded part of the envelope is also seen close to face-on. In this case, it makes no sense to consider the outer regions of the envelope beyond 2 200 AU since they are molecularly deficient along the line of sight (apart from H2 and CO), while in the opposite direction the emitting material is out of the used IRAM beams. We assume that the inner radius of the AB Aur envelope coincides with the disk outer edge, –600 AU.
The envelope radial density profile is modeled with a power law, , where and are parameters to be constrained. We assume that the shadowed part of the AB Aur envelope is isothermal, than its mean kinetic temperature can be directly estimated from the intensity of the optically thick CO(2-1) line: - K (see Table 1). Our initial guess for the inner envelope temperature is similar to the range - K derived by Thi et al. (2001) from the analysis of excitation conditions for several CO low- and high-rotational lines. We assume that gas and dust species are in thermal equilibrium, which is a justified assumption for the inner (dense, cold, and shadowed) part of the envelope.
The gas-grain and grain-grain collisional timescales in the AB Aur envelope are larger than those in the dense disk. This essentially rules out the possibility that a profound grain growth up to cm-sized bodies occurred there during the contraction phase, which is further supported by the fact that the bulk of dust grains in the AB Aur system are smaller than a few microns. Therefore, we assume that dust particles in the envelope are small uniform spheres with radius of m.
The approach of the previous subsection is adopted to compute the UV flux in the shadowed part of the envelope, but with some minor modifications. As this region is shielded from the direct stellar radiation, it is only necessary to take into account the penetration of the IS UV photons. Given the low radial density of the envelope ( g cm-2), the constant CR-ionization rate is taken, s-1, whereas ionization due to the decay of the radionuclides is negligibly low, .
3.3 Chemical model
The chemical model adopted in this study is the same as in Paper I, but with a few modifications. Briefly, we use the UMIST 95 database of gas-phase reactions (Millar et al., 1997) supplied by a set of dust surface reactions from Hasegawa, Herbst, & Leung (1992) and Hasegawa & Herbst (1993). In the rates of reactions with cosmic ray particles and CR-induced UV photons the CR-ionization rate, , is replaced either by the sum of (disk) or left unchanged (envelope). Contrary to Paper I and in accordance with the studies by Willacy & Langer (2000), Aikawa et al. (2002), and van Zadelhoff et al. (2003), we assume that the probability of species to stick onto dust grain surfaces is 100%. Finally, we enlarge the chemical network with a set of deuteration reactions (Bergin, personal communication) and take into account self- and mutual-shielding of H2 and CO molecules. Our chemical network does not include reactions involving C18O, therefore we scale down the CO abundances calculated without self-shielding by the isotopic ratio O/18O=490 (Wilson & Rood, 1994).
Overall, this network consists of 560 species made of 13 elements, and 5336 reactions.
Though Ilgner et al. (2004) have found that the vertical mixing and radial transport may significantly affect the disk chemical evolution under certain conditions, we do not consider these processes in our model because of three main reasons. First, the estimated mass accretion rate on AB Aur is low, therefore the radial transport of matter toward the central star is slow. Second, there is observational evidence that turbulence in protoplanetary disks is low, -0.2 km s-1 (see, e.g. Dartois, Dutrey, & Guilloteau, 2003), and consequently diffusion processes can be not that important. Last (but not least) reason why mixing processes are not considered is that the chemical model has to be remain the numerically manageable.
3.3.1 Deuterium chemistry
We adopt deuterium chemical reactions from Bergin, Neufeld, & Melnick (1999). This set includes essential formation and destruction routes relevant to the chemical evolution of OD and HDO. It consists of about 60 gas-phase and 10 gas-grain reactions among 11 species including accretion onto and desorption from dust surfaces of D, OD, and HDO species. The elemental abundance of deuterium, D/H=, is taken from Piskunov et al. (1997).
3.3.2 Self- and mutual-shielding of H2 and CO
The photodissociation of H2 occurs through discrete absorption in Werner and Lyman bands in the wavelength range between Å and Å with an efficiency of (e.g., Dalgarno & Stephens, 1970). Given the fact that these lines become optically thick when the hydrogen column density reaches cm-2, it is unavoidable to take into account the effect of the H2 line self-shielding both for the disk and envelope chemistry. To calculate the H2 shielding, we use an analytical expression (37) from Draine & Bertoldi (1996),
| (2) |
where cm-2 and cm s-1. The unattenuated dissociation rate of hydrogen molecules for the interstellar UV radiation () is taken as cm3 s-1.
The photodissociation of CO molecules is dominated by discrete absorption at , though it also proceeds via continuum absorption (van Dishoeck, 1988). Since hydrogen molecules dissociate in the same wavelength range, one has to account for mutual-shielding by coincidental lines of H2 and dust extinction when calculating the CO self-shielding. This is a complex task and there is no a convenient analytical representation similar to Eq. (2). Therefore, we follow the approach of van Zadelhoff et al. (2003) and compute the CO self-shielding by interpolating the values from Table 11 of Lee et al. (1996), where a set of the shielding factors is given as a function of the H2 and CO column densities and visual extinction by dust grains. As initial guess for the CO column densities in the medium under consideration, we use those of H2 and scale them by a constant factor, CO/H. The adopted unattenuated photodissociation rate of CO molecules is cm3 s-1.
3.3.3 Results of chemical calculations
The initial abundances for the chemical model are calculated as in Paper I. Concisely, we simulate the chemical evolution of a molecular cloud with uniform temperature K and density cm-3 for 1 Myr with the reaction network described above and the “low metal” abundances from Wiebe, Semenov, & Henning (2003).
Using these pre-computed quantities and the model of the AB Aur system, a set of time-dependent molecular abundances and vertical column densities are computed for 3 Myr of the evolution in every iterative step of the modeling. Below we discuss the results obtained with the final (best-fit) set of model parameters (Tables Millimeter observations and modeling of the AB Aurigae system–4).
The calculated HCO+ and CO vertical column densities as a function of radius are shown in Fig. 5. As can be clearly seen, in general follows the radial decline of the surface density and thus is less steep for the AB Aur envelope than for the disk. The fact that CO column densities are strongly related to the total amount of hydrogen in both the disk and envelope, (CO)/(H), merely reflects chemical stability and efficient shielding of CO molecules from dissociating UV radiation. In contrast, the HCO+ column densities as a function of radius show a more complicated behavior because the chemical evolution of this molecular ion is governed by a larger set of formation and destruction pathways (compare solid and dashed lines in Fig 5). For instance, a rapid decrease of in the outer parts of the disk and envelope is caused not only by the decline of the surface density, but also due to enhanced recombination rate of HCO+ molecular ions with abundant electrons. These regions are rather transparent for the impinging UV photons that dissociate molecules and ionize chemical species (mostly carbon atoms), thereby increasing the electron concentration in the gas-phase and decreasing the HCO+ abundances.
The difference between the chemical evolution of the disk and shielded part of the envelope is the following. The disk has density, temperature, and UV-intensity gradients in both vertical and radial directions, leading to a “layered” chemical structure. The abundances of many gas-phase species peak at the disk intermediate layer where the UV flux is mild enough to drive a rich molecular chemistry (e.g., Aikawa et al., 2002; Semenov, Wiebe, & Henning, 2004). Contrary to the disk, the shadowed envelope region is cold, less dense, and opaque to the stellar UV radiation (but not to the interstellar UV photons). Therefore, many photoreactions and reactions with barrier cannot efficiently proceed there, which results in a more simplified (“dark”) chemistry.
It is interesting that the chemical equilibrium for HCO+ and many other species is achieved almost everywhere in the disk and envelope at - Myr (compare open squares and solid line in the left and right panels in Fig. 5). However, we find that this is not true for deuterated species whose abundances and column densities vary during the entire 3 Myr of the evolution, and thus may serve as a “chemical clock” (e.g., Aikawa & Herbst, 1999). We also investigate how various physical and chemical factors influence the evolution of HCO+ in the disk in detail.
First, we consider the standard model of the UMIST 95 chemistry, m grains, and Myr, but two limiting gas-to-dust mass ratios, 10 and 1000. As can be clearly seen, the resulting column densities are nearly the same as in the case of the standard value for AU, cm-2 (compare crosses, open circles, and solid line in Fig 5, left panel). At larger radii, these quantities for decrease faster with radius than the column densities computed with the standard chemical model and the difference at AU reaches about 3 orders of magnitude. Contrary, in the case of the radial decline is shallower than in the standard case, and at AU the calculated column densities differ by a factor of 10. A similar tendency is seen for the model of larger 1m dust particles. In the inner disk regions, AU, the corresponding HCO+ column densities are times higher than that of the standard model , while at larger radii they decrease with radius like in the case of (compare solid line with open triangles in the left panel in Fig 5).
All these trends can be understood if one recalls the fact that the disk at AU has a so low surface density that the interstellar UV radiation can easily penetrate and thus controls the chemistry. As we noted above, the HCO+ abundances strongly depend on the total amount of electrons in the gas-phase. In turn, the overall electron concentration in the outer disk regions is related to the value of dust extinction in vertical direction: the higher the extinction is, the lower is the electron concentration (and the higher is the resulting HCO+ column densities). For a fixed hydrogen column density and two models of uniform grains, the ratio of the corresponding visual extinction values is
| (3) |
where is the gas-to-dust mass ratio and is the extinction efficiency factor for a particle with the radius .
According to this equation, the disk with the gas-to-dust ratio of is 10 times more transparent in vertical direction than in the case of the standard model with , while the disk with 10 times more dust grains () is 10 times more opaque. Similarly, in the case of larger m grains, the total visual extinction is times smaller than that of the standard m grain model due to times higher extinction efficiency and about 27 times reduced amount of dust particles in unit volume. Moreover, the times larger radius of m dust grains in respect to the m particles also implies that Coulomb attraction of positively charged ions and negatively charged dust particles is smaller, leading to less effective grain neutralization of HCO+ ions. In turn, this results in the bump of the HCO+ column density curve at AU (compare solid line with open triangles in Fig 5).
Another important question that needs to be clarified is how sensitive the chemical modeling to the adopted set of reactions is. There are two available chemical databases that are widely used, namely, UMIST111http://vizier.cfa.harvard.edu/viz-bin/VizieR?-source=J/A+AS/121/139 95 (University of Manchester, T. Millar’s group; Millar et al., 1997) and OSU222http://www.physics.ohio-state.edu/$∼$eric/research_files/cddata.july03 03 (Ohio State University, E. Herbst’s group; Smith, Herbst, & Chang, 2004). These networks comprise hundreds of species and thousands of reactions with the rates that are not always the same (Semenov et al., 2004).
To answer this question, we repeat the chemical calculations for the disk model with m dust grains using the OSU 03 network instead of the UMIST 95 reaction set. The corresponding HCO+ column densities are depicted in Fig. 5, left panel, dot-dashed curve. As can be clearly seen, for the OSU 03 and UMIST 95 models are nearly the same everywhere in the disk except for the very inner parts, AU (compare dot-dashed line and open triangles in the Figure). There, the column densities of HCO+ computed with the OSU 03 model decrease more rapidly with radius than in the case of the UMIST 95 network. In a forthcoming paper (Semenov et al., in preparation), we will compare the results of the disk chemical modeling with the UMIST 95 and OSU 03 networks and investigate in detail what the reasons for the difference in resulting molecular abundances are.
Moreover, recently Vasyunin et al. (2004) have shown that computed abundances of HCO+ ions in dark and diffuse molecular clouds can be uncertain by a factor of - due to uncertainties in the reaction rate coefficients of the UMIST 95 database (see Fig. 1 therein). Given a broad range of physical conditions encountered in the applied disk model, most probably the calculated HCO+ column densities suffer from the same uncertainty of a factor of .
The total computational time for the disk model with 7 radial and 11 vertical grid points is hours on a Pentium IV 2.4 GHz PC, while it takes about several hours to compute the chemical evolution of the envelope model with 28 grid points.
4 2D line radiative transfer calculations
In this section, we describe our approach to simulate the radiative transfer in molecular lines and to synthesize their spectra. In essence, the radiative transfer modeling is based on the solution to the radiative transfer (RT) equation coupled with balance equations for molecular level populations ( see, e.g., Rybicki & Hummer, 1991). Prior to the modeling, one needs to provide density, temperature, and velocity distributions as well as molecular abundances in the medium.
We solve the system of the radiative transfer and balance equations with the 2D non-LTE code “URAN(IA)” developed by Pavlyuchenkov & Shustov (2004). It partly uses the scheme originally proposed and implemented in the publically available 1D code “RATRAN” (Hogerheijde & van der Tak, 2000). The iterative algorithm of “URAN(IA)” is the following.
First, initial molecular level populations and a set of photon random paths through the model grid have to be defined. Using these quantities, the specific intensities are computed for each cell by the explicit integration of the RT-equation along the pre-defined photon paths . For the photon ray-tracing, the code employs a Monte Carlo description. After that, and are used to calculate the mean line intensity in every cell. The computed mean intensities are utilized in the next iteration step to refine the level populations by solving balance equations in all model cells. To accelerate convergence of the entire procedure for optically thick lines, additional internal subiterations for each grid cell (ALI scheme) are included on top of the global iterations. The adopted acceleration scheme relies on the fact that the calculated mean line intensity in every particular cell can be divided into internal component generated in the cell and external contributions from other cells of the grid. Therefore, subiterations are applied to bring into an agreement the internal mean intensity of the line and corresponding level populations (for more detail, see Hogerheijde & van der Tak, 2000).
The global iterations are performed until the final molecular level populations are obtained. After that, we repeat the calculations again, but with another set of pre-defined random photon paths in order to estimate a typical error of the computed values. In our simulations, the relative errors in the level populations are always smaller than . Finally, the resulting level populations are used to calculate the corresponding excitation temperatures, which are further transformed into synthetic beam-convolved single-dish and interferometric spectra.
There are a few limitations in our code. Since “URAN(IA)” does not contain a realization of the radiative transfer in the lines with fine structures yet, formally we are only allowed to consider rotational transitions of CO, CS, HCO+ and their isotopomers among the full set of the detected species. The utilized collisional rate data for CO, CS, and HCO+ are taken from Flower (1985), Green & Chapman (1978), Monteiro (1985), and Green (1975), respectively. Also, we do not take into account the continuum absorption and emission by dust grains, which is a reliable approximation for optically thin and moderately optically thick lines (e.g., Leung & Liszt, 1976).
4.1 Calculated excitation temperatures
For the line radiative transfer modeling of the AB Aur system we use the set of input parameters compiled in Table 5. Standard Keplerian rotation is adopted to represent the regular velocity field of the disk. The quality of the acquired interferometric data does not permit us to verify from the radial velocity shifts of the observed lines whether the disk rotation is indeed Keplerian () or follows another power law (see, e.g., Simon, Dutrey, & Guilloteau, 2000). However, the AB Aur disk has a much smaller mass in comparison with the stellar mass (e.g., Mannings & Sargent, 1997), therefore such an assumption should be valid.
Little is known about the dynamical state of the AB Aur envelope. Therefore, we consider a steady accretion of the envelope material on the disk (and consequently on the central star), with the regular velocity that can be found from the conservation-of-mass principle and adopted power-law exponent of the radial density distribution: . For example, for the infall velocity decreases as . In agreement with recent observations by Thi et al. (2001) and Dartois, Dutrey, & Guilloteau (2003), the uniform microturbulent velocity km s-1 is assumed for both the disk and envelope model.
The computed disk excitation temperatures of the CO(2-1), CS(2-1), HCO+(1-0), and HCO+(3-2) transitions are shown in Fig. 6. As can be clearly seen, the excitation temperature for the CO(2-1) line follows the kinetic temperature everywhere in the disk but the surface layer (compare the left panel in Fig. 4 with the top left panel in Fig. 6). This line is easily excited (critical density cm-3) and thus thermalized in most of the disk and envelope regions, cm-3. Given this fact and the high abundance of CO molecules, CO/H, the CO(2-1) line is optically thick with - in the disk and in the envelope.
In contrast, the CS(2-1) transition requires about 200 times higher density for thermalization, therefore its excitation temperature peaks closer to the dense disk interior (see the top right panel in Fig. 6). The optical thickness of the CS(2-1) line is low, , mainly due to much lower gas-phase CS abundances compared with the amount of CO molecules, .
The disk excitation temperatures of the HCO+(1-0) and HCO+ (3-2) transitions are shown in bottom of Fig. 6 (left and right panels, respectively). The 3-2 rotational line is excited at about 10 times higher density than the critical density for HCO+(1-0), cm-3, leading to the lower excitation temperatures in the former case. Since HCO+ ions are only times more abundant than CS molecules, the HCO+(1-0) and HCO+(3-2) lines have a low optical depth of about . The disk excitation map for the C18O(2-1) emission is similar to that of CO(2-1) and therefore is not shown.
Note that the CS(2-1) and HCO+(1-0) excitation temperatures show a broad zone in the disk intermediate layer, where (light gray areas in the bottom left and top right panels, Fig. 6). Here a non-LTE effect plays a role. The inversion in the rotational level populations is caused by a specific ratio between collisional and radiative (de-) excitation probabilities. In those disk parts, where the concentration of CS and HCO+ is rather low, their levels are excited and de-excited by collisions and only radiatively de-excited (but not excited). Thus, the LTE condition is broken and level populations do not follow the Boltzmann distribution. This effect for the CS molecule has been considered by Liszt & Leung (1977) in detail. However, such inversion does not lead to significant maser amplification of the line intensity even for the most favorable case of the edge-on disk. As soon as the optical depth of the line approaches unity (which is only possible in radial direction), stimulated radiative transitions become operative. They additionally excite and de-excite the level populations and destroy the inversion.
We do not present the resulting excitation temperatures for the envelope model because the excitation conditions there do not change as strongly as in the case of the disk, and resemble those of the low-density disk surface. Consequently, the CS(2-1) and HCO+(3-2) emission lines are not thermalized anywhere in the envelope, , whereas HCO+(1-0) is partly thermalized in the inner part at AU: . Finally, the CO(2-1) and C18O(2-1) lines are thermalized in the entire envelope with K.
A typical computation for a grid model, 11 transitions, and the optically thick CO(2-1) line needs about 2 days on a Pentium IV 2.4 GHz PC. In the extremely optically thin approximation applied to simulate the radiative transfer in the CS(2-1), CS(5-4), C18O(2-1), HCO+(1-0), and HCO+(3-2) lines, the photon ray tracing and ALI scheme are not used. In this case, the level populations are computed within a few seconds. The validity of this approach is verified by comparing once the level populations of the CS(2-1), C18O(2-1), HCO+(1-0), and HCO+(3-2) transitions calculated with the full line radiative transfer and in the limit of the extremely low optical depth. It is found that both methods yield very similar results both for the disk and envelope model.
5 Results of the line radiative transfer modeling
In this section, we confront the theoretical model of the AB Aur system with the observational data and constrain basic parameters of the disk and envelope. It would be mathematically more correct to compare the interferometric data with the model results in the uv-plane in order to avoid the highly nonlinear deconvolution procedure (see, e.g. Guilloteau & Dutrey, 1998), but this is only meaningful for low-noise data, when model parameters can be determined with a high accuracy, e.g., by utilizing chi-square minimization. However, we follow a more illustrative way and face the synthesized HCO+(1-0) interferometric map directly with the observed line profiles. Another limiting factor for our numerical simulations is the computational time. Typically, it takes about 10-30 minutes to generate one synthetic single-dish spectrum and days to synthesize the entire interferometric map with a 2.4 GHz Pentium IV machine. Together with chemical and non-LTE line radiative transfer calculations, a total computational time for one modeling run can be as long as about 3 days. Therefore, a full -minimization in the space of all parameters to be constrained is not feasible for our approach, and one has to estimate these values and their uncertainties with a more robust analysis.
This analysis is based on the fact that many model parameters can be constrained independently from the others in a subsequent way (“step-by-step”), starting from suitable initial guesses. First, we use the first-order estimates for the AB Aur disk orientation and determine more precisely the value of the disk inclination by fitting the width of the central HCO+(1-0) spectrum in the interferometric map. Next, with this best-fit value we derive the disk positional angle by fitting the asymmetry of the observed line profiles out of the map center. After the best-fit disk orientation is found, we investigate how the radial gradient of the normalized synthetic line intensities depends on the assumed disk radius and choose accordingly the best-fit value of the disk size. Finally, the derived disk orientation and radius allow us to constrain the total disk mass because this value defines the absolute intensities of the modeled HCO+(1-0) lines on the interferometric map. The uncertainties of the best-fit disk parameters are found by the same iterative way.
Consequently, we constrain temperature, density structure, and mass of the inner, shielded part of the AB Aur envelope using the best-fit disk orientation and radius. First, we determine the temperature of the envelope and its uncertainty by modeling the intensity of the optically thick CO(2-1) line (see Sect. 3.2). Second, with the best-fit envelope temperature, we iteratively find the value of the radial density gradient, initial density at the envelope inner radius, and their uncertainties by fitting the observed single-dish HCO+(1-0), HCO+(3-2), C18O(2-1) and CS(2-1) spectra.
5.1 Interferometric HCO+(1-0) map
We present the results for our best-fit model of the AB Aur disk. Then we discuss how parameters of this model are actually derived. This model is found after approximately 15 subsequent iterative steps of the modeling.
The simulated and observed interferometric HCO+(1-0) maps are compared in Fig. 7. As can be clearly seen, intensities and widths of the synthetic spectra match well the observed values, K and km s-1. Moreover, the synthesized line profiles in general follow the shape of the observed spectra on the entire interferometric map. This proofs again that the Keplerian law is a reasonable representation of the disk global velocity field.
The low intensities of the observed interferometric spectra, K, suggest that the HCO+(1-0) line is optically thin. Given a typical excitation temperature in the disk for this transition, K (see Fig. 6, lower left panel), the optical depth of HCO+(1-0) can be roughly estimated as , exactly the value we have found in Sect. 4.1.
The double-peaked shape of the synthetic line profiles and their asymmetry are the result of the Gaussian convolution with the beam over the inclined disk of a similar size (see Table 3). Every HCO+(1-0) spectrum is a beam-weighted average of the emission generated in various disk regions that have a broad velocity range (from negative to positive values in respect to the system velocity). The central spectrum on the interferometric map has a symmetric profile because disk locations with various velocities contribute equally to the formation of this line. Similarly, all spectra located along the projection of the disk rotational axis on the sky plane (zero-velocity line, ) are also symmetric (compare the line profiles nearby straight line and in perpendicular direction in Fig. 7). All other spectra have asymmetric line profiles due to the beam weighting over the disk parts that have a lack of either blueshifted or redshifted emission components. The contrast between the left and right intensity peaks of the HCO+(1-0) lines depends on the orientation of the beam in respect to the zero-velocity line and is maximal in orthogonal direction.
The convolution with a beam size comparable to the size of the adopted disk model leads to the non-zero HCO+(1-0) intensities beyond the disk outer boundary (depicted by circle in Fig. 7). It is worth to mention here that the convolution with a beam size that is several times smaller than the disk size would produce a synthetic map of the narrow single-peaked spectra with different velocity shifts in different disk parts, .
Note that there is a region in the interferometric map out of the disk (, ), where the observed HCO+(1-0) lines have a peculiar shape that is far from the modeled one (upper right corner in Fig. 7). This shape has a K absorption feature with about km s-1 offset from the system velocity and a K emission peak centered at , closely resembling an inverse P Cygni profile. It has been checked that the profiles of these “emission-absorption” spectra are stable to the data reduction with various CLEANing parameters and weightings. As we mentioned in Section 2.2, the detected HCO+(1-0) continuum is low, which contradicts with the absolute intensity of the absorption peak. Thus, this is a “ghost” feature in the spectra, though the strength, width, and position of the central peak is consistent with the emission arising in low-velocity envelope regions. Moreover, the peculiarity in the observed profiles is only seen in a part of the full interferometric map.
The presence of a small dense structure in the disk outer region or nearby envelope could be responsible for the appearance of such emission-absorption spectra in the deconvolved interferometric map. Why this structure has to be small and dense can be easily explained: its small () angular extent is a necessary condition to produce the peculiar profiles in a confined area of the whole spectral map only, while a high density contrast is needed for the interferometer to “see” the presence of such an inhomogeneity. Interestingly, Fukagawa et al. (2004) have resolved the AB Aur system at the AU scale using the Subaru Coronographic Imager and Adaptive Optics at near-infrared wavelengths and discovered a few spiral arms and a knotty structure associated with a circular inhomogeneous structure of AU radius (see Fig. 2 and 3 therein). Thus, it is likely that one of these local and compact structures with enhanced density has been detected during our PdBI observational campaign.
The fact that the interferometer probes only dense and compact matter is illustrated in Fig. 8, where we compare the observed beam-normalized HCO+(1-0) IRAM 30-m and averaged PdBI spectra. The IRAM line profile is narrow, km s-1 and single-peaked, while the PdBI spectrum is about 4 km s-1 wide and has a double-peaked shape. Furthermore, their normalized intensities differ by a factor of 2. The reason for such a diversity in the observed spectra is that the IRAM 30-m antenna has beam for the HCO+(1-0) transition, covers large spatial scales, and therefore is not capable in detecting the emission from the small AB Aur disk due to the huge beam dilution. Instead, the HCO+(1-0) emission from the surrounding envelope is only observed. Contrary, the PdBI beam is sensitive to small spatial scales and thus does not “feel” the emission that comes from the low-density and extended envelope (e.g., see the spectrum at the position , in Fig. 7).
5.1.1 Disk orientation
First, the disk inclination angle is determined by comparing the observed HCO+(1-0) line profile at the center of the interferometric map with the corresponding synthetic spectrum. The modeled central line has a symmetric double-peaked profile independent of the actual value of the disk positional angle (see Fig. 7, , ). However, the line width and intensity do depend on the assumed value of the inclination angle, as shown in Fig. 9. It can be clearly seen that a inclination of the disk results in a too narrow ( km s-1) modeled spectrum compared with the observed km s-1 line width (Fig. 9, left panel). On the other hand, the disk inclined by produces a slightly broader spectrum than observed (Fig. 9, right panel). Thus, the disk inclination angle has the best-fit value somewhere between these two limits, (middle panel in the Figure). We take as the best-fit inclination angle of the AB Aur disk. Note that a similar approach to constrain the disk inclination was recently presented by Qi et al. (2004), who applied it for the TW Hya disk based on the SMA observations in the CO(2-1) and CO(3-2) lines.
The accuracy of this value is mainly determined by the uncertainty in stellar mass and by the radial gradient of the disk surface density, whereas other model parameters play a minor role.
The width of the modeled central HCO+(1-0) line for a fixed value of the disk inclination angle and density gradient varies as (Keplerian law). We consider two values of the stellar mass, and , and find that for the low-mass limit of the best-fit disk inclination is , while for the star this value is about . In addition, we use two disk models with shallower surface density profiles, namely, (minimum-mass solar nebula) and (uniform disk). In this case, the HCO+ column densities peak at larger radii than for the reference model with . However, we regain that such a modification does not lead to a significant spread in the derived best-fit inclination angle. For the uniform disk model the best-fit value is , whereas for the minimum-mass solar nebula it is . Taking into account all these uncertainty factors, we estimate that the AB Aur disk is inclined by .
The value of the disk positional angle is constrained in a similar way. In Section 2.2 a first-order observational estimate, , has been obtained. In order to determine it better, we use the best-fit inclination angle and consider three different values of the positional angle: , 80, and 120. The resulting modeled spectra are compared with the observational data at off-central positions of the interferometric map in Fig. 10.
The most noteworthy changes in the synthetic HCO+(1-0) lines are seen in two spectra at , (S1) and , (S2). The disk positional angle can be essentially ruled out because the asymmetry of the observed S1 profile is not properly fitted with this model (see the lower left corner of the left panel in Fig. 10). Contrary, with it is not possible to explain the observed shape of the S2 spectrum, see the left upper corner of the right panel in the Figure. Finally, the best fit to the asymmetry of the observed line profiles is obtained with the disk positional angle of (middle panel in Fig. 10). However, this value cannot be constrained as accurately as the disk inclination angle since the noisy observational data can be fitted equally well with any other positional angle between and . Therefore, the best-fit value of the disk positional angle is .
The derived orientation of the AB Aur disk, and , is in reasonable agreement with the recent high-resolution NIR observations of Eisner et al. (2003), who have successfully reproduced the interferometric visibilities with uniform disk (, ), accretion disk (, ), and ring (, ) models. It is also consistent with the disk inclination of and positional angle determined by Fukagawa et al. (2004) using isophoto fitting of the Subaru coronographic NIR image. Furthermore, the observational results of Millan-Gabet et al. (1999, 2001) and Grady et al. (1999), as well as the measured low visual extinction toward this star (e.g., Roberge et al., 2001), favor to the face-on orientation of the AB Aur system ().
However, a nearly edge-on inclination angle has been derived by Mannings & Sargent (1997) from the analysis of the mid-resolution interferometric image of the AB Aur system obtained with the OVRO array in the 13CO(1-0) line. In many later studies aimed at the modeling of the AB Aur SED this value of the disk inclination has been adopted to constrain the model parameters (see, e.g., Miroshnichenko et al., 1999; Dominik et al., 2003), though Natta et al. (2001) have used a more correct value of .
5.1.2 Disk radius and mass
With determined values of the AB Aur disk inclination and positional angles, we continue our step-by-step analysis and put constraints on the size and mass of this object.
There is no such controversy in the literature regarding the size of the AB Aur disk as in the case of orientation. The resolved disk radius has been determined as - AU (Mannings & Sargent, 1997; Fukagawa et al., 2004). We use the value AU as an initial guess for the modeling (see, however, Natta et al., 2001). A disk model of that size successfully reproduces the radial gradient of the observed HCO+(1-0) intensities (see Fig. 7). In addition, we consider a smaller disk with AU and find that this model still provides a reasonable fit to the radial decline of the observed line intensities, but the width of the synthesized spectra is slightly broader than observed km s-1. To get the correct line widths, we adopt a smaller inclination angle of , which is close to the lower limit of the best-fit disk angle, . An even smaller AU disk model shows a too rapid decrease of the calculated intensities with radius and hence is not in agreement with the data.
We cannot determine an upper limit of the disk size by the same way because the gas in the outer disk regions is cold and diffuse. As shown in Sect. 4.1, the HCO+(1-0) transition is hardly excited under these conditions; moreover, the HCO+ abundances are low (see Fig. 5). As a result, the synthetic interferometric spectra almost do not change even if we take into account far-distant disk parts. Thus, as the upper limit we use the largest value of the resolved AB Aur disk, AU.
Summarizing our findings, we estimate the best-fit size of the AB Aur circumstellar disk as AU.
The best-fit disk model with AU and , which is shown in Fig. 7, has a mass (Table 3). To constrain the latter value, we rely on the fact that the absolute intensities of the calculated HCO+(1-0) spectra are sensitive to the HCO+ abundances and thus column densities in the disk due to the low optical thickness of this line:
| (4) |
Here, and are the averaged excitation temperature and HCO+ column densities at a certain radius , respectively, while the term accounts for convolution with the Gaussian beam of the radius . Using the column densities computed in Sect. 3.3.3 and disk excitation temperatures of the HCO+(1-0) line calculated in Sect. 4.1, we find that expression (4) has a global maximum at AU (with dispersion AU) independent of the considered disk model. Thus, the HCO+ line profiles are mainly determined by the local emission generated in the disk regions at . Indeed, the width of the observed spectra can be calculated by the following equation:
| (5) |
which is very close to the actual value of km s-1.
We find that for 10 times more/less massive disks the modeled HCO+(1-0) interferometric lines are 7/4.5 times more/less intense than in the case of the best-fit model with (reference model). At first glance, it seems that the value of the disk mass can be accurately determined since the intensity of the resulting spectra sensitively depends on this parameter. However, the observed HCO+(1-0) flux suffers from the calibration errors, which are . Furthermore, the distance toward AB Aur is derived with uncertainty (see Table Millimeter observations and modeling of the AB Aurigae system), and hence the flux is uncertain by additional . Thus, the intrinsic uncertainty of the observed line intensities is . Consequently, it results in a factor of uncertainty in the best-fit value of the disk mass. Nonetheless, the spread in is mostly defined by the uncertainties in those parameters of the model that strongly affect the resulting abundances of HCO+ (see discussion in Sect. 3.3.3) and thus the intensity of the synthesized spectra (expression 4).
Above all, the disk mass depends on the assumed gas-to-dust ratio because this parameter regulates the total amount of HCO+ in the disk at large radii, AU (see Fig. 5, left panel). It is found that for the ratio the simulated HCO+(1-0) interferometric lines have intensities K, which is 2.1 times lower than observed. Contrary, the model with low gas-to-dust ratio, , produces 4 times more intense lines than the observed spectra with -0.2 K. Thus, such unrealistically high variation of the gas-to-dust ratio introduces a factor of 5 uncertainty in the best-fit disk mass . Moreover, we realize that it also affects the disk inclination angle in a sense that the disk model with requires to fit the widths of the observed HCO+(1-0) line profiles, while for the case of it is , which is still within the proposed range of the disk inclination angles, . Similarly to the case of high gas-to-dust ratio , the disk model with large m grains shows times less intense spectra than the intensity of the acquired HCO+(1-0) lines. To compensate for this decrease of the modeled line intensity, the disk mass has to be increased by a factor of 5 in respect to the reference value.
The next most important parameter determining the disk mass is the factor of uncertainty of the computed HCO+ abundances. In this case, the intensities of the synthetic lines vary by a factor of -3.5 compared with the observed values K. Therefore, for the model with 2 times increased abundances of HCO+ the corresponding disk mass is only of the standard value , whereas for the case of the 2 times lowered HCO+ abundances the disk mass is 1.8 times higher than for the reference model.
The parameters of the disk model that influence the evaluation of the disk mass to a smaller extent are the size and density distribution. The uniform disk model with the radial gradient of the surface density and mass results in 1.2 times higher intensity of the modeled spectra in comparison with the observed line profiles. Consequently, the relevant disk mass constitutes of the mass of the standard model. In contrast, the model with the reduced outer radius AU produces synthetic lines of 1.5 times lower intensity than the observed value of K. In this case, the best-fit mass of the disk is higher than the reference value of .
All considered model configurations and corresponding estimates of the AB Aur disk mass are summarized in Table 6.
5.2 The single-dish data
5.2.1 Temperature of the envelope
As we have shown in Sect. 4.1, the observed single-dish CO(2-1) line is optically thick and thermalized, . Therefore, the intensity of the CO(2-1) synthetic spectrum depends on the assumed value of the envelope temperature and does not depend much on the adopted density structure. We use this fact and consider a grid of the envelope models with various kinetic temperatures within the proposed initial range of -40 K. In Fig. 11, we show the synthetic CO(2-1) line profiles calculated for three different envelope temperatures, namely, K (left panel), K (middle panel), and K (right panel). As can be clearly seen, the observed and modeled CO(2-1) line intensities are nearly the same only in the latter case, whereas for temperatures K the computed line intensities are too low. Therefore, the value of 35 K is used in further modeling. The uncertainty of the best-fit envelope temperature comes from the calibration error of the observed CO(2-1) flux and the distance uncertainty. Finally, we constrain the best-fit temperature of the inner AB Aur envelope to K.
In Fig. 12, we investigate what the relative contributions of the CO(2-1) emission generated by the disk and envelope on the resulting line profile are. The modeled disk emission shows very low intensity compared with the observed value of K, though the width of the synthetic spectrum is consistent with the observed km s-1 width (left panel). In contrast, the CO(2-1) emission from the envelope has a nearly correct intensity of K, but a too narrow width of 1 km s-1 due to low infall velocities adopted in the model, km s-1 (see middle panel in the Figure). The combination of both these models, the so-called “disk-in-envelope” model, results in the synthesized CO(2-1) profile with the correct intensity but still too narrow width at signal levels -10 K (right panel in Fig. 12). As discussed in Sect. 2.1, emission arising in moving gas clouds along the line of sight to AB Aur may contaminate the observed CO(2-1) line profile. The chemical stability of the CO molecules to dissociative UV radiation and low critical density to excite the 2-1 rotational transition support this suggestion. Recently, Roberge et al. (2001) have studied with HST and FUSE the properties of H2 and CO gases toward AB Aur. They have estimated a CO column density of cm-2, and found that the value of the CO velocity is consistent with the velocity of the star. Thus, this gas is indeed most likely associated with the nearby remnant envelope.
5.2.2 Density structure of the envelope
Using the best-fit envelope temperature K, we simulate the chemical evolution and line radiative transfer for a grid of the envelope and disk-in-envelope models with various initial densities and density profiles within the range . Then, the mass of the shadowed part of the AB Aur inner envelope can be calculated:
| (6) |
where is the shadowing angle of the envelope (see Table 4), and and are the inner and outer envelope radii, respectively.
First, the intensity of the synthetic HCO+(1-0) line is used as a criterion to determine whether the current guess of the initial envelope density (and thus the envelope mass ) is appropriate or not because the observed HCO+(1-0) emission almost entirely comes from the AB Aur envelope (see discussion in Sect. 4.1). The low optical thickness of HCO+(1-0) implies that the corresponding calculated intensity is related to the HCO+ abundances and can be easily scaled up and down by adjusting the mass of the envelope model until the observed intensity K is reached.
Second, with the updated envelope model that fits the observed HCO+(1-0) line intensity, we verify whether the radial density gradient of this model is appropriate or not by comparing the observed and modeled HCO+(3-2) to HCO+(1-0) intensity ratios as well as the line profiles of C18O(2-1), CS(2-1), and CS(5-4). The radial gradient of the infall velocity is calculated from the value of the density gradient as , while the initial infall velocity is determined from the observed line widths, km s-1.
Iterating these two steps of the modeling about 15 times, the final best-fit model of the AB Aur inner envelope is obtained with the radial density profile and thus infall velocity law km s-1, initial density g cm-3 ( cm-3), and mass (see Table 4).
The corresponding synthetic spectra are compared with the observed line profiles in Fig. 13. As can be clearly seen, intensities and widths of the synthesized and observed HCO+(1-0), C18O(2-1), and CS(2-1) lines are perfectly matched in the case of the envelope (middle panels) and disk-in-envelope (right panels) models, whereas the contribution from the disk in the resulting spectra is negligible (left panels). In contrast, the observed HCO+(3-2) emission comes partly from the AB Aur disk and partly from the surrounding envelope, therefore a reasonable fit to this line is only produced by the full disk-in-envelope model (see second row of plots in the Figure). Particularly, the broad km s-1 width of the observed HCO+(3-2) spectrum is not possible to explain without accounting for the emission from the AB Aur disk. Still, the synthetic HCO+(3-2) spectrum peaks at about 1 km s-1 higher velocity than the observed emission from the AB Aur envelope, which cannot be explained in the framework of the applied model.
The uncertainties of the derived parameters are estimated as follows. We adopt a factor of 7 uncertainties for the best-fit value of the envelope mass and initial density at the inner envelope edge based on the results of a similar investigation performed for the AB Aur disk model (see extensive discussion in the previous section). The uncertainty of the determined radial density profile is found to be . This is because an envelope model with show and 3 times lower intensities of the synthetic C18O(2-1) and CS(2-1) lines than the observed values of K and 0.11 K, respectively. For a model with , the intensity of the calculated HCO+(3-2) spectrum is about 1.5 times higher than the observed value K.
Note that in framework of the adopted model of the AB Aur system it is not possible to fit the observed CS(5-4) line profile since the intensity of the synthesized CS(5-4) spectrum is essentially zero. This line is excited at high densities, - cm-3, which are reached only in inner dense disk regions at AU (see Fig. 4, right panel). Therefore, the intensity of the modeled CS(5-4) line becomes very low after the convolution with the ( AU) IRAM beam. Consequently, a necessary requirement for a model of the AB Aur system to reproduce the observed CS(5-4) line intensity would be the presence of high-density media (clumps?) at -200 AU distance from the central star.
We find that the intensity, width, and profile of CS(5-4) can be reproduced very well with a 5 times more massive model of the AB Aur envelope than the best-fit one. However, in this case all other modeled single-dish lines are differ substantially from the observed spectra. Therefore, we try to match all single-dish data simultaneously with a clumpy envelope model. Surprisingly, it is possible only in one case: clumps that homogeneously fill of the entire IRAM CS(5-4) beam, and which are about 150 times denser than surrounding medium, cm-3. The total mass of these clumps is approximately equal to the mass of the best-fit envelope model, , and consequently the mass of the clumpy envelope model is twice that of the reference best-fit model. The applicability of this clumpy envelope model cannot be proved with the adopted 2D approach and requires full 3D treatment, which is beyond the scope of the present paper.
The density distribution and mass of the best-fit model of the AB Aur envelope are consistent with the values derived by Elia et al. (2004) from the modeling of the SED: , g cm-3 at AU, and within of about . There is almost no difference between initial densities for both models, the radial density profiles are also similar, but the envelope masses differ by a factor of 5. This is because we focus on the shadowed part of the inner envelope part that contains only of the volume of the full sphere. If one takes into account of the total envelope mass determined by Elia et al., the resulting value is , which is close to the mass of our best-fit model.
Similarly, Fuente et al. (2002) have estimated the mass of the AB Aur envelope within 0.08 pc as and obtained a density profile of . These values can be translated to the initial density at AU and mass of the shielded inner part of the envelope: g cm-3 and for and g cm-3 and for , respectively. The mass and initial density of our best-fit envelope model ( g cm-3 and ) are close to the values of Fuente et al. for the case of , while the steeper density gradient requires about a 10 times more massive envelope model to match the AB Aur SED.
Finally, Miroshnichenko et al. (1999) have found by the modeling of the AB Aur SED with a disk-in-envelope model the total mass of the envelope to be . Again, it can be translated to the value of for the inner shadowed part, which is times lower than in our case. Such a low value of the envelope mass is due to the uniform density distribution () at AU they have used in the calculations.
Since we focus on the shadowed and inner region of the AB Aur envelope, it is difficult to calculate accurately the total mass of the envelope with our model. The mass of two unshielded lobes can be roughly estimated from the value of the observed extinction toward AB Aur, mag. For our best-fit model of the shadowed part, the visual extinction is maximal in radial direction, mag, which is about 5 times higher than for the unshielded region. If one assumes that this difference stems entirely from the density contrast between the shadowed and unshielded envelope parts and their radial density profiles and dust grain properties are the same, than the total envelope mass between 400 AU and 2 200 AU is
| (7) |
where is the shadowing angle, mag, mag, and . According to this Equation, the total mass of the AB Aur inner envelope for the model discussed here is . Moreover, assuming that the best-fit density profile of the inner envelope model is also appropriate at larger distances until the cloud outer border at 35 000 AU, we calculate the mass of the entire AB Aur envelope, , which is exactly the value measured by Fuente et al. (2002).
The parameters of the density structure and mass of the envelope models considered above are summarized in Table Millimeter observations and modeling of the AB Aurigae system.
5.3 Evolutionary status of the AB Aur system
In this Section, we discuss the evolutionary nature of the AB Aur system, using the results of our modeling.
With the reconstructed best-fit velocity profile of the AB Aur envelope (see Table 4), one can estimate independently the mass accretion rate in this system:
| (8) |
where g cm-3 is the initial density at the disk outer edge AU and is the shadowing angle. According to this expression, the mass accretion rate from the AB Aur envelope onto the disk is yr-1. This value is very close to the measured mass accretion to the central star, yr-1 (see, e.g., Grady et al., 1996).
If one assumes that the mass accretion rate is due to the viscous evolution of the disk only, then dispersal timescale for the AB Aur disk is Myr, which is too short in comparison with the Myr age of AB Aur. Thus, accretion from the envelope should play a major role in the evolution of the AB Aur system as a whole. The lifetime of the entire AU envelope can be roughly estimated from the same principles, yr-1, which gives evolutionary timescale of about Myr. Therefore, we conclude that the AB Aur system will remain a Class II object for the next few million years.
The estimated timescale for dispersal of the AB Aur envelope is in sharp contrast to the free-fall time from the envelope outer edge at 35 000 AU on the central star, Myr. Thus, contraction of the envelope is not free-fall and regulated by additional force(s) acting against gravitation, like thermal pressure, rotation, turbulence, or magnetic field.
The suggestion that the AB Aur envelope fully rotates can be essentially ruled out given the fact that the widths of the observed single-dish lines are narrow, km s-1. Indeed, it is found that the model with only of the Keplerian rotation representing the regular velocity field in the envelope produces wider synthetic single-dish lines than observed. On the other hand, conservation and redistribution of initial angular momentum of the natal cloud out of which the AB Aur system has been formed should end up in a rotating flattened configuration (see, e.g., Larson, 2003, and references therein). Thus, it explains why the AB Aur envelope is flattened and suggests that the envelope slowly rotates, km s-1, in addition to the infall.
Furthermore, by fitting the line widths with various microturbulent velocities, we find that turbulence in the envelope should be low, km s-1, which is smaller than the sound speed, km s-1. Therefore, these subsonic turbulent motions cannot retard the cloud collapse. Also, the AB Aur envelope cannot be supported against the gravitational contraction by thermal pressure either since it is not spherically symmetric, and rather cold, K. Finally, magnetic pressure can slow down the collapse, but only if the envelope matter is well coupled to the magnetic field. The computed ionization fraction for the best-fit AB Aur envelope is about - and thus the latter requirement is fulfilled.
Therefore, we conclude that slow rotation and magnetic pressure play a major role in the dynamical evolution of the AB Aur envelope by regulating the speed of the collapse. In turn, it defines the accretion rate onto the disk and thus its mass and consequently the lifetime of the entire AB Aur system, Myr. Also, these two dynamical factors are responsible for the flattened appearance of the envelope. Note that the presence of such asymmetric structures around protoplanetary disks has been predicted by modern theories of star formation (e.g., Larson, 2003) and inferred from observations (e.g., Hogerheijde, 2003). In a more general sense, our findings support the idea of Armitage et al. (2003), who have argued that the observed disk lifetimes between 1 and 10 Myr are mostly determined by the initial mass available for the accretion, but not by the mass of the central star(s).
The instantaneous infall of the envelope matter onto the rotationally supported disk should produce an accretion shock interface, and likely local density enhancement(s) at the disk outer edge (Velusamy et al., 2002). Then it is natural to ask whether these disk regions remain stable or not. The gravitational instability in rotating disklike configurations is suppressed when the so-called Toomre parameter exceeds about unity (see discussion in Larson, 2003):
| (9) |
where is the sound speed, is the epicyclical velocity at the radius , is gravitational constant, and being the disk surface density.
Applying this equation to three considered disk models that fit the observations, namely, the uniform disk (), minimum-mass solar nebula (), and reference model (), we find that the corresponding -factors at the disk outer boundary AU are 0.57, 22, and 300, respectively. It is likely that these values are smaller because of the local density enhancement at the disk outer edge due to the mass flow from the envelope. Thus, continuous mass feeding of the AB Aur disk from the surrounding envelope may make it gravitationally unstable. Consequently, the disk will develop prominent spiral arms trailing around through which the matter from the outer edge will be rapidly transported inward, to the disk inner regions (Larson, 2003).
In Sections 5.1 and 5.2.2 we have claimed that presence of local high-density (clump-like) structures in the AB Aur system is a necessary requirement to explain the peculiar shape of the HCO+(1-0) profiles in a region of the PdBI map and the high ratio of the single-dish IRAM CS(5-4) and CS(2-1) spectra. This suggestion is supported by the near-infrared Subaru observations of Fukagawa et al. (2004) that reveal the presence of a few spiral arms, a knotty structure, a dark lane, and underlying circular inhomogeneous structure in the AB Aur system at AU (see Fig. 3 therein). They have also found that these arms are trailing and concluded from similar arguments that we caught the gravitational instability at work in a protoplanetary disk. Note that spiral density waves can also be produced by tidal interactions between the disk matter and hidden low-mass (planetary) companion(s). However, Fukagawa et al. have ruled out such a possibility because otherwise a companion would have been detected. It is worth to mention here that recently Fromang et al. (2004) have simulated the evolution of magnetized self-gravitating disks in 2D and 3D that show amazingly similar spiral structure as has been observed by Fukagawa et al. (2004) (compare Figures 5 and 3 there, respectively).
The continuous replenishment of the AB Aur disk matter by “fresh” material from the envelope via inward accretion by the spiral arms provides a natural explanation for the observational fact that the bulk of dust grains in the disk are pristine and closely resemble the ISM dust particles (see Bouwman et al., 2001; Meeus et al., 2001). Actually, it can also be true for some other Herbig Ae/Be systems as well. Though this hypothesis should be carefully verified by future observations and modeling, it can explain why some Herbig systems do not show significant grain evolution after several million years of the evolution, while other do.
6 Summary and conclusions
We observed the AB Aur system at millimeter wavelengths and studied its chemical composition with the IRAM 30-m antenna and Plateau de Bure array during 2000-2002. Overall, nine different molecular species in a dozen rotational transitions were detected at low resolutions (-) using the IRAM telescope: CO, C18O, CS, HCO+, DCO+, H2CO, HCN, HNC, and SiO. From the measured negative intensity of the DCO+(2-1) line, we found strong evidence that the AB Aur envelope extends up to at least AU from the star. In contrast, with PdBI we detected only the HCO+(1-0) emission from the AB Aur disk at the modest resolution. The symmetric “butterfly” (two-lobe) appearance of the intensity-weighted velocity map is indicative of a rotating ( AU) disk that is seen close to face-on with a positional angle of . To account for these observational data, we used for the first time a coherent modeling of the disk and envelope physical structure, chemical evolution, and radiative transfer in molecular lines.
First, we modeled the AB Aur disk by the 2D flared passive disk model with vertical temperature gradient and Keplerian rotation, using the 2D continuum radiative transfer code and observational facts and theoretical constraints from the literature. To represent the AB Aur envelope, we adopted the infalling isothermal spherical cloud model with a central region shadowed by the disk and two wide cones transparent to the stellar radiation. Second, for both the disk and envelope models, time-dependent abundances and column densities of observationally important molecules were calculated for 3 Myr of the evolution with the gas-grain UMIST 95 chemical network supplied by dust surface reactions, reactions of deuterium fractionation, and CO and H2 shielding. After that, the calculated abundances of HCO+, CO, C18O, and CS molecules were translated to the excitation temperatures of the CO(2-1), C18O(2-1), HCO+(1-0), HCO+(3-2), CS(2-1), and CS(5-4) transitions by mean of the 2D non-LTE line radiative transfer code. Finally, with the same code we synthesized the beam-convolved HCO+(1-0) interferometric map and single-dish CO(2-1), C18O(2-1), HCO+(1-0), HCO+(3-2), CS(2-1), and CS(5-4) lines and compared them directly with the observational data. Iterating this modeling scheme about 30 times (each run took days on a Pentium IV 2.4GHz PC), we constrained the parameters of the AB Aur system and their uncertainties by varying the model configurations in a robust step-by-step way.
Overall success of such an advanced and complicated theoretical approach to explain the observational data is surprising. The best-fit disk model reproduces the intensities, widths, and profiles of the observed HCO+(1-0) spectra on the entire interferometric map apart from one corner. There the line profiles show a fake absorption-emission shape that resembles the inverse P Cygni profile. We suggested that this can be indirect evidence for a local inhomogeneity (density enhancement) of the nearby envelope at AU.
The constrained parameters of the AB Aur disk are the following. The AB Aur disk is in Keplerian rotation and inclined by , whereas its position angle is . The uncertainties of the derived inclination angle are mainly caused by the uncertainty of the adopted stellar mass and spread in the radial gradient of the disk surface density. The radius of the disk is AU and its mass is with a factor of uncertainty. The uncertainty of the constrained mass is mainly caused by possible variations of the gas-to-dust mass ratio and the size of dust grains in this object.
The best-fit model of the AB Aur disk and inner shadowed part of the envelope (disk-in-envelope model) successfully reproduces the intensities, widths, and profiles of the single-dish CO(2-1), C18O(2-1), HCO+(1-0), HCO+(3-2), and CS(2-1) spectra with the exception of the CS(5-4) data, which can be fitted only by the model with clumps that have a characteristic density of about cm-3 and homogeneously fill in of the full IRAM beam in the CS(5-4) transition. We found that the large km s-1 width of the observed CO(2-1) emission cannot be explained by this model alone and is likely due to contamination by moving gas clouds along the line of sight to AB Aur. The best-fit envelope model has a mean temperature of about K, power-law density distribution with the initial density of g cm-3 at AU, mass of the shielded region within AU, , and total mass of about (the latter three quantities are uncertain by a factor of ). Here, the K uncertainty of the average envelope temperature is due to the -15 calibration errors in the observed CO(2-1) flux and a uncertainty in the distance to AB Aur.
The estimated parameters of the AB Aur disk and envelope are in reasonable agreement with other studies performed so far. Furthermore, the applied step-by-step theoretical approach allowed to account for various observed interferometric and single-dish molecular spectra of AB Aur simultaneously. We conclude that a comprehensive theoretical modeling of the observed interferometric maps obtained even with modest resolution offers an unique possibility to constrain the masses, sizes, orientation, and dynamical structure of young protoplanetary disks in an independent way. The same approach applied to single-dish spectra is capable in determining average temperature, density, and kinematical structures of the surrounding envelopes.
Moreover, our best-fit model predicts that the yr-1 mass accretion to be in the AB Aur system is regulated by steady contraction of the envelope that is only partly supported by rotation and magnetic field acting against gravitation. It also gives a rough estimate of the timescale for dispersal of the entire system, Myr. We argue that the continuous mass supply from the infalling envelope onto rotating disk produces gravitational instabilities, resulting in a spiral disk structure, similar to that recently observed by Fukagawa et al. (2004) and simulated with a 3D MHD code by Fromang et al. (2004). We conclude that the continuous replenishment of the AB Aur disk matter by the material from the surrounding envelope provides a straightforward explanation to the observational fact that most of the disk grains are pristine and resemble ISM dust particles even after several Myr of the evolution, which can also be true for other Herbig Ae/Be systems.
References
- Aikawa & Herbst (1999) Aikawa, Y., & Herbst, E. 1999, ApJ, 526, 314
- Aikawa et al. (2002) Aikawa, Y., van Zadelhoff, G.–J., van Dishoeck, E.F., & Herbst, E. 2002, A&A, 386, 622
- Apai et al. (2004) Apai, D., Pascucci, I., Brandner, W., Henning, Th., Lenzen, R., Potter, D.E., Lagrange, A.–M., Rousset, G. 2004, A&A, 415, 671
- Armitage et al. (2003) Armitage, P.J., Clarke, C.J., & Palla, F. 2003, MNRAS, 342, 1139
- Bacmann et al. (2003) Bacmann, A., Lefloch, B., Ceccarelli, C., Steinacker, J., Castets, A., & Loinard, L. 2003, ApJ, 585, 55
- Beckwith, Henning, & Nakagawa (2000) Beckwith, S., Henning, Th., & Nakagawa, Y. 2000, in Protostars and Planets IV, ed. V. Mannings, A.P. Boss, & S.S. Russell (Tucson: Univ. Arizona Press), 533
- Bergin, Neufeld, & Melnick (1999) Bergin, E.A., Neufeld, D.A., & Melnick, G.J. 1999, ApJ, 510, L145
- Bergin et al. (2003) Bergin, E., Calvet, N., D’Alessio, P. & Herczeg, G.J. 2003, ApJ, 591, L159
- Bouwman et al. (2001) Bouwman, J., Meeus, G., de Koter, A., Hony, S., Dominik, C., & Waters, L.B.F.M. 2001, A&A, 375, 950
- Brittain et al. (2003) Brittain, S.D., Rettig, T.W., Simon, Th., Kulesa, C., DiSanti, M.A., & Dello Russo, N. 2003, ApJ, 588, 535
- Dalgarno & Stephens (1970) Dalgarno, A., & Stephens, T. 1970, ApJ, 160, L170
- Dartois, Dutrey, & Guilloteau (2003) Dartois, E., Dutrey, A., & Guilloteau, S. 2003, A&A, 399, 773
- DeWarf et al. (2003) DeWarf, L., Sepinsky, J.F., Guinan, E.F., Ribas, I., & Nadalin, I. 2003, ApJ, 590, 357
- Di Francesco et al. (1998) Di Francesco, J., Evans, N.J. II, Harvey, P.M., Mundy, L.G., & Butner, H.M. 1998, ApJ, 509, 324
- Dominik et al. (2003) Dominik, C., Dullemond, C.P., Waters, L.B.F.M., & Walch, S. 2003, A&A, 398, 607
- Draine (1978) Draine, B.T. 1978 ApJS, 36, 595
- Draine & Lee (1984) Draine, B.T., & Lee, H. 1984, ApJ, 285, 89
- Draine & Bertoldi (1996) Draine, B.T., & Bertoldi, F. 1996, ApJ, 468, 269
- Dutrey, Guilloteau, & Guelin (1997) Dutrey, A., Guilloteau, S., & Guelin, M. 1997, A&A, 317, 55
- Dullemond & Dominik (2004) Dullemond, C., & Dominik, C. 2004, A&A, 417, 159
- Eisner et al. (2003) Eisner, J.A., Lane, B.F., Akeson, R.L., Hillenbrand, L.A., & Sargent, A.I. 2003, ApJ, 588, 360
- Elia et al. (2004) Elia, D., Strafella, F., Campeggio, L., Giannini, T., Lorenzetti, D., Nisini, B., & Pezzuto, S. 2004, ApJ, 601, 1000
- Flower (1985) Flower, D.R., & Launay, J.M. 1985, MNRAS, 214, 271
- Fromang et al. (2004) Fromang, S., Terquem, C., Balbus, S.A., & De Villiers, J.–P. (astro-ph/0402373)
- Fuente et al. (2002) Fuente, A., Martìn-Pintado, J., Bachiller, R., Rodrìguez-Franco, A., & Palla, F. 2002, A&A, 387, 977
- Fukagawa et al. (2004) Fukagawa, M., et al. 2004, ApJ, 605, L53
- Gail (1998) Gail, H.–P. 1998, A&A, 332, 1099
- Grady et al. (1996) Grady, C.A., et al. 1996, A&AS, 120, 157
- Grady et al. (1999) Grady, C.A., Woodgate, B., Bruhweiler, F.C., Boggers, A., Plait, Ph., Lindler, D.J., Clampin, M., & Kalas, P. 1999, ApJ, 523, L151
- Green (1975) Green, S. 1975, ApJ, 201, 366
- Green & Chapman (1978) Green, S., & Chapman, S. 1978, ApJS, 37, 169
- Grinin & Rostopchina (1996) Grinin, V., & Rostopchina, A. 1996, Astronomy Reports, 40, 171
- Guilloteau & Dutrey (1998) Guilloteau, S., & Dutrey, A. 1998, A&A, 339, 467
- Hasegawa, Herbst, & Leung (1992) Hasegawa, T.I., Herbst, E., & Leung, C.M. 1992, ApJS, 82, 167
- Hasegawa & Herbst (1993) Hasegawa, T.I., & Herbst, E. 1993, MNRAS, 263, 589
- Hogerheijde & van der Tak (2000) Hogerheijde, M.R., & van der Tak, F.F.S. 2000, A&A, 362, 697
- Hogerheijde (2001) Hogerheijde, M.R. 2001, ApJ, 553, 618
- Hogerheijde (2003) Hogerheijde, M.R. 2003, in ASP Conf. Ser. 221, Star Formation at High Angular Resolution, ed. R. Jayawardhana, M.G. Burton, & T.L. Bourke (San Francisco: ASP), 1
- Ilgner et al. (2004) Ilgner, M., Henning, Th., Markwick, A., & Millar, T. 2004, A&A, 415, 643
- Kawabe et al. (1993) Kawabe, R., Ishiguro, M., Omodaka, T., Kitamura, Y., & Miyama, S.M. 1993, ApJ, 404, L63
- Kurucz (1993) Kurucz, R. 1993, ATLAS9 Stellar Atmosphere Programs and 2 km/s grid. Kurucz CD-ROM No. 13. Cambridge, Mass.: Smithsonian Astrophysical Observatory.
- Larson (2003) Larson, R.B. 2003, Rept. Prog. Phys. 66, 1651 (astro-ph/0306595)
- Lee et al. (1996) Lee H.–H., Herbst, E., Pineau des Forêts, G., Roueff, E., & Le Bourlot, J. 1996, A&A, 311, 690
- Leung & Liszt (1976) Leung, C.M., & Liszt, H. 1976, ApJ, 208, 732
- Liszt & Leung (1977) Liszt, H., & Leung, C.M. 1977, ApJ, 218, 396
- Mannings & Emerson (1994) Mannings, V., & Emerson, J.P. 1994, MNRAS, 267, 361
- Mannings & Sargent (1997) Mannings, V., & Sargent, A. 1997, ApJ, 490, 792
- Marcy & Butler (2000) Marcy, G.W., & Butler, R.P. 2000, PASP, 112, 137
- Markwick et al. (2002) Markwick, A., Ilgner, M., Millar, T., Henning, Th. 2002, A&A, 385, 632
- Marsh et al. (1995) Marsh, K.A., Van Cleve, J.E., Mahoney, M.J., Hayward, T.L., & Houck, J.R. 1995, ApJ, 451, 777
- Meeus et al. (2001) Meeus, G., Waters, L.B.F.M., Bouwman, J., van den Ancker, M.E., Waelkens, C., & Malfait, K. 2001, A&A, 365, 476
- Millan-Gabet et al. (1999) Millan-Gabet, R., Schloerb, F.P., Traub, W.A., Malbet, F., Berger, J.P., & Bregman, J.D. 1999, ApJ, 513, L131
- Millan-Gabet et al. (2001) Millan-Gabet, R., Schloerb, F.P., & Traub, W.A. 2001, ApJ, 546, 358
- Millar et al. (1997) Millar, T.J., Farquhar, P.R.A., & Willacy, K. 1997, A&AS, 121, 139
- Miroshnichenko et al. (1999) Miroshnichenko, A., Ivezić, Ž., Vinković, D., Elitzur, M. 1999, ApJ, 520, L115
- Monteiro (1985) Monteiro, T. S. 1985, MNRAS, 214, 419
- Nakajima & Golimowski (1995) Nakajima, T., & Golimowski, D.A. 1995, AJ, 109, 1181
- Natta et al. (2001) Natta, A., Prusti, T., Neri, R., Wooden, D., Grinin, V.P., & Mannings, V. 2001, A&A, 371, 186
- Padgett et al. (1999) Padgett, D.L., Brandner, W., Stapelfeldt, K.R., Strom, S.E., Terebey, S., & Koerner, D. 1999, AJ, 117, 1490
- Pavlyuchenkov & Shustov (2004) Pavlyuchenkov, Ya.N., Shustov, B.M. 2004, Astron. Reports, 48, 315
- Piskunov et al. (1997) Piskunov, N., Wood, B.E., Linsky, J.L., Dempsey, R.C., Ayres, Th.R. 1997, ApJ, 474, 315
- Qi et al. (2004) Qi, C. et al. 2004, ApJ, in press (astro-ph/0403412)
- Roberge et al. (2001) Roberge, A. et al. 2001, ApJ, 551, L97
- Rybicki & Hummer (1991) Rybicki, G.B., & Hummer, D.G. 1991, A&A, 245, 171
- Semenov, Wiebe, & Henning (2004) Semenov, D., Wiebe, D., Henning, Th. 2004, A&A, 417, 93 (Paper I)
- Semenov et al. (2004) Semenov, D., Pavlyuchenkov, Ya., Henning, Th., Herbst, E., & van Dishoeck, E. 2004, in Baltic Astronomy XIII, ed. V. Straizys, J. Eislöffel, & M. Kun, 454
- Simon, Dutrey, & Guilloteau (2000) Simon, M., Dutrey, A., & Guilloteau, S. 2000, ApJ, 545, 1034
- Smith, Herbst, & Chang (2004) Smith, I.W.M., Herbst, E., & Chang, Q. 2004, MNRAS, 350, 323
- Telesco & Knacke (1991) Telesco, C.M., & Knacke, R.F. 1991, ApJ, 372, 29
- Thé, de Winter, & Pérez (1994) Thé, P., de Winter, D., Pérez, M. 1994, A&AS, 104, 315
- Thi et al. (2001) Thi, W.–F., et al. 2001, ApJ, 561, 1074
- van den Ancker et al. (1997) van den Ancker, M.E., Thé, P., Tjin A Djin, H.R.E., Catala C., de Winter, D., Blondel, P.F.C., & Waters, L.B.F.M. 1997, A&A, 324, L33
- van den Ancker, de Winter, & Tjin A Djin (1998) van den Ancker, M.E., de Winter, D., & Tjin A Djin, H.R.E. 1998, A&A, 330, 145
- van den Ancker et al. (2000) van den Ancker, M.E., Bouwman, J., Wesselius, P.R., Waters, L.B.F.M., Dougherty, S.M., & van Dishoeck, E.F. 2000, A&A, 357, 325
- van Dishoeck (1988) van Dishoeck, E.F. 1988, in Rate Coefficients in Astronomy, ed. T.J. Millar & D.A. Williams (Kluwer Academic Publishers), 49
- van Dishoeck & Blake (1998) van Dishoeck, E.F. & Blake, G.A. 1998, ARA&A, 36, 317
- van Zadelhoff et al. (2001) van Zadelhoff, G.–J., van Dishoeck, E.F., Thi, W.–F., Blake, G.A. 2001, A&A, 377, 566
- van Zadelhoff et al. (2003) van Zadelhoff, G.–J., Aikawa, Y., Hogerheijde, M.R., & van Dishoeck, E.F. 2003, A&A, 397, 789
- Vasyunin et al. (2004) Vasyunin, A.I., Sobolev, A.M., Wiebe, D.Z., & Semenov, D.A. 2004, Astron. Lett., 30, 566
- Velusamy et al. (2002) Velusamy, T., Langer, W. D., & Goldsmith, P. F. 2002, ApJ, 565, L43
- Vinković et al. (2003) Vinković, D., Ivezić, Ž., Miroshnichenko, A., & Elitzur, M. 2003, MNRAS, 346, 1151
- Wahhaj et al. (2003) Wahhaj, Z., Koerner, D.W., Ressler, M.E., Werner, M.W., Backman, D.E., & Sargent, A.I. 2003, ApJ, 584, L27
- Wheelock et al. (1991) Wheelock, S., et al. 1991, BAAS, 23, 908
- Wiebe, Semenov, & Henning (2003) Wiebe, D., Semenov, D., & Henning, Th. 2003, A&A, 399, 197
- Willacy et al. (1998) Willacy, K., Klahr, H.H., Millar, T.J., & Henning, Th. 1998, A&A, 338, 995
- Willacy & Langer (2000) Willacy, K., & Langer, W. 2000, A&A, 397, 789
- Wilner et al. (2002) Wilner, D.J., Holman, M.J., Kuchner, M.J., & Ho, P.T.P. 2002, ApJ, 569, 115
- Wilson & Rood (1994) Wilson, T.L., & Rood, R. 1994, ARA&A, 32, 191
- Umebayashi & Nakano (1981) Umebayashi, T., & Nakano, T. 1981, PASJ, 33, 617
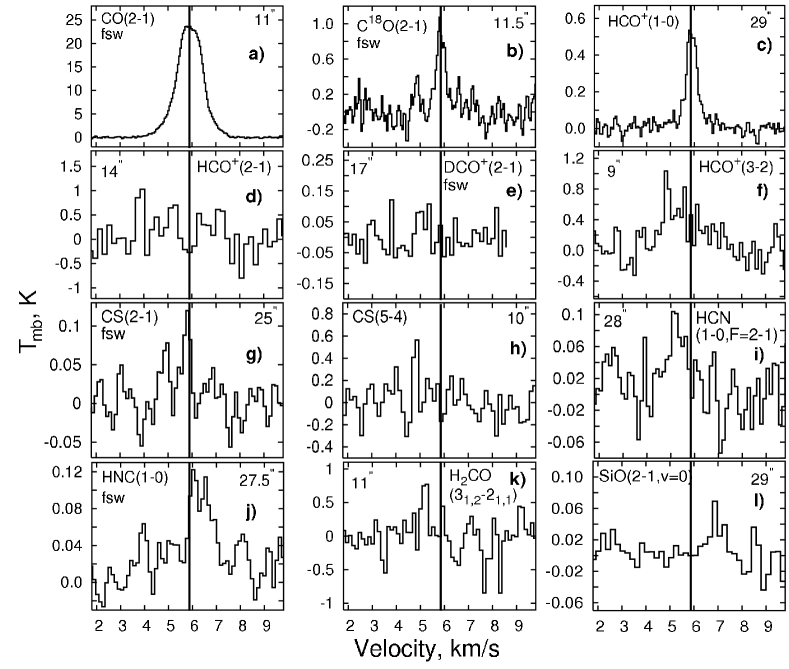
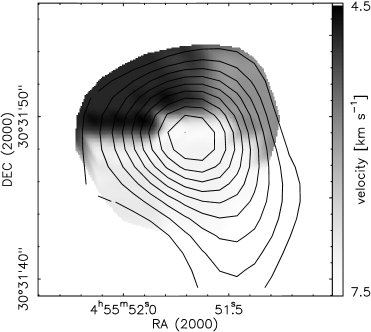
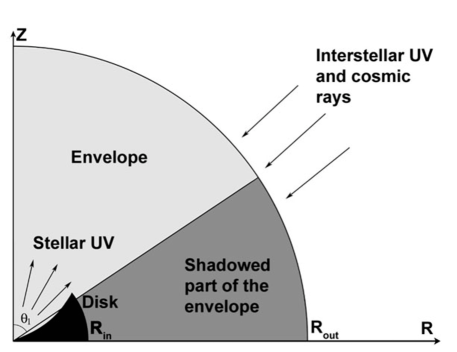
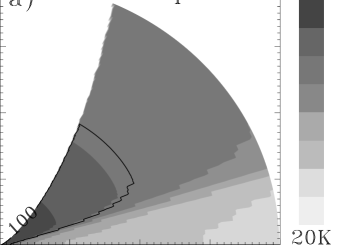
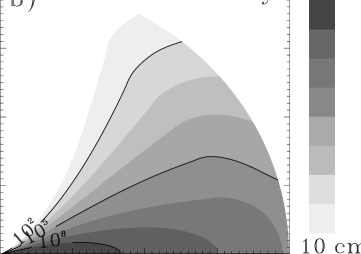
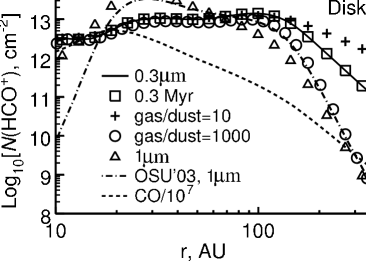
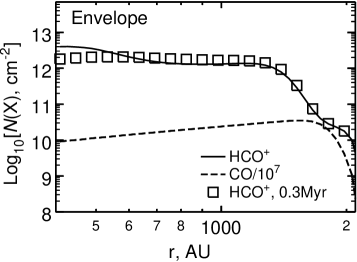
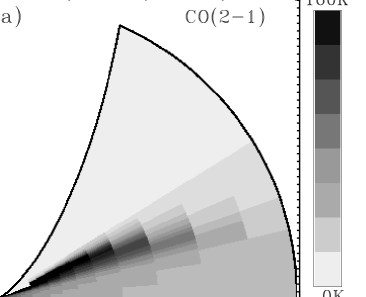
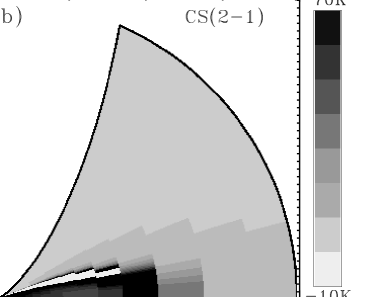
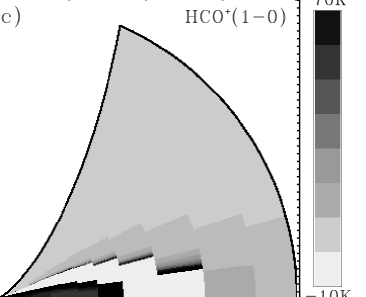
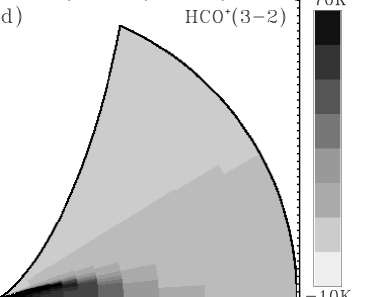


| Molecule | Transition | rms | Vlsr | dv | Beamsize | |||||
|---|---|---|---|---|---|---|---|---|---|---|
| (=) | (MHz) | (K) | (K) | (km s-1) | (km s-1) | (K km s-1) | (km s-1) | () | ||
| CO | 230538.0 | 25.2 | 0.176 | 1.2 | 5.9 | 32.5 | 0.051 | 0.53 | 10.8 | |
| C18O | 219560.3 | 0.84 | 0.135 | 0.4 | 5.9 | 0.33 | 0.053 | 0.55 | 11.4 | |
| CS | 97981.0 | 0.116 | 0.030 | 0.4 | 5.8 | 0.045 | 0.120 | 0.76 | 25.2 | |
| 244935.1 | 0.44 | 0.158 | 0.20 | 4.8 | 0.136 | 0.048 | 0.5 | 10.0 | ||
| 244935.1 | 0.73 | 0.190 | 0.17 | 4.7 | 0.136 | 0.048 | 0.5 | 10.05 | ||
| HCO+ | 89188.5 | 0.54 | 0.029 | 0.54 | 5.9 | 0.310 | 0.066 | 0.78 | 29.0 | |
| 178375.0 | 1.41 | 0.417 | 0.27 | 3.7 | 0.404 | 0.066 | 0.65 | 14.0 | ||
| 267557.6 | 1.16 | 0.269 | 0.26 | 4.8 | 0.315 | 0.044 | 0.45 | 9.3 | ||
| DCO+ | 144077.3 | 0.22 | 0.077 | 0.17 | 5.6 | 0.040 | 0.081 | 0.69 | 17.1 | |
| 144077.3 | 0.033 | 0.17 | 6.2 | 0.081 | 0.69 | 17.1 | ||||
| HCN | , F | 88633.9 | 0.117 | 0.025 | 0.65 | 9.9 | 0.080 | 0.132 | 0.78 | 28.2 |
| , F | 88631.8 | 0.201 | 0.025 | 0.77 | 5.1 | 0.165 | 0.132 | 0.78 | 28.2 | |
| HNC | 90663.6 | 0.113 | 0.020 | 1.29 | 6.3 | 0.155 | 0.129 | 0.77 | 27.6 | |
| SiO | , v | 86847.0 | 0.091 | 0.027 | 0.19 | 7.0 | 0.019 | 0.067 | 0.78 | 29.0 |
| H2CO | 140839.5 | 0.234 | 0.089 | 0.25 | 6.0 | 0.063 | 0.083 | 0.70 | 17.5 | |
| 225697.8 | 0.899 | 0.232 | 0.27 | 5.2 | 0.264 | 0.133 | 0.54 | 11.0 |
Note. — The Col. (2) lists observed transitions at the rest frequencies from Col. (3). The intensities, noise, and FWHMs of detected lines are presented in Col. (4)–(6), while in Col. (7) the line velocity shifts are specified. The corresponding integrated intensities and achieved spectral resolutions are listed in Col. (8) and Col. (9). Finally, in Col. (10)–(11) the beam efficiencies and sizes are given.
| Parameter | Symbol | Value | Reference |
|---|---|---|---|
| Distance | pc | 1 | |
| Temperature | K | 2 | |
| Radius | 3 | ||
| Mass | 2 | ||
| UV flux at 100 AU | 4 |
References. — (1) van den Ancker et al. 1997; (2) van den Ancker et al. 1998; (3) van den Ancker et al. 2000; (4) this work
| Parameter | Symbol | Value |
|---|---|---|
| Inner radius | 0.7 AU | |
| Outer radius | AU | |
| Temperature | 30-1 500K | |
| Surface density at 1 AU | g cm-2 ( factor of ) | |
| Surface density profile | ||
| Mass | ( factor of ) | |
| Grain radius | m | |
| Gas-to-dust mass ratio | 100 |
| Parameter | Symbol | Value |
|---|---|---|
| Inner radius | AU | |
| Outer radius | AUa | |
| Shadowing angle | ||
| Temperature | K | |
| Density at 400 AU | g cm-3 ( factor of ) | |
| Density profile | ||
| Mass | ( factor of ) | |
| Grain radius | 0.1 m | |
| Gas-to-dust mass ratio | 100 |
| Parameter | Symbol | Value |
|---|---|---|
| Resolution of the numerical grid: | … | |
| 1) Disk model | … | |
| 2) Envelope model | … | |
| 3) Disk-in-envelope model | … | |
| Error in the level populations | … | |
| System velocity | km s-1 | |
| Microturbulent velocity | km s-1 | |
| Disk regular velocity | km s-1 | |
| Envelope regular velocity | km s-1 | |
| Background temperature | 2.73 K | |
| Spectral resolution | 0.04 km s-1 | |
| Inclination angle | ||
| Positional angle | ||
| PdBI HPBW beam | … | |
| IRAM HPBW beam | … | - |
| Parameter | Symbol | Value | Disk massa |
|---|---|---|---|
| Gas-to-dust ratio | 10 | 0.2 | |
| Gas-to-dust ratio | 1000 | 5.0 | |
| Grain radius | m | 5.0 | |
| HCO+ intensities | K | 0.3 | |
| HCO+ intensities | K | 2.1 | |
| HCO+ abundances | … | 2 of standard | 0.21 |
| HCO+ abundances | … | 0.5 of standard | 1.8 |
| Surface density profile | 0 | 0.7 | |
| Outer radius | 400 AU | 1.5 |
| Study | Initial density at | Density | Massa | Total mass |
|---|---|---|---|---|
| 400 AU, g cm-3 | profile | |||
| 1 | 0 | |||
| 2 | -1 | |||
| 3 | -1 | |||
| 4 | -1.4 | |||
| 3 | -2 |
References. — (1) Miroshnichenko et al. 1999; (2) This work; (3) Fuente et al. 2002; (4) Elia et al. 2004