Mass-to-light ratio gradients in early-type galaxy haloes
Abstract
Since the near future should see a rapidly expanding set of probes of the halo masses of individual early-type galaxies, we introduce a convenient parameter for characterising the halo masses from both observational and theoretical results: , the logarithmic radial gradient of the mass-to-light ratio. Using halo density profiles from CDM simulations, we derive predictions for this gradient for various galaxy luminosities and star formation efficiencies . As a pilot study, we assemble the available data from kinematics in early-type galaxies—representing the first unbiassed study of halo masses in a wide range of early-type galaxy luminosities—and find a correlation between luminosity and , such that the brightest galaxies appear the most dark-matter dominated. We find that the gradients in most of the brightest galaxies may fit in well with the CDM predictions, but that there is also a population of fainter galaxies whose gradients are so low as to imply an unreasonably high star formation efficiency . This difficulty is eased if dark haloes are not assumed to have the standard CDM profiles, but lower central concentrations.
keywords:
galaxies: haloes, fundamental parameters, evolution, kinematics and dynamics – dark matter1 Introduction
Spiral galaxies have long been known to show apparent increases in the mass-to-light ratio () in their outer parts, which was one of the prime factors in discovering the ubiquity of dark matter in the universe (Bosma & van der Kruit, 1979; Whitmore, Forbes & Rubin, 1988). Current studies of spiral galaxy rotation curves largely focus on the observed radial distribution of the dark matter vis-à-vis the predictions of the current cosmological paradigm, cold dark matter with a cosmological constant (CDM). In particular, CDM simulations of galaxy halo formation predict a steep cusp of dark matter in the halo centres (Navarro et al. 1996, 1997: NFW hereafter; Moore et al. 1999), while many observations of late-type galaxies indicate relatively low central concentrations of dark matter (see Alam, Bullock & Weinberg 2002; Marchesini et al. 2002; de Blok, Bosma, & McGaugh 2003; Gentile et al. 2004; and references therein). It remains to be seen if this discrepancy can be traced to observational problems, to oversimplified predictions of the halo properties (especially with respect to the inclusion of baryonic effects), or to a fundamental failure of the CDM paradigm.
Early-type galaxies (ellipticals and lenticulars) are as numerous as late-types, and it is important to see how their dark matter distributions compare to those of spirals and to theoretical predictions. Historically, the lack of easily interpretable mass tracers like the cold gas in spirals has made it very difficult to map the mass distribution in early-types at large distances from their centres. Observations of stellar kinematics from integrated-light spectra are mostly confined within (where the effective radius encloses half the projected light), which is generally insufficient for establishing the presence of a dark matter halo (Kronawitter et al., 2000; Magorrian & Ballantyne, 2001)—much less for determining its detailed properties. Attempts to constrain the dark matter content in this way have produced inconsistent results (Gerhard et al., 2001; Borriello, Salucci & Danese, 2003; Trujillo, Burkert & Bell, 2004; Padmanabhan et al., 2004; Mamon & Łokas, 2004a), demonstrating the difficulties inherent in studying the stellar-dominated regions.
Tracers at larger radius in early-type galaxies are needed, and recent advances in instrumentation have dramatically improved the feasibility of measuring halo masses using planetary nebulae (PNe; Douglas et al. 2002), globular clusters (GCs; Dirsch et al. 2004), gaseous X-ray emission (Matsushita et al., 2002; O’Sullivan & Ponman, 2004b), gravitational lensing (Keeton, 2001), and extended HI disks (Oosterloo et al., 2002). Such studies have so far ascertained the presence of both massive (Romanowsky & Kochanek, 2001; Buote et al., 2002; Napolitano et al., 2002; Côté et al., 2003; Richtler et al., 2004; O’Sullivan & Ponman, 2004b; Treu & Koopmans, 2004) and weak (Méndez et al., 2001; Romanowsky et al., 2003; Peng, Ford & Freeman, 2004) dark haloes. Various attempts have been made using halo tracers to derive generic constraints on dark matter in ellipticals (Bertola et al., 1993; Bahcall, Lubin & Dorman, 1995; Danziger, 1997; Loewenstein & White, 1999), but none of these has used a large, well-defined sample of ellipticals covering a broad range of luminosities. With ongoing observational projects aimed to the study of mass distribution around early-type galaxies using stellar kinematics (SAURON: de Zeeuw et al. 2002; PN.S project: Douglas et al. 2002), strong gravitational lensing (CLASS: Myers et al. 1995; and LSD: Koopmans & Treu 2002) and X-rays (O’Sullivan & Ponman, 2004a, b), we expect to have, in the near future, a much better observational picture of the halo mass distributions in a large representative sample of early-type galaxies.
To prepare for this observational onslaught, in this paper we want to provide a suite of predictions from the CDM theory for halo mass distributions. To gain qualitative insight, we begin with the most basic characterisation of a dark matter halo around a luminous galaxy: the radial gradient. In conjunction with deriving predictions for this gradient, we illustrate the kind of analysis possible with future extensive data sets by comparing the currently available observational results with the model expectations. This approach may be contrasted with the detailed analysis of individual galaxies, where one attempts to decompose the mass distributions into their baryonic and non-baryonic components and then compare these to CDM predictions. Here we are more simply looking at a broad property of the mass profiles which can be statistically analysed. Note that even with detailed analyses, it may never be possible in individual galaxies to unravel all the geometrical and dynamical degeneracies, necessitating a statistical approach such as in this paper in order to interpret the results.
The paper is organised as follows: in Section 2 we introduce the gradient as a basic quantity for describing the relative distributions of luminous and dark mass; in Section 3 we present predictions from CDM for , including its dependence on various galaxy properties; in Section 4 we assemble observational results on for a sample of galaxies from the literature, and we test for correlations with other observed properties; in Section 5 we compare the observed and predicted trends in , and examine the implications for galaxy formation. We draw conclusions in Section 6.
2 The gradient
Aiming for the simplest characterisation of the dark matter content of a galaxy, we could consider the total at some large radius, such as the benchmark quantity (-band within 5 ) introduced by Romanowsky et al. (2003). This would allow for constructions similar to the Tully-Fisher relations in spiral galaxies, but in comparing different galaxies, a quantity such as is complicated by differences in the stellar luminosities (i.e., in the stellar , ). Instead, we consider the increase in the with radius relative to its value in the galaxy centre (where it is presumably dominated by ). This gradient gives us a clearer idea of how much extra mass resides in the halo, and it is computed below.
The gradient is a continuously varying quantity with the (three-dimensional) radius, but its average value between an inner and an outer radius () is given by:
| (1) |
where and are respectively the luminous (stellar) and the dark masses enclosed within a certain radius. This is the absolute value of the gradient, but to normalise galaxies of different mass and size to similar scales, we compute
| (2) |
Thus is approximately equivalent to the logarithmic gradient of the . The predicted value for is the middle expression of Eq. 2 (also referred to as hereafter), and is uniquely determined once the mass distributions and measurement radii are adopted (see Section 3). The empirical value is the left expression (, hereafter); in addition to any dynamical modelling uncertainties in , is a source of systematic uncertainty (discussed later). Although will in principle depend on the location of its measurements (, ), the ratio can, to a first approximation, be assumed to vary linearly with the radius (i.e., not to have strong local gradients), such that is fairly independent of the measurement radius (we check this for a theoretical model in Sections 3.3 and 3.4; see also Dubinski 1998). This allows us to uniformly compare observational results where the values of are rather heterogeneous. Note also that is independent of the filter bandpass used for the estimates.
3 Predictions from CDM
We build spherical representations of early-type galaxy mass profiles, using a constant- model for the stellar distribution (Section 3.1) plus a CDM model of the dark halo (Section 3.2). We combine these components in Section 3.3. We do not include a diffuse gas component, since we expect its mass inside 5 to be a small fraction of the stellar mass (we discuss the effect of this assumption in Section 3.4). We derive the predictions for various model parameters in Section 3.4.
3.1 The luminous component
The Hernquist (1990) profile is known to be a fairly accurate representation of the stellar mass distribution in early-type galaxies; in projection, it approximates well the de Vaucouleurs law (de Vaucouleurs, 1948). Assuming to be radially constant, the stellar mass density distribution is
| (3) |
where . The cumulative mass profile is
| (4) |
Thus we have a family of density distributions characterised by two parameters: the total luminous mass, , and the effective radius . These parameters do not vary arbitrarily in early-type galaxies (as demonstrated by the fundamental plane (FP)) but are correlated by a power law of the form
| (5) |
The scatter of the parameters in Eq. 5
is an important source of uncertainty which we will address in more detail in later sections.
In this section we start drawing predictions for generic early-type galaxies in CDM. For this reason we assume the results from Shen et al. (2003) based on a large statistical sample (about 140 000 galaxies) as a reasonable representation of the size-mass scaling properties of early-types.
Shen et al. (2003) found for their SDSS sample of early-type galaxies that and ( for ),
consistent also with the results of Chiosi et al. (1998).
Other studies of large samples of early-type galaxies have found mean relations between total luminosity and effective radius of
, with 0.54–0.63 (Pahre, Djorgovski & de Carvalho, 1998; Bernardi et al., 2003; Mamon & Łokas, 2004a),
i.e. a slope very similar to the Shen et al. (2003) results under the assumption that is constant with (and ). In this case we could take as an average value.
If this assumption is not true, as suggested by FP studies,
then a relation implies
and .
The exponent depends on the passband and
has been found to lie in the range 0.2–0.6 (Pahre, Djorgovski & de Carvalho, 1995; Gerhard et al., 2001);
assuming and an intermediate value of , we obtain .
Higher values are found using
the relation (Kormendy, 1977)
and the assumption of homology
(,
where and
are the effective surface brightness in magnitudes and luminosities, respectively).
The Kormendy relation implies and with a bit of algebra, ,
giving 0.9–1.2 for 0–0.3.
We thus adopt as a characteristic value in equation 5, with
– representing the plausible range.
Later in the paper,
when comparing model predictions with observations, we will check that
this size-mass relation is consistent with our galaxy sample (Section
4.2). Note that, besides the relation for massive galaxies (), Shen et al. (2003) also provide a shallower relation (, ) for dwarf ellipticals.
3.2 The dark component
It is a basic prediction of CDM that visible galaxies are embedded in extended haloes of dark matter. N-body simulations of hierarchical formation in the “concordance” CDM cosmology (: NFW; Bullock et al. 2001; Wechsler et al. 2002) produce average dark halo mass profiles of the form
| (6) |
where is the inner characteristic length–scale, corresponding to the radius where the logarithmic slope of the profile is . Equation 6 can be written in terms of the total mass at the virial radius and of the concentration parameter :
| (7) |
where and
| (8) |
The cumulative mass profile is then
| (9) |
where we have followed the notation of Borriello, Salucci & Danese (2003). In principle, NFW profiles are a two-parameter family of density distributions ( and , or equivalently and )111Navarro et al. (2004) provide a more detailed analysis of the density profiles (see also Mamon & Łokas 2004b), but using these profiles would change and by only 10%, which does not affect our conclusions in this paper.. However, a key result of CDM theory is that the halo concentration correlates on average strongly with the virial mass (Bullock et al. 2001; Wechsler et al. 2002), which for a population of haloes at may be written as222 We have derived Eq. 10 in our assumed cosmology in the halo mass range via the toy model code provided by J. Bullock.
| (10) |
where the overdensity of the halo mass relative to the critical density has been taken to be (Bullock et al., 2001). In Eq. 10 includes the baryonic mass, , (). Assuming a baryon fraction (see next section), we have and Eq. 10 can be written explicitly for as
| (11) |
Using this correlation, NFW profiles can thus be considered as a one-parameter density distribution (characterised by or ).
The NFW profiles were produced in the framework of non-interacting (N-body) particles, but real galaxy formation includes baryons, whose interactions could modify the dark matter mass profiles significantly—especially in their centres. Including these baryonic effects (cooling, star formation, heating, etc.) can be considered the “holy grail” of galaxy formation theory, and there are currently efforts underway in this direction (Meza et al., 2003; Sommer-Larsen, Götz & Portinari, 2003; Weinberg et al., 2004; Sáiz, Domínguez-Tenreiro & Serna, 2004; Wright et al., 2004; Mo & Mao, 2004). However, it seems that even the qualitative effects on the mass profiles are not yet known with any certainty, so we are simply taking the NFW profiles as the first approximation to the predictions of CDM. Some possible implications of baryonic effects are discussed in Section 5.
3.3 The stellar mass fraction
From the previous sections, we see that early-type galaxy mass distributions in the CDM framework can be approximated fairly well as a family of two parameters (for instance, and ). We would further like to parametrise the stellar-to-dark mass ratio . Although dark matter could be stripped from the halo, and baryons could be lost or gained through inflows and outflows, for want of more detailed knowledge we assume that the baryon fraction in the galaxy halo is the same as the universal value: . This latter quantity is well constrained from the measurements of the cosmic microwave background, and here we adopt (Bennett et al. 2003). We relate this to the net star formation efficiency (including stellar mass loss) by the following:
| (12) |
and thus . While for physical insight, we will use as our key parameter in this study, it should be remembered that this is a valid characteristic only if baryons are indeed conserved. Thus we will also quote the more robust dark-to-luminous mass fraction parameter .
There are no a priori constraints on , although galaxy formation models use values in the range – (Benson et al., 2000). Its extreme upper limit (given the baryon conservation assumption) is (), while its lowest limit can be taken from the universal average star formation efficiency of (; Fukugita, Hogan, & Peebles 1998) and the assumption that early-type galaxies are at least as efficient as this, since clusters and groups bring the average down significantly. Studies matching mass and luminosity functions of virialised systems have suggested 0.25 ( 20) for typical galaxies (Marinoni & Hudson, 2002; Guzik & Seljak, 2002), while stellar masses in the SDSS survey (Padmanabhan et al., 2004) implied and (). In the following we will consider conservatively as our lower and upper limits respectively.
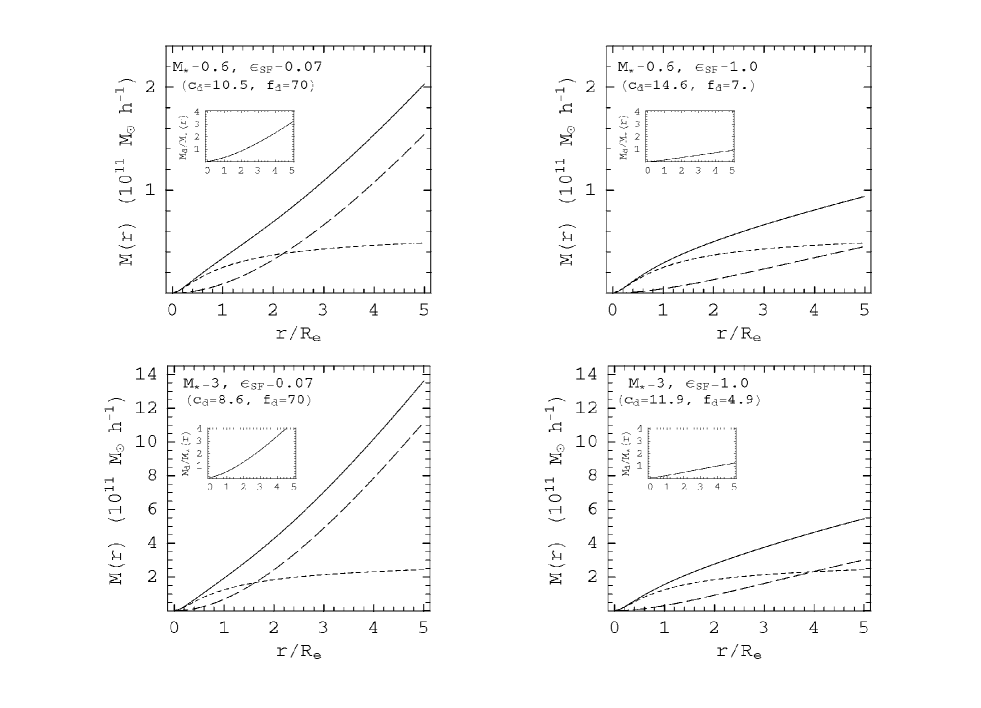
We thus construct a sequence of CDM-based galaxy models characterised by and . In real galaxies, the scatter in the – and – relations would produce considerable variation about this sequence, but for now we are considering the mean properties which should be apparent in a large enough sample of galaxies. In Fig. 1, we show some example mass profiles, where typical values for are assumed, and extreme cases of are used. Note that in all cases, the dark matter is the dominant mass component by 5 , indicating that early-type galaxies should generically show appreciable gradients by this radius. The fraction of the total mass in dark matter within 0.5 is in these cases 10–20% (increasing with and decreasing with )333Testing alternative parameter values in the – relation (Eq. 5) of =0.4–1.2 does not change the conclusion that the dark matter fraction at is small. . It is also evident in Fig. 1 that the gradient is more strongly dependent on than on , which arises because scales weakly with mass (and thus galaxies with a given are a nearly homologous family). In the same figure, inset panels show ; this mass ratio does not significantly deviate from a linear growth curve at , except for the case of very low (i.e., very dark matter dominated haloes) and thus the measurement locations in Eq. 2 are generally not important (see also next section).
3.4 gradient predictions
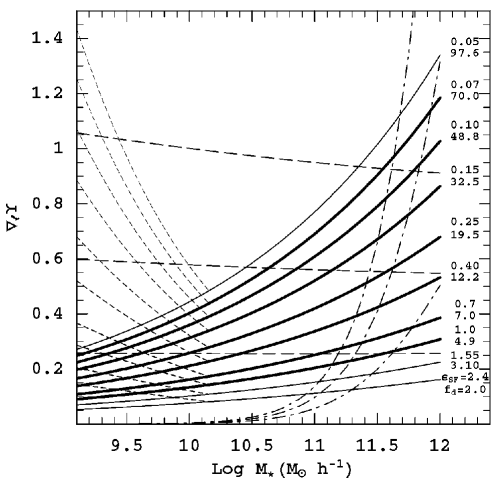
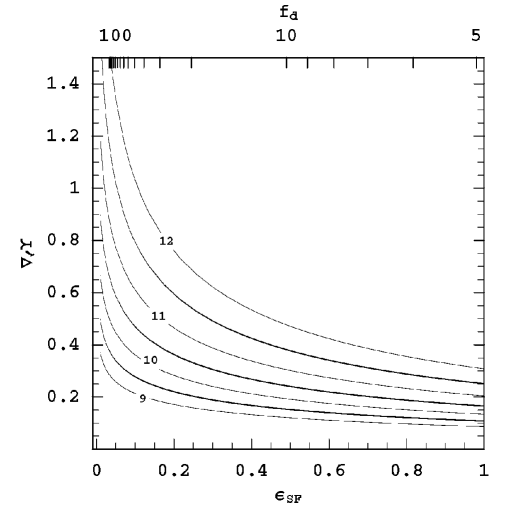
We compute the model gradients (Eq. 2) with and representing typical values for the empirical measurements in Section 4.1. In Fig. 2, we plot the predicted versus for sample galaxy models with various values of . The gradient increases for decreasing , since low-efficiency systems imply relatively more massive dark haloes. In Fig. 3, we plot the versus galaxy mass for various values of . The gradient increases with , which can be qualitatively understood by the construction that the scale radius of the stars varies more rapidly with mass () than the scale radius of the dark matter (). Thus the stellar body of a brighter galaxy encloses a larger fraction of its dark matter halo than in a fainter galaxy, and appears more dark-matter dominated. This also means that in brighter galaxies, is more sensitive to than in fainter galaxies (see Fig. 2).
Although these predictions appear uniquely determined for given , there is an – scaling relation implicitly assumed (Eq. 5), which translates into assumed locations for . We therefore check the effects on the model predictions of the – relation. In Fig. 3 we show the predicted – curves for and , in addition to the nominal values of . The steep relation means a steeper trend for : for the more massive galaxies, is larger for a given , and thus the gradient probes farther into the dark matter halo, producing higher values of . For the less massive galaxies, is smaller, producing lower values of . With the shallow relation, scales more quickly than , and the behaviour goes in the opposite direction, actually declining slightly with .
| Galaxy | Type444Types and magnitudes from HyperLeda (http://www-obs.univ-lyon1.fr/hypercat/). | 555Distances from SBF measurements (Tonry et al., 2001), rescaled from to . The exceptions are NGC 4486B—which is assigned the same distance as NGC 4486—and NGC 1700, NGC 4464 and NGC 7626, for which the redshift-distance is used. The distance uncertainties are taken from the SBF paper and included in any uncertainties in and , but are not included in the uncertainties shown here since they cancel out when calculating . | 666 For consistency, is taken from the dynamical reference paper. | 777 and are taken from Bender, Burstein & Faber (1992); Forbes, Franx, & Illingworth (1995); Faber et al. (1997); Pellegrini (1999); Trager et al. (2000); Ravindranath et al. (2001); and references therein. | Data type888LS=long-slit integrated light stellar kinematics; PN=planetary nebulae; GC=globular clusters; | ||||||||
|---|---|---|---|---|---|---|---|---|---|---|---|---|---|
| (Mpc) | (kpc) | () | () | () | () | () | Ref. | ||||||
| NGC 221 | E3 | 0.9 | -16.5 | 0.2 | 0 | 0.5 | 0.1 | 5.6 | LS,PN;MB01,V02 | ||||
| NGC 821 | E2 | 25.5 | -20.6 | 6.2 | 2.5 | 0.64 | 0.5 | 4.8 | LS+PN;G03,R03 | ||||
| NGC 1316 | S0 | 22.7 | -22.1 | 12.0 | 0 | 0 | 0.6 | 2. | LS+PN;A98 | ||||
| NGC 1379 | E0 | 21.2 | -19.8 | 2.5 | 0.2 | - | 0.4 | 2.5 | LS;MB01 | ||||
| NGC 1399999The PN and GC results from Napolitano et al. (2002) ( 28–45 at 8.8 ) imply 0.3–0.58 depending on assumptions about the halo equilibrium. We use the R04 result when computing correlations. | E1/cD | 21.1 | -21.4 | 4.3 | 0.1 | 0.07 | 1. | 12 | LS+GC;S00,R04 | ||||
| NGC 1700 | E4 | 52 | -21.7 | 3.5 | 0.4 | 0.01 | 0.5 | 4.6 | LS;S99 | ||||
| NGC 2434 | E1 | 22.8 | -20.5 | 2.7 | 0 | 0.7 | 0.5 | 2.6 | – | LS;K00 | |||
| NGC 3115 | E6/S0 | 10.2 | -20.2 | 2.8 | 1.0 | 0.78 | 0.8 | 3.3 | – | LS;C93,E99 | |||
| NGC 3379 | E1 | 11.2 | -20.1 | 2.0 | 0.2 | 0.18 | 0.5 | 7.9 | LS+PN;G03,R03 | ||||
| NGC 3384 | E5/S0 | 12.3 | -19.8 | 1.5 | 1.0 | 0.6 | 0.5 | 5.8 | LS,PN;T95,B96 | ||||
| NGC 4406 | E3 | 18.1 | -21.6 | 8.9 | -0.7 | 0.08 | 0.3 | 2.4 | LS,PN;M91,A96 | ||||
| NGC 4464 | S0/a | 15.3 | -18.7 | 0.45 | 0.5 | 0.88 | 0.5 | 2.8 | LS;MB01 | ||||
| NGC 4472 | E2 | 17.2 | -22. | 8.7 | -0.3 | 0.04 | 0.5 | 4.5 | LS,GC;K00,C03 | ||||
| NGC 4486 | E3/cD | 17. | -21.7 | 7.8 | 0 | 0.2 | 0.5 | 4.8 | – | LS+GC;RK01 | |||
| NGC 4486B | E1 | 17. | -16.8 | 0.26 | 0.8 | 0.14 | 0.2 | 2.8 | – | LS;K00 | |||
| NGC 4494 | E1 | 18 | -20.7 | 4.3 | 0.3 | 0.6 | 0.5 | 3.9 | – | LS,PN;K00,R03 | |||
| NGC 4697 | E3 | 12.4 | -20.2 | 5.7 | 1.4 | 0.74 | 0.4 | 3.4 | LS,PN;M01 | ||||
| NGC 5128 | S0 | 4.4 | -21. | 6.6 | -0.5 | 0.15 | 0.3 | 10 | – | PN;P04 | |||
| NGC 5846 | E1 | 26.3 | -20.4 | 8.0 | 0 | 0.2 | 0.5 | 3.2 | LS;MB01 | ||||
| NGC 6703 | E1 | 28.2 | -20.3 | 4.1 | 0 | - | 0.5 | 2.6 | LS;K00 | ||||
| NGC 7626 | E2 | 46 | -21.4 | 8.5 | 0.2 | 0.2 | 0.5 | 2.1 | LS;K00 |
Note that the mass of any diffuse gas [i.e., ]
should add to the gradient as a baryonic dark matter component.
However, assuming that this gas is distributed diffusely out to the virial radius (following the CDM density profile),
its contribution to is no more than .
We have also assumed that is constant with radius, even if observed colour gradients of galaxies suggest a slightly decreasing with radius.
Although it would be ideal to make our measurements in the -band rather than
the -band in order to minimise this effect, we estimate the contribution
to in our current calculations to be only .
We also test the sensitivity of to its measurement locations );
these are important only for very dark-matter dominated systems, such that
a value of changes by if .
Our model galaxy constructions based on CDM theory thus make
specific predictions for mass-to-light ratio gradients. The quantity
increases with unless systematically
increases with , or the scaling parameter is very
high. If dwarf ellipticals do indeed follow a shallower scaling
relation , then should increase again at low (c.f. Dekel & Silk 1986), with
a minimum occurring at .
4 Observational results
We describe our compilation of results for early-type galaxies in Section 4.1. We study the – relation in Section 4.2, and search for correlations between parameters in Section 4.3. Hereafter we assume km s-1 Mpc-1.
4.1 Galaxy sample
We assemble from the literature the dynamical results on all early-type galaxies with mass measurements at a radius . These exclude galaxies with masses derived through X-ray analyses, strong gravitational lensing and gas disks and rings, as these techniques may be prone to strong selection effects. For instance, X-ray emission occurs mostly in giant elliptical galaxies, so these results are restricted to the brightest, most massive systems—mostly group or cluster dominant ellipticals (see O’Sullivan & Ponman 2004b for a discussion). Gravitational lensing also suffers a selection effect for large masses, since the lensing cross-section is a power-law of the lens mass. Furthermore, the systems studied by lensing are generally located at large redshifts (Treu & Koopmans, 2004): here it appears that low mass galaxies are still forming stars while only very massive galaxies are already in place (Jimenez et al., 2004). This makes the selection effect even worse if we want to compare results with local galaxies. Extended HI rings (which are rare occurrences) are mostly located in S0 systems. Furthermore, in most of the cases, these systems are gas rich () which suggests that these galaxies are the result of a particular formation history (merging remnants of gas rich disks, Oosterloo et al. 2002) and are not representative of the ellipticals on the whole. Thus, none of these methods is really suitable for an unbiased survey of the properties of dark matter haloes around elliptical galaxies.
The techniques remaining include integrated stellar light, PNe and GCs; there is no obvious reason for any of these to produce a particular selection effect on total mass (rather than on luminosity). The results could in principle be skewed by dust effects when relying on integrated stellar light kinematics (Baes & Dejonghe, 2001), but the halo masses of most of the sample galaxies are derived from discrete tracers (PNe and GCs), which are not affected by this issue. There are 21 galaxies in the sample (16 ellipticals, 3 lenticulars and 2 of a transitional nature); their properties are summarised in Table 1, including (isophote shape parameter) and (inner surface brightness slope). Note that this sample includes two cD galaxies, whose halo masses may very well be dominated by the galaxy cluster in which they reside. However, this may also be true of group-dominant galaxies in general, and at this point we do not wish to make such a priori distinctions; we will check any density environment dependence later on.
Some of the dynamical mass-to-light ratios (—provided in the -band for uniformity) are derived from highly flexible modelling techniques which fit orbital distributions to the detailed line-of-sight velocity distributions (Kronawitter et al., 2000; Gebhardt et al., 2003; Romanowsky et al., 2003). For these we take the uncertainties in as given in the papers. In other cases, Jeans (and similar) models have been used to fit binned velocity dispersion profiles; in such models, orbital anisotropy is a major source of systematic uncertainty. Although not many detailed dynamical studies have extended beyond 2 , so far no cases of extreme anisotropy have been detected (see e.g., Gerhard et al. 2001). We therefore assume that the anisotropy parameter lies in the range ( is isotropic), and estimate uncertainties in of % and in of %.
To find the empirical gradient , we also need to know , which may be estimated in two completely independent ways. We can use spectroscopic information for the luminous body combined with (single-burst) stellar population synthesis models: . This is in principle the most direct way to measure the stellar mass only, but currently such models are susceptible to considerable systematic uncertainties. The second way is to use the dynamical estimate: ; there will be some dark matter contribution to , so this approach will provide a lower limit on . The advantage of this approach is that many systematic uncertainties (such as distance) will cancel out in Eq. 2; the empirical gradient is thus:
| (13) |
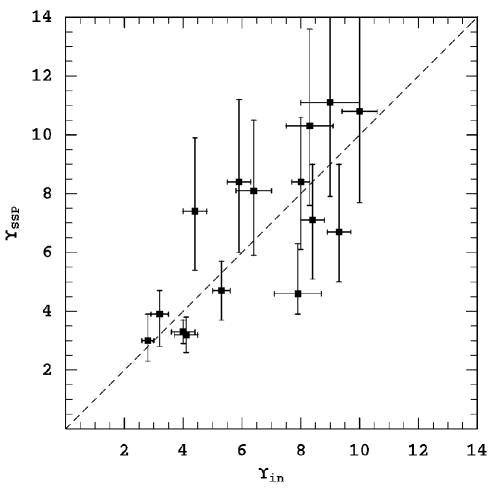
We first check the reliability of these two approaches by comparing their results in a common galaxy subsample. The mean stellar age and metallicity are taken from Terlevich & Forbes (2002), or if unavailable, from Trager et al. (2000) or from Kuntschner et al. (2001); note generally. We then obtain the expected -band stellar mass-to-light ratio, , using stellar population synthesis models from Worthey (1994). After examining galaxies in common in order to tie the results onto a uniform scale, we increase the values from Trager et al. (2000) by 15% and decrease those from Kuntschner et al. (2001) by 8%. The results for the 15 galaxies with available age and metallicity are listed in Table 1.
We compare to the innermost dynamical estimates in Fig. 4, and find them to be remarkably consistent given all the potential sources of error which have not been included in the uncertainties (e.g., distance, IMF, heterogeneous ). This consistency indicates that if some fraction of comes from dark matter, then has been systematically overestimated by approximately the same amount. We will thus assume for all our ensuing analyses, also examining in due course the potential effects of a non-negligible dark matter contribution.
A best fit of to galaxy luminosity and mass shows a weak correlation: , . This is weaker than some of the trends found in the literature (see Section 3.1), but Kauffmann et al. (2003) and Padmanabhan et al. (2004) also find to be roughly constant. The models of the latter two imply 5 in the -band, while we obtain 7 typically, lending credence to the possibility that we are underestimating the amount of dark matter in the central parts of our galaxy sample.
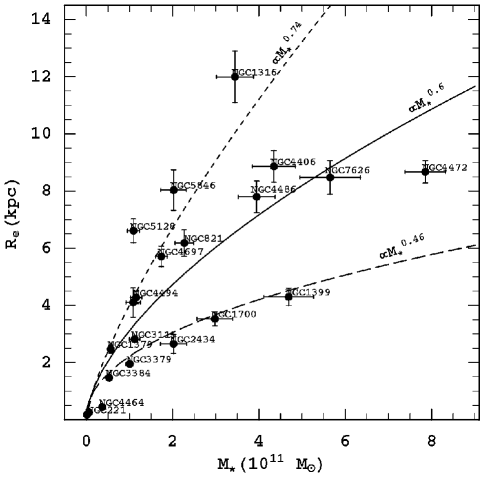
4.2 Mass-radius relation
As seen in Section 2, to derive the gradient predictions, we needed a mean relation between and (Eq. 5), where we adopted values for the parameters based on literature results. For direct comparison to our empirical gradient results, we must check that our galaxy sample is consistent with this relation. We begin by fitting a mean - relation to our sample (as shown in Fig. 5), where is obtained by multiplying and the total luminosity . We find , which is consistent with ; ) from Shen et al. (2003). Since this fit is sensitive to sparse sampling effects in our data set, we instead wish to use an exponent based on the much larger SDSS galaxy sample, with the normalisation set by our data because of systematic differences in measuring masses and sizes. Assuming a typical (see Section 3.1), we find ; for comparison from Shen et al. (2003) 101010This is consistent with their values (obtained via population synthesis modelling; Kauffmann et al. 2003) being systematically lower than ours., and the Pahre, Djorgovski & de Carvalho (1998) results (where also ) imply if and . Thus, our – relation is intermediate between typical literature values.
The uncertainties in this relation are important to consider when making predictions for . In particular, the exponent is not yet known conclusively and may systematically vary with ; we have seen in Section 3.4 how changes in would affect the model predictions for . We have also seen that, even if is known accurately, there is a large scatter in real galaxies around the mean – relation (which is after all only a projection of the fundamental plane). So when we later come to results in Fig. 7, these should not be over-interpreted for any single galaxy; rather, the mean trends in a large sample of galaxies are meaningful. We can quantify the effects of the scatter by finding an “envelope” for the – relation, enclosing 68% of the data points. The upper and lower envelopes have and , respectively (see Fig. 5); these values are well within the plausible bounds on of 0.4–1.2 discussed in Section 3.1. Thus when we compare to theoretical models in Section 5, we can safely use , based on larger galaxy surveys, as representative of our sample; and we can check the effects of allowing to vary within plausible limits.
4.3 Correlations
Before comparing the empirical results on the gradient to theoretical predictions,
we would like to see if there are any correlations in the data
(see earlier work in Capaccioli et al. 2003; Napolitano et al. 2004).
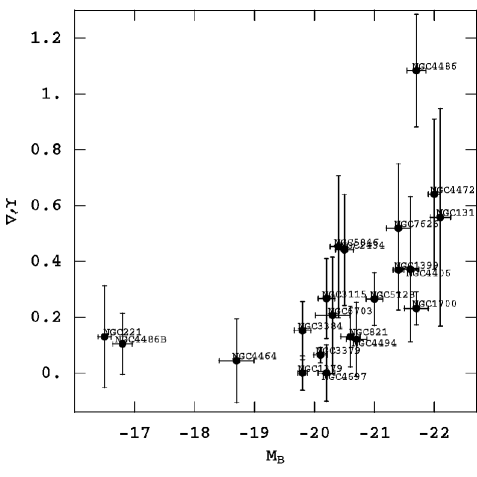
The broadest property to test against is the total galaxy magnitude .
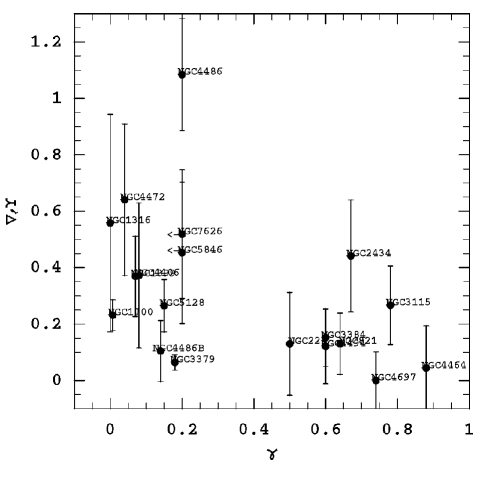
Plotting against in Fig. 6,
we see that fainter galaxies have shallow gradients
(–0.1 for )
while the brighter galaxies have a wide range of gradients
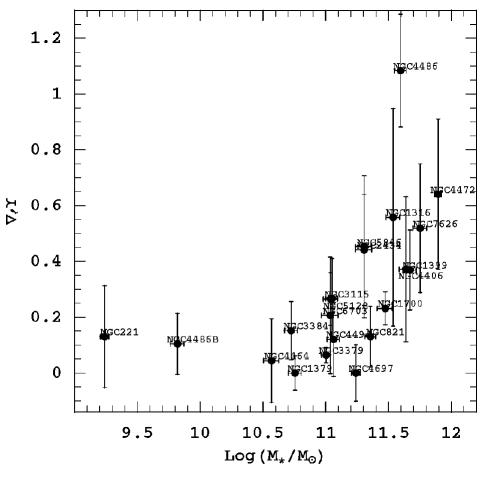
(–0.6). The same trend is found when considering galaxy mass (as estimated using ) rather than galaxy luminosity, with marking the transition between shallow and steep gradients.
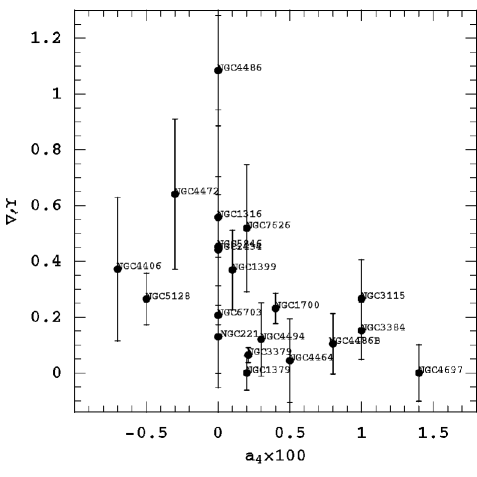
We also see evidence in Fig. 6 for disky galaxies () having
shallow gradients while boxy ones have a wide range,
and for galaxies with a steep central cusp () having shallower gradients
than those with a shallow cusp.
These last two trends are not surprising given the first, since it is well-established that
galaxy properties such as and correlate strongly with luminosity (Nieto & Bender, 1989; Capaccioli et al., 1992; Faber et al., 1997).
The strengths of the correlations as measured by the Spearman rank statistic (Press et al., 1992) are given in Table 2, where
is the number of galaxies.
To estimate the statistical significance of these correlations,
we performed, for each structural parameter, 10 000 random experiments where have been randomly extracted for each galaxy
according to a Gaussian measurement distribution.
The confidence level of the correlations being real is then given in the table.
The correlations apparent by eye are all significant at the more than 97% level,
and the ones with and are the strongest.
Note that these correlation results are independent of any distance uncertainties
(which cancel out in the method used for estimating ).
Nor are they changed if is systematically wrong in the sense that there is a large,
constant fraction of dark matter in the galaxy centres:
this would change equally for all galaxies and would not affect their ordering.
A possible effect is if is wrong by an amount which varies systematically with .
However, in our basic CDM picture, is likely to be systematically
too high for the brightest galaxies (see Section 3.3), leading to estimates which are too
low; thus, the “corrected” values of would result in an even stronger correlation.
Even if were wrong in the opposite sense
(such that is actually much lower for low- ellipticals),
we estimate that dark matter mass
fractions of % would be needed to explain the correlation—much larger than the
fractions typically estimated from other studies.
As a final source of systematic effects in the trends, we have checked any dependence of with the (density) environment.
We used for this purpose the galaxy density estimates (number of galaxies per Mpc3) from Tully (1988) and compared with our . We did not find any significant correlation with gradients: the Spearman rank statistics gives a 78% significance for a positive correlation. The steepest gradients (NGC 4486 and NGC 4472) are indeed the ones related to the densest environment (but note that their close companions NGC 4486B and NGC 4464 have low gradients). These are the only apparent cases where the environmental effect could have enhanced the gradients because of a cluster dark matter background or the effect of a close encounter (see Napolitano et al. 2002 for NGC 1399).
We therefore conclude that there is a empirical trend for bright, boxy shallow-core
early-type galaxies to appear more dark-matter dominated than faint, disky steep-core galaxies.
This result is irrespective of the type of underlying dark matter distribution and environment, but is
especially strong if it resides in basic CDM haloes.
5 Implications of predictions vs. observations
In Section 5.1, we show the results on halo masses and implied using the data from Section 4 in conjunction with the model predictions of Section 3.4. Finding many of the halo masses to be problematically low in the context of CDM, we consider possible alternative explanations in Section 5.2. In Section 5.3 we briefly discuss the results based on other observation techniques (X-rays, gravitational lensing and HI rings) and we lastly give some indication of the inferred in a few systems from the very low-mass regime in Section 5.4.
5.1 Matching models and observations
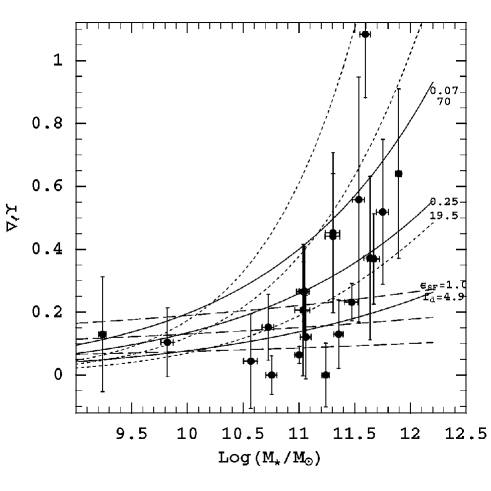
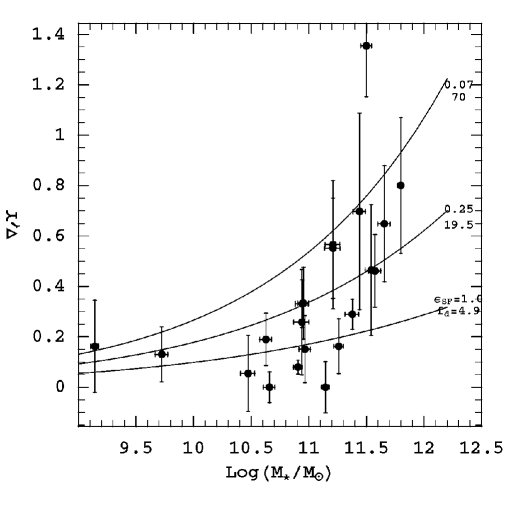
We now compare the galaxy gradient data, , to the expectations from CDM, and illustrate this in Fig. 7, where is plotted versus for various values of and using the best-fit – relation () together with the 68% envelopes. We can see immediately that the data do not seem to follow the simple increase of with that is expected for a “universal” , and the empirical increase appears to be sharper. By inspection of the figure, one interpretation is that the low-mass galaxies have very high values for (in some cases even above the highest allowed limit) while the high-mass galaxies have a broad scatter in , mostly within the allowed efficiency range. Note that projection effects in the dynamical modelling of can produce systematic effects on the inferred : face-on disky galaxies could appear to have very low if interpreted as spherical systems. This would produce some data points with spuriously low (and high ) values, but these should comprise a small fraction of a large, unbiased sample.
To quantify the – trend requires allowing for the individual galaxies’ departures from the mean - relation. To this end, we fit the model simultaneously to and to with free parameters , minimising the following statistic:
| (14) |
where , , =, and are the uncertainties on .
The results are shown in
Fig. 8 where we plot the best-fit (and
equivalently ) against the stellar masses. From the distribution of the fitted values we have inferred the following median values:
for and for (with a marginal overlap of the mass ranges around ). There are also galaxies with for which , only marginally consistent with the plausible lowest efficiency limit. These values suggest a smooth relation between
and (see Fig. 8) which is at this stage only tentative because of the large uncertainties in the data.
An alternative interpretation is the presence of a mass
scale [, ] marking a clear dichotomy: galaxies with are
most consistent with ,
while galaxies with are most consistent with 2 (). In the latter sample, half of these are well
determined to have , while those galaxies with lower (larger in Fig. 7) are boxy systems, in agreement with the tentative dichotomy discussed at the end of Section 4.3. This suggests that there are separate populations of galaxies with very different , rather than a trend of with for a single galaxy population—but we cannot distinguish between these two scenarios given the large uncertainties in the current data.
Note that other studies have suggested a maximum
galaxy formation efficiency (minimum dark-to-luminous mass fraction,
) at close to our (Benson et al., 2000; Marinoni & Hudson, 2002; Romano et al., 2002). Assuming
an average , as in our sample, we can convert this mass scale into a luminosity scale of ,
fairly similar to the luminosity scale found in other luminous properties of early-type galaxies (Graham et al., 2003; Graham & Guzmán, 2003).
The value for the high-mass galaxies is
logarithmically midway between the uppermost and lowermost limits adopted.
However, is unphysical for the low-mass galaxies,
given the assumptions of our CDM models. To understand the
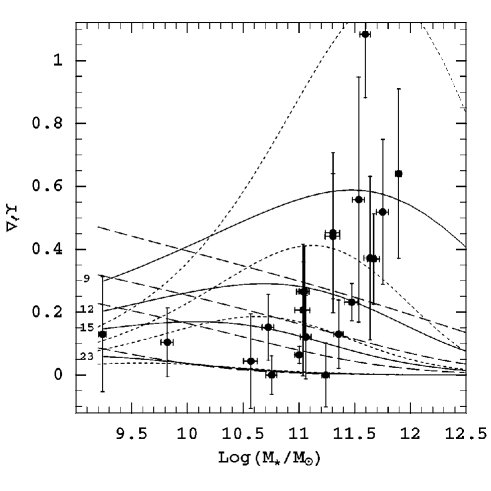
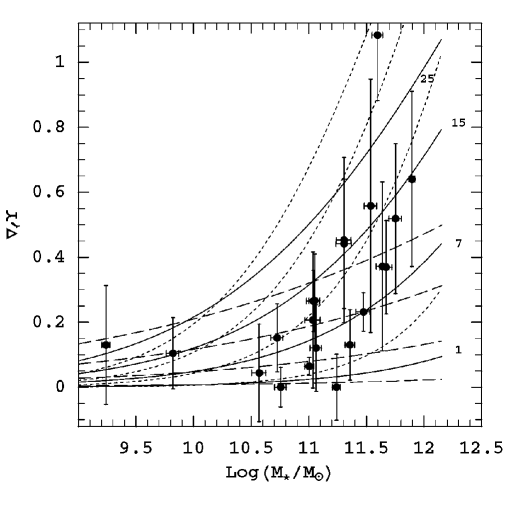
origin of these values in the CDM models, in
Fig. 9 we plot again as a function of with
curves of constant now indicated. At each point on the curve,
has been adjusted to fit the required CDM
- relation. For a low stellar mass galaxy
() to have a shallow gradient, its CDM concentration must be
high (), which implies a small halo mass. This mass corresponds to and thus to a
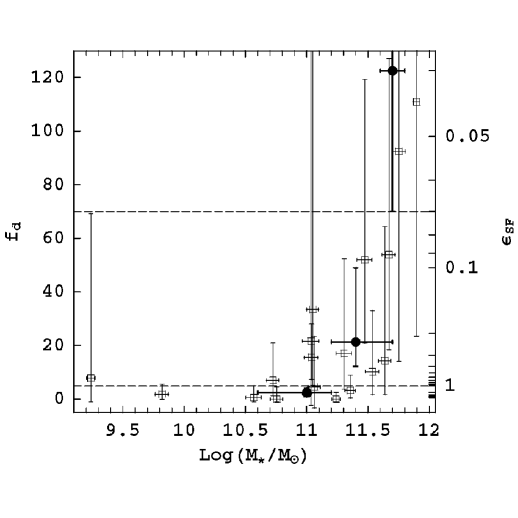
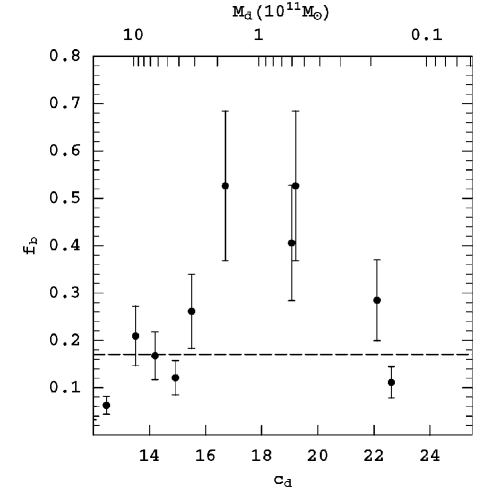
violation of baryon conservation. To show this, we plot in
Fig. 10 the baryon fraction as a function of , where the results (Fig. 8) have been re-interpreted with the
assumption , giving .
We find that many of the galaxies with have
, a circumstance which get worse if .
5.2 Discussion
In the previous section we have seen that the basic assumption of CDM (namely the relation) and baryon conservation with lead to typical formation efficiencies for galaxies with , while in the low-mass regime () they produce unphysical . We have also concluded that if we want to decrease the inferred below 1.0, and still have , we must release the relation otherwise we produce a violation of the baryon conservation.
Before moving on to other possible explanations for this problem, we first examine whether this problem
can be explained by the systematic uncertainties in .
As discussed in Section 3.3, in the CDM framework, we expect 10–20% of
to be a dark matter contribution.
Reducing by as much as 30% will systematically shift all the empirical estimates
of higher by 30% (see Eq. 1).
The – relation will also be affected, such that for a given is
higher, and thus and in the
model calculations will be higher;
this leads to a higher value of predicted by the models which roughly offsets the
higher values in the data.
The final effect is for the data values of to shift, and so the net change is for
the low-mass galaxy data points in Fig. 7 to shift roughly parallel to the
contours of constant —not affecting the conclusions on significantly
(see Fig. 11).
To decrease the inferred for the intermediate-mass galaxies to values below
1.0 would require a dark mass fraction inside
of %.
Such high central dark matter fractions
are not supported
by other empirical studies of the central mass content of early-type galaxies
(Gerhard et al., 2001; Rusin, Kochanek, & Keeton, 2003).
They
would also imply that the average stellar mass-to-light ratios,
, must be decreased by
a factor of two: this is not plausible from the standpoint
of stellar populations modelling where only for fairly
young stellar populations, with age Gyr, and metallicity (Worthey, 1994; Maraston, 1998).
One way to avoid the problem of low-mass haloes is
to relax the – relation,
using a maximum plausible value of as a prior.
Once and are fixed, the total dark-halo mass, , is set and the only way to alter (Eq. 9) is by altering .
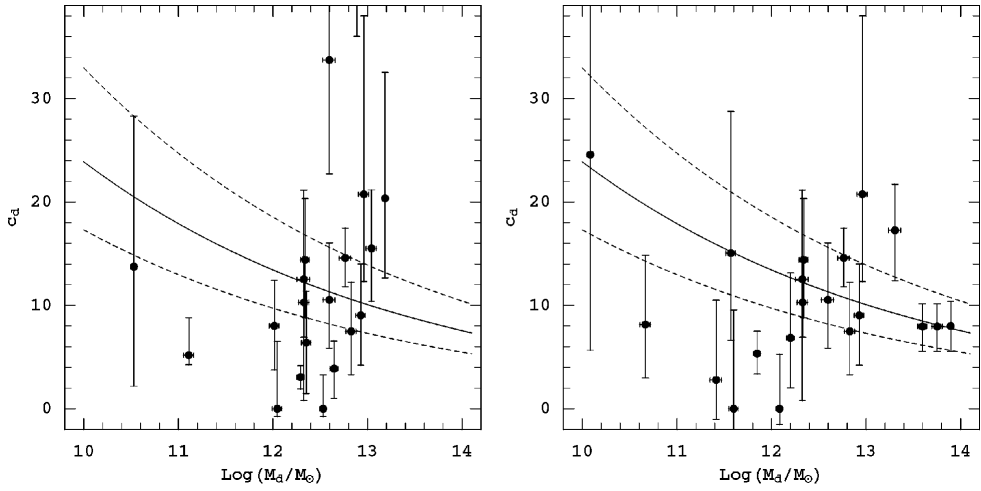
In this way can be written as a function of and : in Fig. 12
this is shown for ().
We can derive the best-fit values for each galaxy using the same procedure adopted for best-fitting (as in previous section).
Results are in Fig. 13 (left):
we see that the most massive galaxies ()
have concentrations consistent with CDM expectations
( 8–14),
while many of the less massive galaxies ()
have very low concentrations ( 1–6).
The shallow gradients in the low-mass galaxies are thus a simple consequence
of a small fraction of the dark matter residing in the galaxy centre.
This explanation was advanced in Romanowsky et al. (2003) but contradicts CDM expectations
that is decreasing with rather than increasing.
As suggested by Section 5.1, may
not be constant but rather decreasing with galaxy mass, which may alleviate the problem. We thus assume =0.25 for and for
(a maximum plausible value), and plot the results for in Fig. 13 (right).
The – relation is now in a better agreement with the CDM expectation,
but the low-mass galaxies still have haloes with concentrations which are too low on average.
The above alternatives (baryon non-conservation; low concentrations) for producing low gradients are necessitated by the strict NFW functional form for the haloes (Eq. 9). Thus there is little flexibility to change vs . But another way to reduce in the models (Eq. 2) is to change the ratio of versus by changing the form of the mass profile . For example, in the classic adiabatic contraction model of galaxy formation, the baryons’ collapse drags dark matter inward; this will increase above the nominal NFW halo central mass and decrease the inferred . Again, the implications of this alternative would be that many other studies of central DM density are incorrect, and that the population synthesis models have over-estimated by 50%. As mentioned in Section 3.2, it is not clear that this adiabatic contraction scenario is really to be expected, and we leave examination of the details to a future study—but comparing the alternatives, it seems this may be the most likely one for “saving” CDM.
Of course, the CDM theory is not as readily falsifiable as may be supposed, as various modifications to its simplest outline had been proposed in order to solve various problems. One may assume a different initial power spectrum and in principle partially solve the problems seen here; it has also been suggested that is a reasonable solution to the low-concentration halo problem (McGaugh, Barker & de Blok, 2003; van den Bosch, Mo & Yang, 2003).
5.3 Comparison with other dynamical techniques
For the sake of completeness, in this paragraph we briefly discuss how the results based on stellar kinematics plus PNe and GCs compare with results listed in the literature based on the techniques we have excluded in this paper: namely X-rays, gravitational lensing and HI rings. This is to verify whether (regardless any possible selection effects) different techniques give consistent results for the dependence of the gradients on the stellar mass and luminosity, which we have explained as a trend of the star formation efficiency with the same global quantities.
X-rays. O’Sullivan & Ponman (2004b) reviewed literature results on estimates based on X-ray emissions in early-type galaxies. They found that at 5–6 different modeling techniques give a lower limit of =20 on a large galaxy sample. Even if most of these estimates come from cluster and group dominant galaxies, they concluded that ellipticals can possess dark haloes of their own, regardless of their environment. We can infer a lower limit for the for these systems using their results. We can assume a as the average value find in our sample and derive (Xrays). Since in the X-rays sample, this is consistent with found for our galaxy sample of stellar masses .
Strong Gravitational lensing (SGL). There are only a few studies where of the innermost and outer regions are available for reliable estimates.
As discussed above, there is the further complication that SGL analyses refer to high ()
and they cannot be directly compared to model predictions obtained in the local universe ()
since both dark and luminous matter scaling relations change with redshift.
A detailed model prediction at high– is beyond the purpose of this paper. Here we want to give only a qualitative interpretation of SGL results.
Treu & Koopmans (2004) reviewed 5 bright () E/S0 systems with reliable estimates inside the Einstein radius (ranging from 0.8 to 5 ). Using their results we compute and an average (SGL) . These values are consistent with but somewhat higher than our dynamical results for bright galaxies, and comparison to models implies a very low star formation efficiency ().
Rusin, Kochanek, & Keeton (2003) used statistical constraints on the mass profiles of
22 lens systems over a broad range of luminosities to find a typical
homologous mass profile.
Their results assuming a CDM dark matter profile imply
–, which is consistent with our results for faint
galaxies but apparently not consistent with the Treu & Koopmans (2004) results
and with our bright galaxy results.
A more careful examination of these results, including treatment of
the -dependence of the models,
awaits a future paper.
HI rings. For these galaxies, the gradient prediction should account the presence of the gas since its mass contribution it is not negligible for these systems. For the sake of simplicity, as a first approximation we use our predictions obtained without gas as a reference. There are a few systems in the literature with reliable innermost and outer values suitable for estimates.
These galaxies include NGC 5266 (Morganti et al., 1997), IC 5063 (Morganti, Oosterloo, & Tsvetanov, 1998),
IC 2006 (Franx, van Gorkom, & de Zeeuw, 1994), NGC 1052, NGC 2974 and NGC 4278 (Bertola et al., 1993).
These galaxies span a broad range of luminosity, and we derive values
ranging from 0.4 to 1.0,
corresponding to .
These results are consistent with what we have found for the brighter galaxies,
but the weak halo behaviour for fainter galaxies is not detected.
However, as discussed earlier, we consider it dangerous to take the HI results as typical
of early-type galaxies because of selection issues.
5.4 Dwarf galaxies
In Section 3 we have made predictions for a wide range of galaxy masses, including dwarf systems (). This mass regime is populated both by dwarf elliptical galaxies (dEs) and low surface brightness late-type systems (LSBs). These two classes are different in many respects (morphology, gas content, stellar population etc.), but they also share some similarities: they are small, low-luminosity galaxies with diffuse, exponential declining surface brightness profiles111111In this respect our basic model assumption of an surface brightness profile is poorly representative for these systems.. Furthermore they have the same size-mass relation (Shen et al., 2003) and hence they are expected to have similar dark-to-luminous mass distributions. Specifically, as shown in Section 3.4, we must expect observed gradients to increase for decreasing stellar masses (and luminosities) and for decreasing star formation efficiency (at any given mass).
Unfortunately, these galaxies remain among the most poorly studied systems, mostly because of the observational difficulties related to their faint luminosities and detailed dynamical analysis are scarce and generally focussed on the central galaxy regions (Bender & Nieto, 1990; Mateo, 1998).
A complete view of these systems, although beyond the purpose of this paper, is complicated by data which are generally not suitable for the kind of analysis based on gradients.
Here we want to briefly compare our models with a few literature data sets which can be adapted to this analysis. We restrict our analysis to dwarf early-type galaxies which are gas poor and can be directly compared to the predictions of Section 3, where we discarded any gas component.
Fornax (Walcher et al., 2003) [=-11.7]: they estimate =23 at 90′ from the galaxy centre () and a central =4.8. We have obtained =0.52 for this galaxy which corresponds to =0.6 using the dwarf shallower relation in our models. We found consistent values using estimates from Łokas (2001).
FS373 (De Rijcke et al., 2004) [=-16.9]: they obtained =7.8 at 1.5 (=7.91.57 kpc) and computed a stellar =2–4 from age and metallicity of the stellar population. This allowed us to estimate 1–2.5 and =0.1–0.6.
FS76 (De Rijcke et al., 2004) [=-16.1]: they obtained =7.4 at 1.5 (=4.4 kpc) and considered a stellar =2–4 as for FS373. We found pretty similar 1–2.5 but =0.2–0.45 for this galaxy.
This very preliminary test on dwarf ellipticals suggests that gradients are actually increasing with decreasing masses as expected, and that this trend is also consistent with
tending to decrease at this mass scale from a maximum near .
Low star formation efficiencies in this mass range have been also inferred for gas-rich LSB galaxies (Jobin & Carignan, 1990; Cote, Carignan, & Sancisi, 1991; Martimbeau, Carignan, & Roy, 1994). They found 25–27121212 in their paper refers to the total baryonic matter in the galaxies NGC 3109, NGC 5855 and IC 2574 respectively, corresponding to observed which are almost in agreement with efficiencies of dwarf ellipticals derived above. Lake, Schommer, & van Gorkom (1990) claim at least half of the baryonic mass of DDO 170 in the form of gas, which implies assuming baryon conservation.
All these estimates are consistent with
what we obtain
by comparing the from their estimates with our models (in spite of our model simplification of not including gas).
We can then conclude that, based on gradients, there is evidence of low star formation efficiencies in the very low mass regime. This seems in agreement with other studies (Benson et al., 2000; Marinoni & Hudson, 2002) claiming a continuous decreasing star forming efficiency with decreasing masses at these mass scales.
6 Summary and Conclusions
We have introduced a method for measuring gradients in early-type (elliptical and lenticular) galaxies, quantified by . If the same technique is used for all measurements in a galaxy, then is independent of bandpass definitions and distance uncertainties. We have built typical galaxy models in the CDM framework using NFW profiles for the dark matter distribution. Assuming baryon conservation across the virial radius, these galaxies are parametrised by their total stellar mass and their net star formation efficiency ; we have then made predictions for (between 0.5 and 4 ) as a function of . As a consequence of the relative spatial scaling relations of the luminous and dark matter, we have found that brighter galaxies should typically show higher values of than fainter ones, appearing more dark-matter dominated even though the overall dark-to-luminous mass fraction is a constant. These predictions are valid for a mean set of galaxies only, and should not be used to draw direct conclusions about individual galaxies, whose properties are subject to considerable scatter.
We have next assembled a set of measurements (using stellar, PN and GC kinematics) in 21 early-type galaxies as a pilot study for comparing to our model predictions. We have found that in these galaxies increases with (and with other correlated parameters), which is evidence for systematic changes in either the fraction of dark matter or in its radial distribution. This empirical trend must be explained by any successful model of galaxy properties and formation (including those advocating alternative theories of gravity). Environmental density does not appear to play a key role in producing these trends.
Comparing the empirical values to the
CDM predictions, we find a stellar mass scale , and a corresponding luminosity scale of , marking a galaxy dichotomy.
The brighter (more massive) galaxies
show a broad scatter in , but are generally consistent
with 0.25.
The fainter (low-mass) galaxies are generally only consistent with 2–3, which is
not physically possible in the context of our model assumptions.
The brighter galaxies thus appear consistent with the CDM picture
without need for further complications from baryonic effects.
For the fainter galaxies, we have examined some possibilities for explaining their
apparent extremely high values
(i.e., apparent extremely low dark matter fractions).
One explanation is that the baryon fraction has not been conserved in these galaxies:
either they have acquired large quantities of extra baryons from inflows across the virial radius
(e.g., gas from nearby starbursting galaxies, which has since formed new stars);
and/or they have lost portions of their outer dark haloes
(after star formation) through dynamical interactions with other galaxies and groups.
We note that the latter process is implicitly included in CDM simulations of
dark halo formation, but the net effect on has not been explicitly studied.
Another explanation is that the predicted relation between halo mass and concentration in CDM is wrong, and tends to increase rather than decrease with , with 1–6 for galaxies. Similar conclusions have already been reached in studies of low-surface brightness galaxies (Alam, Bullock & Weinberg, 2002; McGaugh, Barker & de Blok, 2003), and may indicate that the dark matter is not CDM, or that the baryonic processes involved in galaxy formation have somehow caused the dark haloes to become less centrally-concentrated. However, the current best guess for baryonic effects is that the cooling and collapse of the gas causes the dark matter halo to also contract adiabatically (Blumenthal et al., 1986; Gnedin et al., 2004), which increases the central density of the halo. This is still a viable scenario for the fainter early-type galaxies if the stellar values are systematically lower by 50% than what we have assumed, and the central dark mass fraction is 40%. This possibility merits more investigation, although we note that several studies have concluded that the dark matter cannot be so dominant. Both scenarios (low-concentration haloes; low stellar ) are possible ways for resolving an apparent empirical inconsistency: weak lensing and satellite dynamics studies find evidence for large amounts of dark matter inside the virial radius in early-types (Guzik & Seljak, 2002; van den Bosch et al., 2004), while this paper suggests little dark matter inside in similar galaxies.
Whatever the case, these data imply a dichotomy in the dark halo profiles between fainter and brighter early-type galaxies (see Section 4.3), which parallels the dichotomy already visible in the properties of their luminous bodies (Nieto & Bender, 1989; Capaccioli et al., 1992; Faber et al., 1997; Graham et al., 2003; Graham & Guzmán, 2003), and X-ray properties (Pellegrini, 1999), and suggests markedly different formation histories for the two galaxy populations where baryon cooling efficiencies could have played a pivotal role. The comparison of data and models also supports other studies indicating that is at a maximum for galaxies around (Benson et al., 2000; Guzik & Seljak, 2002; Marinoni & Hudson, 2002; van den Bosch, Mo & Yang, 2003). Indeed, we have briefly discussed the case of dwarf/LSB galaxies and shown that there is the evidence of decreasing from their , supporting this scenario. We do not wish to over-interpret the implications for CDM at this point, since the number of fainter galaxies in the sample is not yet statistically large, and most of them are not yet modelled in enough detail to exclude the potentially important effects of radial anisotropy at large radius. But this paper highlights the importance of detailed dynamical studies of a larger sample of galaxies, where the distribution of the dark matter as well as the stars may be used as clues to the formation histories of galaxies.
Acknowledgments
We are very grateful to the referee, Dr. A. Bosma, for his comments which allowed us to improve the paper results. We thank James Bullock for providing his toy model code. NRN thanks M. Pannella for stimulating discussion on galaxy formation. NRN is receiving a grant from the EU within the 5th Framework Program (FP5) – Marie Curie Individual Fellowship. NRN, MC and MA acknowledge financial support by INAF-Project of National Interest.
References
- Alam, Bullock & Weinberg (2002) Alam S.M.K., Bullock J.S., Weinberg D.H., 2002, ApJ, 572, 34
- Arnaboldi et al. (1996) Arnaboldi M. et al., 1996, ApJ, 472, 145 (A96)
- Arnaboldi et al. (1998) Arnaboldi M. et al., 1998, ApJ, 507, 759 (A98)
- Baes & Dejonghe (2001) Baes M., Dejonghe H., 2001, ApJ, 563, L19
- Bahcall, Lubin & Dorman (1995) Bahcall N.A., Lubin L.M., Dorma V., 1995, ApJ, 447, L81
- Bender, Burstein & Faber (1992) Bender R., Burstein D., Faber S.M., 1992, ApJ, 399, 462
- Bender & Nieto (1990) Bender, R. & Nieto, J.L., 1990, A&A, 239, 97
- Benson et al. (2000) Benson A.J., Cole S., Frenk C.S., Baugh C.M., Lacey C.G., 2000, MNRAS, 311, 793
- Bernardi et al. (2003) Bernardi M. et al., 2003, AJ, 125, 1849
- Bertola et al. (1993) Bertola F., Pizzella A., Persic M., Salucci P, 1993, ApJ, 416, L45
- Blumenthal et al. (1986) Blumenthal, G. R., Faber, S. M., Flores, R., & Primack, J.R., 1986, ApJ, 301, 27
- Borriello, Salucci & Danese (2003) Borriello A., Salucci P., Danese L., 2003, MNRAS, 341, 1109
- Bosma & van der Kruit (1979) Bosma A., van der Kruit P.C., 1979, A&A, 79, 281
- Bullock et al. (2001) Bullock J.S., Kolatt T.S., Sigad Y., Somerville R.S., Kravtsov A.V., Klypin A.A., Primack J.R., Dekel A., 2001, MNRAS, 321, 559
- Buote et al. (2002) Buote D.A., Jeltema T.E., Canizares C.R., Garmire G.P., 2002, ApJ, 577, 183
- Busarello et al. (1996) Busarello G, Capaccioli M., D’Onofrio M., Longo G., Richter G., Zaggia S., 1996, A&A, 314, 32 (B96)
- Capaccioli et al. (1992) Capaccioli M., Caon N., D’Onofrio M., 1992, ESO ESP/EIPC Workshop on Structure, Dynamics and Chemical Evolution of Early-type Galaxies (Elba), eds. J. Danziger, W. W. Zeilinger, and K. Kjar, ESO: Garching, 43
- Capaccioli et al. (1993) Capaccioli M., Cappellaro E., Held E. V., Vietri M., 1993, A&A, 274, 69 (C93)
- Capaccioli et al. (2003) Capaccioli M., Napolitano N. R., Arnaboldi M., 2003, Sakharov Conference of Physics, Moskow, June 2002, [preprint:astro-ph/0211323]
- Chiosi et al. (1998) Chiosi C., Bressan A., Portinari L., Tantalo R., 1998, A&A, 339, 355
- Cote, Carignan, & Sancisi (1991) Cote, S., Carignan, C., & Sancisi, R., 1991, AJ, 102, 904
- Côté et al. (2003) Côté P., McLaughlin D.E., Cohen J.G., Blakeslee J.P., 2003, ApJ, 591, 850 (C03)
- Danziger (1997) Danziger I.J., 1997, in Persic P., Salucci, P., eds, ASP Conf. Ser. Dark and Visible Matter in Galaxies, S. Francisco, ASP
- Davies & Illingworth (1986) Davies, R. L. & Illingworth, G. D., 1986, ApJ, 302, 234
- de Blok, Bosma, & McGaugh (2003) de Blok, W.J.G., Bosma A., McGaugh S., 2003, MNRAS, 340, 657
- Dekel & Silk (1986) Dekel A., Silk J. 1986, ApJ, 303, 39
- De Rijcke et al. (2004) De Rijcke, S., Dejonghe, H., Zeilinger, W.W., & Hau, G.K.T. 2004, A&A, 426, 53
- de Vaucouleurs (1948) de Vaucouleurs G., 1948, Ann. d’Astrophys., 11, 247
- de Zeeuw et al. (2002) de Zeeuw, P. T., et al., 2002, MNRAS, 329, 513
- Dirsch et al. (2004) Dirsch B. et al., 2004, AJ, 127, 2114
- Douglas et al. (2002) Douglas N. et al., 2002, PASP, 114, 1234
- Dubinski (1998) Dubinski J., 1998, ApJ, 502, 141
- Emsellem et al. (1999) Emsellem E., Dejonghe H., Bacon R., 1999, MNRAS, 303, 495 (E99)
- Faber et al. (1997) Faber, S.M. et al., 1997, AJ, 114, 1771
- Forbes, Franx, & Illingworth (1995) Forbes, D.A., Franx, M. & Illingworth, G.D., 1995, AJ, 109, 1988
- Franx, van Gorkom, & de Zeeuw (1994) Franx, M., van Gorkom, J. H., & de Zeeuw, T., 1994, ApJ, 436, 642
- Fukugita, Hogan, & Peebles (1998) Fukugita M., Hogan C.J. & Peebles, P.J.E., 1998, ApJ, 503, 518
- Gentile et al. (2004) Gentile G., Salucci P., Klein U., Vergani D., Kalberla P., 2004, MNRAS, 351, 903
- Gerhard et al. (2001) Gerhard O. et al., 2001, AJ, 121, 1936
- Gebhardt et al. (2003) Gebhardt K. et al., 2003, ApJ, 583, 92 (G03)
- Gnedin et al. (2004) Gnedin O.Y., Kravtsov A.V., Klypin A.A., Nagai D., 2004, ApJ, submitted [preprint astro-ph/0406247)
- Graham et al. (2003) Graham, A. W., Erwin, P., Trujillo, I., & Asensio Ramos, A., 2003, AJ, 125, 2951
- Graham & Guzmán (2003) Graham, A. W. & Guzmán, R., 2003, AJ, 125, 2936
- Guzik & Seljak (2002) Guzik J., Seljak U., 2002, MNRAS, 335, 311
- Hernquist (1990) Hernquist L., 1990, ApJ, 356, 359
- Jimenez et al. (2004) Jimenez, R., Panter, B., Heavens, A., Verde, L., 2004, accepetd on MNRAS [preprint astro-ph/0403294]
- Jobin & Carignan (1990) Jobin, M. & Carignan, C. 1990, AJ, 100, 648
- Kauffmann et al. (2003) Kauffmann G. et al., 2003, MNRAS, 341, 33
- Keeton (2001) Keeton C.R., 2001, ApJ, 561, 46
- Koopmans & Treu (2002) Koopmans, L.V.E. & Treu, T., 2002, ApJL, 568, L5
- Kormendy (1977) Kormendy, J., 1977, ApJ, 218, 333
- Kronawitter et al. (2000) Kronawitter, A., Saglia, R.P., Gerhard, O. & Bender, R. 2000, A&As, 144, 53 (K00)
- Kuntschner et al. (2001) Kuntschner H., Lucey J.R., Smith R.J., Hudson M.J. & Davies R.L., 2001, MNRAS, 323, 615
- Lake, Schommer, & van Gorkom (1990) Lake, G., Schommer, R.A., & van Gorkom, J.H., 1990, AJ, 99, 547
- Loewenstein & White (1999) Loewenstein, M. & White, R.E., 1999, ApJ, 518, 50
- Łokas (2001) Łokas, E.L., 2001, MNRAS, 327, L21
- Magorrian & Ballantyne (2001) Magorrian, J. & Ballantyne, D., 2001, MNRAS, 322, 702 (MB01)
- Mamon & Łokas (2004a) Mamon, G.A. & Łokas, E.L., 2004a, MNRAS, submitted [preprint astro-ph/0405466]
- Mamon & Łokas (2004b) Mamon, G.A. & Łokas, E.L., 2004b, MNRAS, submitted [preprint astro-ph/0405491]
- Marchesini et al. (2002) Marchesini D., D’Onghia E., Chincarini G., Firmani C., Conconi P., Molinari E., Zacchei A., 2002, ApJ, 575, 801
- Maraston (1998) Maraston, C., 1998, MNRAS, 300, 872
- Marinoni & Hudson (2002) Marinoni, C. & Hudson, M.J., 2002, ApJ, 569, 101
- Martimbeau, Carignan, & Roy (1994) Martimbeau, N., Carignan, C., & Roy, J.R., 1994, AJ, 107, 543
- Mateo (1998) Mateo, M.L., 1998, ARA&A, 36, 435
- Matsushita et al. (2002) Matsushita, K., Belsole, E., Finoguenov, A. & Böhringer, H. 2002, A&A, 386, 77
- Méndez et al. (2001) Méndez, R.H. et al., 2001, ApJ, 563, 135 (M01)
- McGaugh, Barker & de Blok (2003) McGaugh S.S., Barker M.K., de Blok W.J.G., 2003, ApJ, 584, 566
- Meza et al. (2003) Meza, A., Navarro, J.F., Steinmetz, M. & Eke, V.R., 2003, ApJ, 590, 619
- Mo & Mao (2004) Mo, H.J. & Mao, S., 2004, MNRAS, 353, 829
- Moore et al. (1999) Moore B., Quinn T., Governato F., Stadel J., Lake G., 1999, MNRAS, 310, 1147
- Morganti et al. (1997) Morganti, R., Sadler, E.M., Oosterloo, T., Pizzella, A., & Bertola, F., 1997, AJ, 113, 937
- Morganti, Oosterloo, & Tsvetanov (1998) Morganti, R., Oosterloo, T., & Tsvetanov, Z., 1998, AJ, 115, 915
- Myers et al. (1995) Myers, S.T., et al., 1995, ApJL, 447, L5
- Napolitano et al. (2002) Napolitano N.R., Arnaboldi M., Capaccioli M., 2002, A&A, 383, 791 (NAC02)
- Napolitano et al. (2004) Napolitano N.R., et al., 2004, IAUS, 220, 173 [preprint astro-ph/0310798]
- Navarro et al. (1996) Navarro J.F., Frenk C.S., White S.D., 1996, ApJ, 462, 563 (NFW)
- Navarro et al. (1997) Navarro J.F., Frenk C.S., White S.D., 1997, ApJ, 490, 493 (NFW)
- Navarro et al. (2004) Navarro J.F. et al., 2004, MNRAS, 349, 1039
- Nieto & Bender (1989) Nieto J.L., Bender R., 1989, A&A, 215, 266
- Oosterloo et al. (2002) Oosterloo, T. A., Morganti, R., Sadler, E. M., Vergani, D., & Caldwell, N., 2002, AJ, 123, 729
- O’Sullivan & Ponman (2004a) O’Sullivan, E. & Ponman, T.J., 2004a, MNRAS, 349, 535
- O’Sullivan & Ponman (2004b) O’Sullivan, E. & Ponman, T.J., 2004b, MNRAS, 354, 935
- Padmanabhan et al. (2004) Padmanabhan N. et al., 2004, New Astronomy, 9, 329
- Pahre, Djorgovski & de Carvalho (1995) Pahre M.A., Djorgovski S.G., de Carvalho R.R., 1995, ApJ, 453, L17
- Pahre, Djorgovski & de Carvalho (1998) Pahre M.A., Djorgovski S.G., de Carvalho R.R., 1998, AJ, 116, 1591
- Pellegrini (1999) Pellegrini S., 1999, A&A, 351, 487
- Peng, Ford & Freeman (2004) Peng E.W., Ford H.C., Freeman K.C., 2004, ApJ, 602, 685 (P04)
- Press et al. (1992) Press W.H., Teukolsky S.A., Vetterling W.T. & Flannery B.P., 1992, Numerical Recipes in C, 2nd Ed. (Cambridge Univ. Press)
- Ravindranath et al. (2001) Ravindranath S. et al., 2001, ApJ, 122, 653
- Richtler et al. (2004) Richtler T. et al., 2004, AJ, 127, 2094 (R04)
- Romano et al. (2002) Romano, D., Silva, L., Matteucci, F., & Danese, L., 2002, MNRAS, 334, 444
- Romanowsky & Kochanek (2001) Romanowsky A.J., Kochanek C.S., 2001, ApJ, 553, 722 (RK01)
- Romanowsky et al. (2003) Romanowsky A.J. et al., 2003, Science, 301, 1696 (R03)
- Rusin, Kochanek, & Keeton (2003) Rusin D., Kochanek C.S., Keeton C.R., 2003, ApJ, 595, 29
- Saglia et al. (2000) Saglia R.P., Kronawitter A., Gerhard, O., Bender R., 2000, AJ, 119 153 (S00)
- Sáiz, Domínguez-Tenreiro & Serna (2004) Sáiz A., Domínguez-Tenreiro R., Serna A., 2004, ApJ, 601, L131
- Shen et al. (2003) Shen S., Mo H.J., White S.D.M., Blanton M.R., Kauffmann G., Voges W., Brinkmann J., Csabai I., 2003, MNRAS, 343, 978
- Sommer-Larsen, Götz & Portinari (2003) Sommer-Larsen J., Götz M., Portinari L., 2003, ApJ, 596, 47
- Statler, Dejonghe & Smecker-Hane (1999) Statler T.S., Dejonghe H., Smecker-Hane T., AJ, 117, 126 (S99)
- Terlevich & Forbes (2002) Terlevich A.I., Forbes D.A., 2002, MNRAS, 330, 547
- Tonry et al. (2001) Tonry J.L., Dressler A., Blakeslee J.P., Ajhar E.A., Fletcher A.B., Luppino G.A., Metzger M.R., Moore C.B., 2001, ApJ, 546, 681
- Trager et al. (2000) Trager S.C., Faber S.M., Worthey G., González J.J., 2000, AJ, 120, 165
- Tremblay et al. (1995) Tremblay B., Merritt D., Williams T.B., 1995, ApJ, 443, L5 (T95)
- Treu & Koopmans (2004) Treu, T. & Koopmans, L.V.E., 2004, ApJ, 611, 739
- Trujillo, Burkert & Bell (2004) Trujillo I., Burkert A., Bell E. F., 2004, ApJ, 600, L39
- Tully (1988) Tully, R. B., 1988, Nearby Galaxies Catalog (Cambridge Univ. Press)
- van den Bosch, Mo & Yang (2003) van den Bosch F.C., Mo H.J., Yang X., 2003, MNRAS, 345, 923
- van den Bosch et al. (2004) van den Bosch F.C., Norberg P., Mo H.J., Yang X., 2004, MNRAS, 352, 1302
- van der Marel (1991) van der Marel R.P., 1991, MNRAS, 253, 710 (M91)
- Verolme et al. (2002) Verolme E.K. et al., 2002, MNRAS, 335, 517 (V02)
- Walcher et al. (2003) Walcher, C.J., Fried, J.W., Burkert, A., & Klessen, R.S., 2003, A&A, 406, 847
- Wechsler et al. (2002) Wechsler R.H., Bullock J.S., Primack J.R., Kravtsov A.V., Dekel A., 2002, ApJ, 568, 52
- Weinberg et al. (2004) Weinberg, D.H., Davé, R., Katz, N., & Hernquist, L., 2004, ApJ, 601, 1
- Whitmore, Forbes & Rubin (1988) Whitmore, B.C., Forbes, D.A., & Rubin, V.C., 1988, ApJ, 333, 542
- Worthey (1994) Worthey, G., 1994, ApJs, 95, 107
- Wright et al. (2004) Wright, L.J., Ostriker, J.P., Naab, T. & Efstathiou, G., 2004, submitted to MNRAS [preprint astro-ph/0310513]