The nearby universe observed in far-infrared and in ultraviolet: an analysis of the dust attenuation and the star formation activity
Abstract
We discuss the dust attenuation and the star formation rates in the nearby universe obtained from a comparison of far-infrared (IRAS) and ultraviolet (GALEX) observations. The ratio of the dust to UV flux ratio is used to derive the dust attenuation: this dust attenuation is found to increase with the luminosity of the galaxies and from z=0 to z=1. The slope of the UV continuum is found to be a very poor tracer of the dust attenuation in ”normal” galaxies. Galaxies selected by their UV emission are found to be rather quiescent with a recent star formation rate equal to only 25-30% of the past averaged one. Galaxies selected in FIR appear slightly more active in star formation.
1 Introduction
The measure of the star formation rate (SFR) in galaxies is based on the
analysis of the emission from young stars which escapes the galaxies or is
absorbed and re-emitted by the gas or the dust.
It might be thought that the most direct tracer is the UV light emitted by
young
stars but the attenuation of this UV light by the dust absorption prevents
from any quantitative estimate of the SFR with the UV emission if no
correction for this attenuation is applied. To estimate this dust
attenuation has long been recognized as a crucial issue. Calzetti, Meurer and
collaborators showed that the UV continuum from 1200 Åto 2500Åcan be fitted by a power-law in starburst galaxies
() (calz ); the slope of the
UV continuum was found to be tightly related to the dust attenuation in
nearby
starburst galaxies (e.g.meureretal ). Nevertheless, it appeared that the
method
was not valid for all types of galaxies: nearby spirals as well as Ultra
Luminous Infrared Galaxies do not follow the starburst relation bell
goldaderetal .
Another way to estimate the dust attenuation is to perform an energetic budget:
the UV light which does not
escape the galaxy is absorbed by the interstellar dust and re-emitted in the
far-IR. Therefore both emissions originate from the same stellar populations
and their comparison is a powerful tracer of the dust attenuation (
buatxu gordonetal ). They are also
closely related to the recent star formation rate over similar timescales
(buatxu kennicutt ).
In this paper, we
will combine the UV and IR emissions and we will
combine the new GALEX data together with the existing far-IR data from IRAS to
discuss the dust attenuation and star formation activity of galaxies
2 The GALEX and IRAS data
We have worked on 600 deg2 observed by GALEX in NUV ( = 2310 Å) and FUV ( = 1530 Å) to build two samples of galaxies. The first one, called the NUV selected sample includes all the galaxies brighter than m(NUV) = 16 mag (AB scale), among the 88 selected galaxies (excluding ellipticals and active galaxies) only 3 are not detected by IRAS at 60 . The second sample, called the FIR selected sample is based on the IRAS PSCz (saundersetal ): 118 galaxies from this catalog lie within our GALEX fields, only 1 is not detected in NUV.
3 Dust attenuation in galaxies
3.1 Mean values of the dust attenuation
For both samples we measure the dust attenuation using the dust to UV flux ratio. This ratio is a quantitative measure of the dust attenuation at UV wavelengths. It has been shown to be robust against variations of the dust properties and of the star formation rate as long as stars are formed actively in galaxies(e.g. buatxu bua05 gordonetal ). The formulae used here are obtained for the GALEX bandpasses (bua05 ).
| (1) |
where . and
| (2) |
where .
The total (8-1000 ) dust
emission is calculated from the fluxes at 60 and 100 using the Dale et
al. (daleetal ) recipe. The NUV fluxes are calculated as and therefore and
are unitless
.
A moderate attenuation is found in the NUV selected sample with
mag in NUV and and mag in FUV. As
expected the dust attenuation is higher in the FIR selected sample with
mag in NUV and mag in FUV.
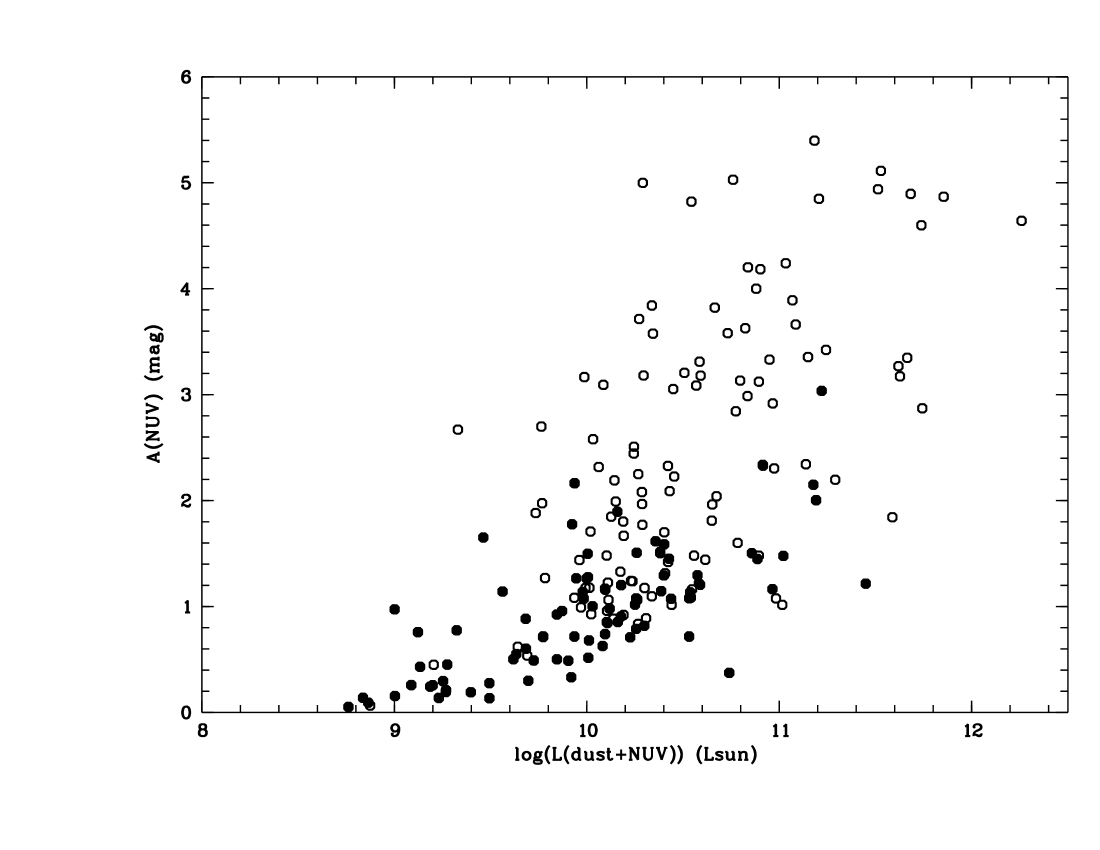
3.2 Dust attenuation & bolometric luminosity of galaxies
Hereafter the dust and the NUV luminosities are added to give an estimate of the bolometric luminosity of the galaxies in Fig 1. This luminosity is plotted against the dust attenuation in NUV for the NUV selected and the FIR selected samples. A clear increase of the dust attemuation with the luminosity of the galaxies is obtained although the trend is dispersed for the IR selected sample.
3.3 The slope of the UV continuum as a tracer of the dust attenuation
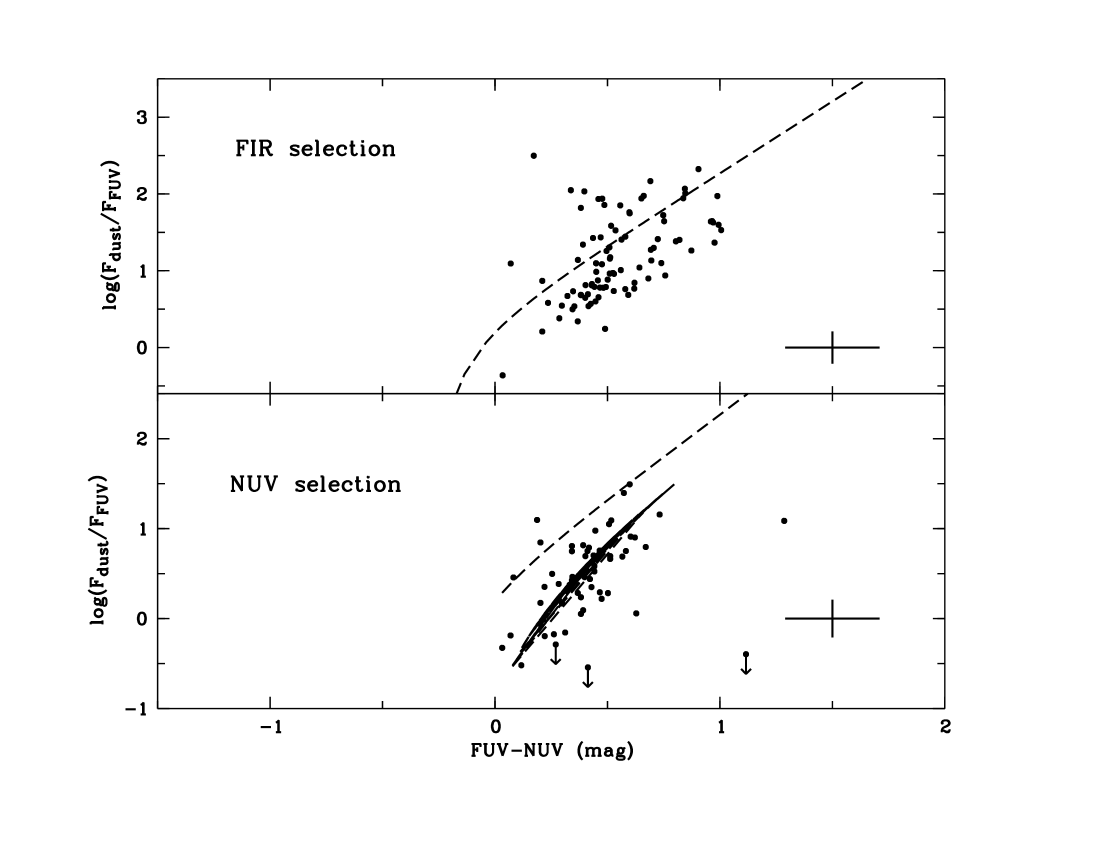
The FUV-NUV color from the GALEX observations is directly linked to (kongetal ). We have plotted this color versus F(dust)/F(FUV) for our two samples of galaxies in Fig. 2 and compared to the predictions for starburst galaxies meureretal . Obviously is not a reliable tracer of the dust attenuation in our NUV and FIR selected samples. Moreover, different behaviors are found within both samples: whereas the FIR selected galaxies spread over a large area of the diagram most of the NUV selected galaxies lie below the starburst relation.
3.3.1 The NUV selected sample
Let us focus on the behavior of galaxies from the NUV selected sample. Kong et al. kongetal have explored the effect of various star formation histories on the correlation found originaly for starburst galaxies. They showed that assuming a decrease of the global star formation activity lead to redder FUV-NUV colors for a similar dust attenuation as compared to a constant star formation rate or a current star burst. In Fig 2 we reproduce the results of their model obtained for a ratio of the present to the past averaged SFR (the so called b parameter) equal to 0.25. The model is consistent with our data: the NUV selection does not seem to favour galaxies very active in star formation at least in the nearby universe.
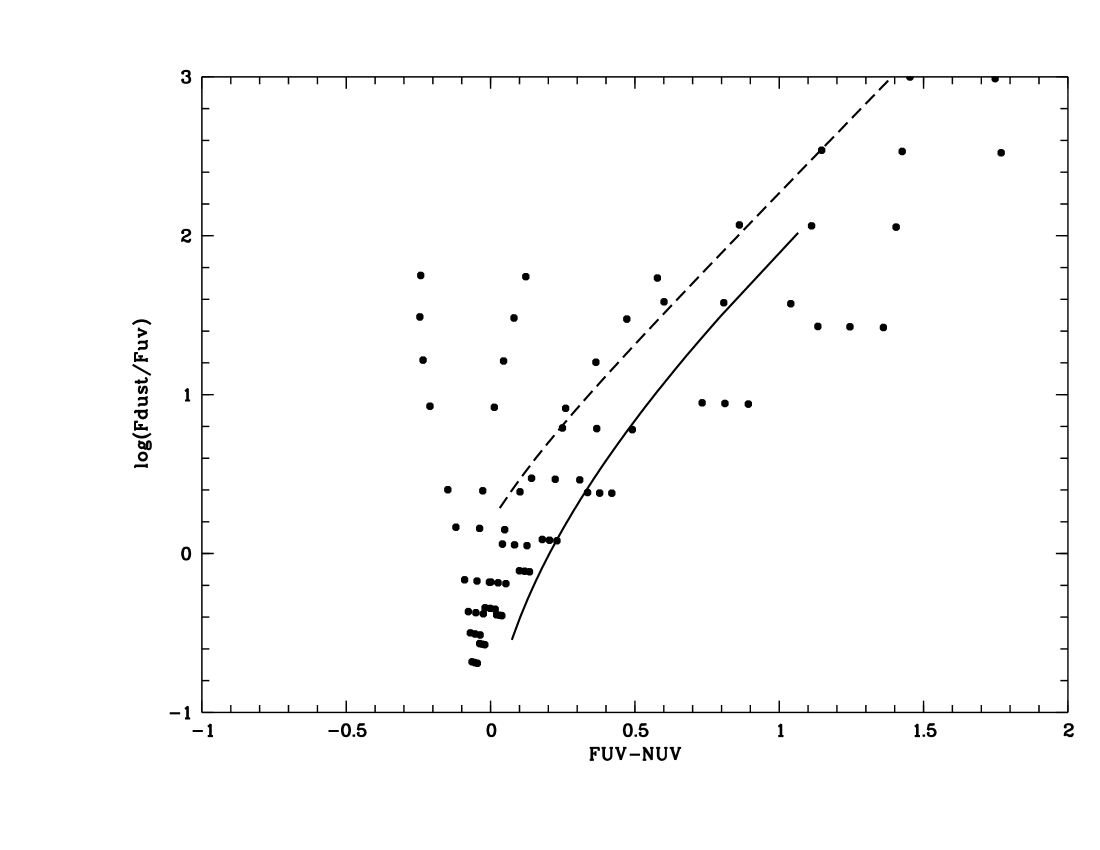
3.3.2 The effect of the dust properties
Two factors are expected to have a large effect on the FUV-NUV color: the star
formation history and the dust properties. Kong et al kongetal have
explored the first factor (see above) but a variation of the dust attenuation
curve has
also to be explored. We have used the Charlot and Fall charlot
formalism and assumed a power law variation of the optical depth of the dust:
allowing n to vary from 2 to 0.5 (whereas
Charlot and Fall fixed n to 0.7 from an analysis of starburst galaxies). The
NUV bandpass of GALEX is well centered on the Galactic bump at 2175 Å,
therefore if such a bump exists in external galaxies it may have a strong
effect on the
FUV-NUV color. Therefore we also simulate the bump by adding a Gaussian curve
centered on 2175 Å(amplitude variable and =200 Å) to the power
law variation of the optical
depth and simulating the bump. In Fig 3 are presented the results of this
model for a
continous star formation rate (using the PEGASE synthesis model fioc ).
The solid line is
the locus of starburst galaxies and the dashed one the prediction of Kong et
al for b=0.25. Whereas the only way to obtain redder FUV-NUV colors with a low
dust attenuation seems to assume a quiescent current star formation, a
variable dust attenuation curve alone (with a constant star formation rate)
can also explain the behavior of many galaxies in Fig. 2
Therefore a complete interpretation of the data will need to consider both
temporal variations of the star formation history and spectral variation of
the dust attenuation among galaxies (Burgarella et al. in preparation).
3.4 The mean dust attenuation from z0 to z1
A comparison of the FIR and UV luminosity densities from IRAS (saundersetal2 ) and GALEX (wyder ) leads to a mean dust attenuation at z0 of 1.1 mag in NUV and 1.5 mag in FUV: the nearby universe is not very obscured bua05 . With the recent results of GALEX we can also perform the analysis from z=0 to .The dust emission is derived from Chary & Elbaz chary : we translate the results of their model for the evolution of the obscured star formation rate in dust luminosity density using the formulae given in their papers. The rest-frame FUV luminosity density as a function of z is taken from (schimi, ). The dust to FUV luminosity density ratios thus calculated are translated in dust attenuation using the relation (1). The results are gathered in Tab. 1. A clear increase of the mean dust attenuation with the redshift is observed: the dust luminosity density increases more than the UV one with the redshift leading to an increase of the global dust attenuation by 1 mag from z=0 to z¿0.5.
4 Recent star formation rate & star formation activity
4.1 The measure of the recent star formation rate
UV and total dust emissions can be calibrated in a recent star formation rate assuming a star formation history over years and an initial mass function buatxu kennicutt . When using the dust luminosity one must add an additional hypothesis about the absorption of the stellar light by the dust. The classical hypothesis (also made in this work) is that all the stellar light from the young stars is absorbed by the dust kennicutt . In this paper we also assume a Salpeter IMF from 1 to 100 M. Using Starburst99 synthesis models we obtain:
| (3) |
and
| (4) |
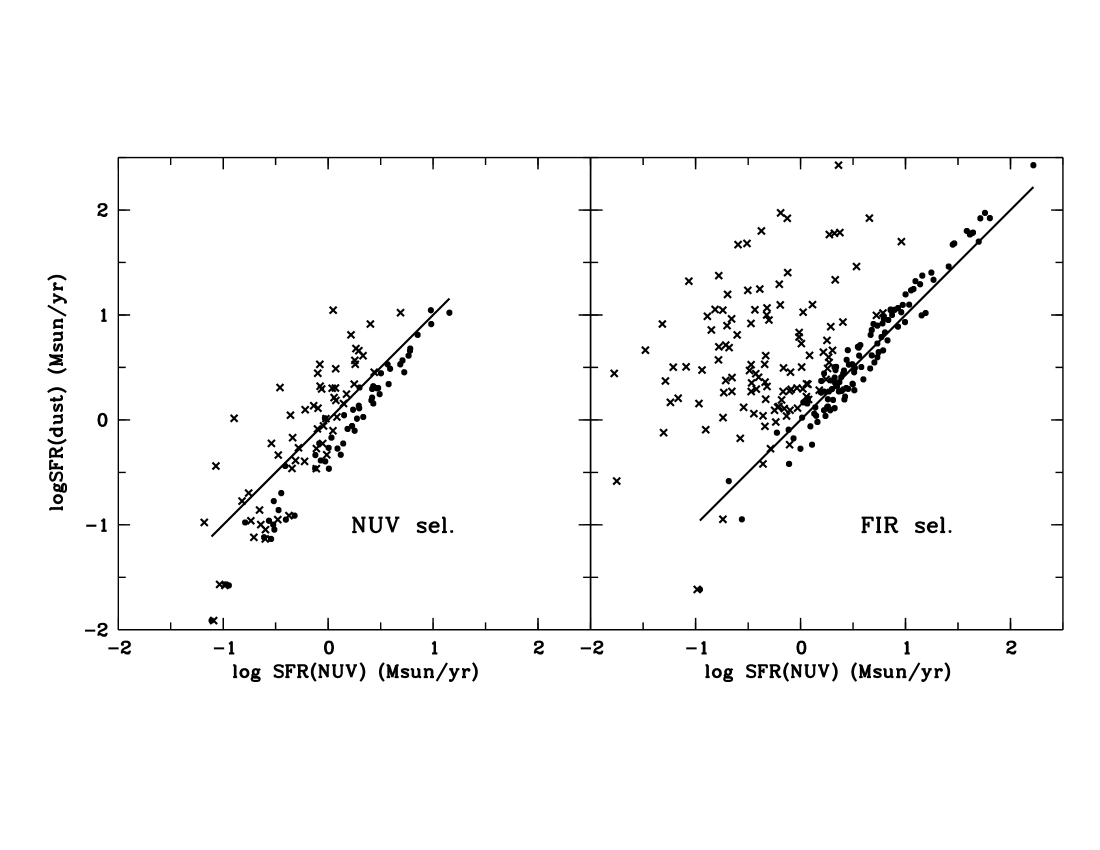
In Fig 4 are plotted the SFR estimated from the NUV luminosity against the SFR from the dust luminosity. In both samples, the observed NUV luminosity strongly under-estimates the SFR the effect being worse for the FIR selected sample. When the UV fluxes of the FIR selected sample are corrected for dust attenuation the agreement is very good (as expected) between both estimates of the SFR since we are dominated in each case by the dust emission. Conversely in the NUV selected sample the SFR estimated from the dust luminosity alone is found to underestimate systematically the SFR as compared to the NUV corrected luminosity. The discrepancy increases towards the low SFRs to reach a factor 3 for SFR of 0.3 M. Therefore, using the dust emission alone to measure the total SFR in all galaxies can be misleading, the best way being to combine UV and IR emissions to estimate reliable SFRs iglesias
4.2 Star formation activity
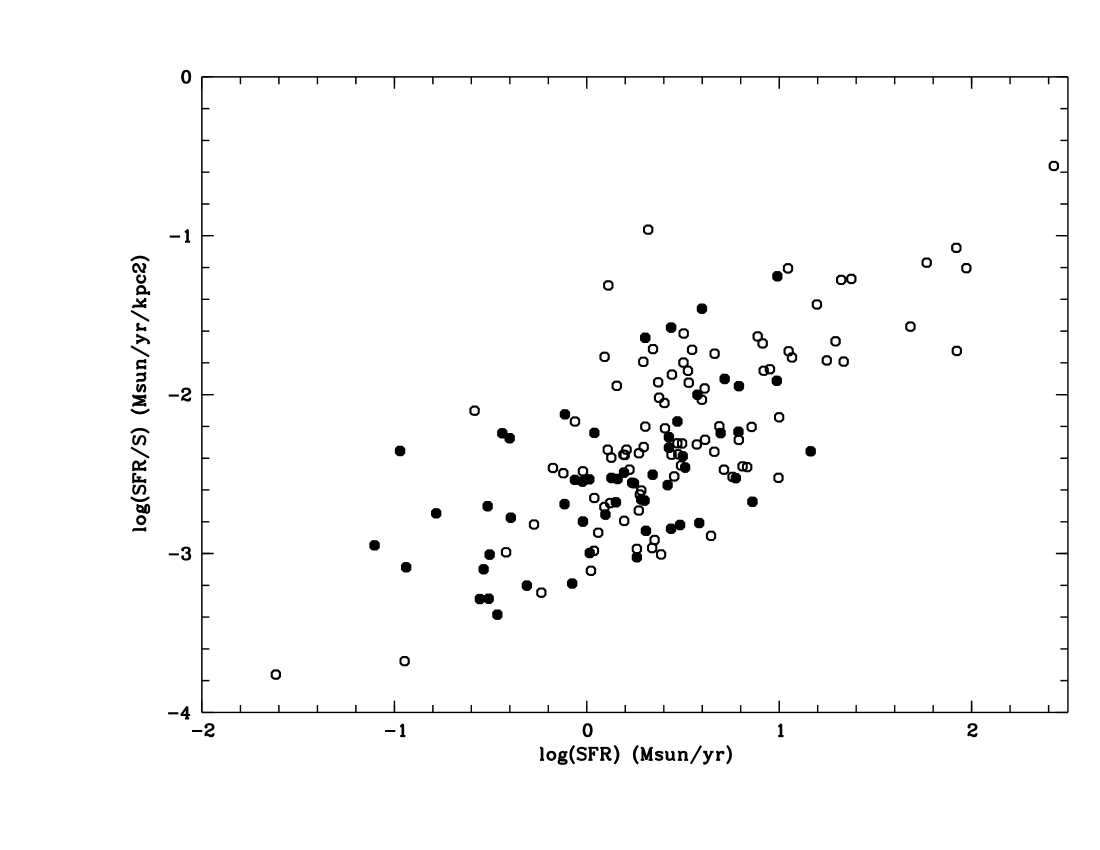
We can compare the strength of the star formation in the NUV and FIR selected
samples by plotting the SFR per unit area in both samples as a function of the
total star formation rate. For the NUV selected sample the SFR is obtained from
the NUV fluxes corrected for dust attenuation and using the formula (3); for
the FIR selected sample we use the total dust emission and formula (4). The
results are shown in Fig 5. The FIR selected
galaxies appear more active than the NUV selected ones both in terms of total
SFR and surface density of star formation. No strong starbursts is selected in
either sample: starbursts are characterized by a SFR per unit area larger than
0.1 (Kennicutt 2004, in Starbursts-From 30 Doradus to Lyman
Break Galaxies) and only two galaxies selected
in FIR exhibit such a value.
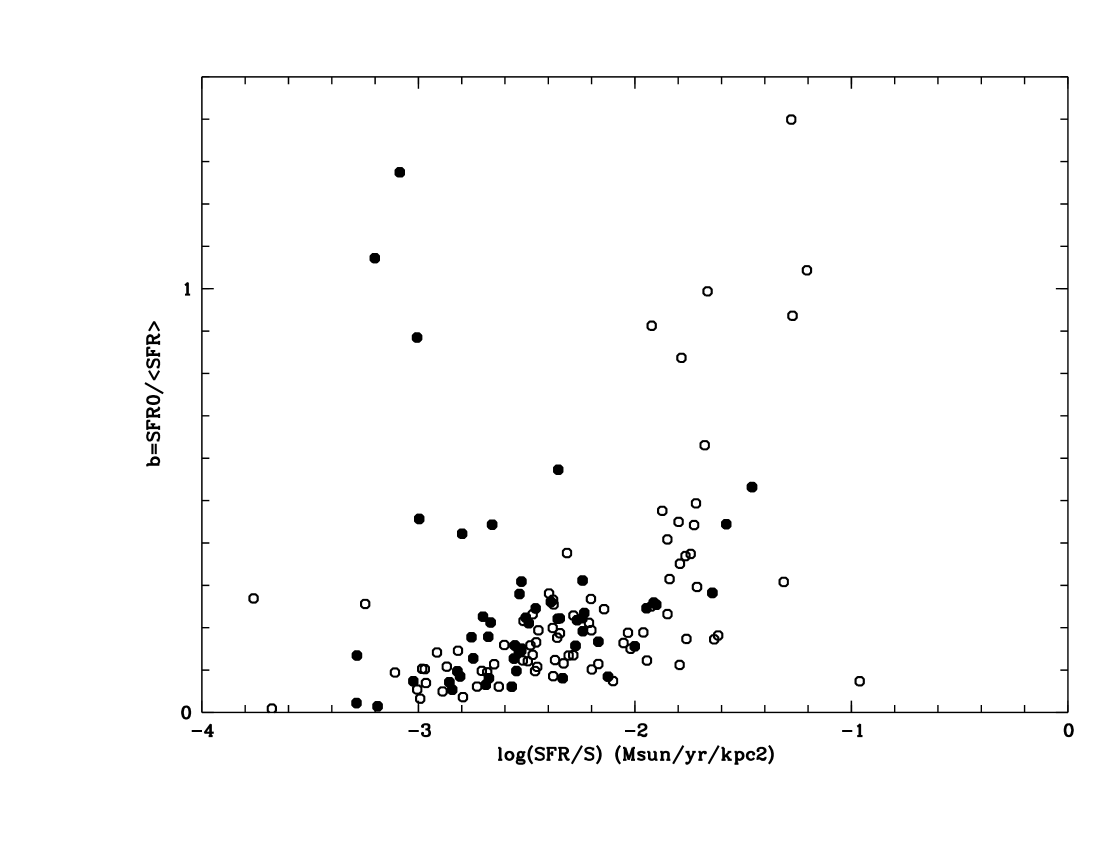
We can also calculate the b parameter (the ratio of the present SFR to the past
averaged one) by using the H magnitude from the 2MASS survey. Using the
calibration from boselli we obtain a mean b parameter of for the NUV selected sample and for the FIR selected
sample (Fig. 6). Once again the FIR selected galaxies seem to be slightly more
active than the NUV selected ones. The b parameters found for the NUV selected
sample are consistent with the value of the model of Kong et al.
(kongetal ) used to fit
our data in Fig 2.
5 conclusions
FIR and UV emissions are complementary to obtain reliable estimates of
the dust attenuation and of the star formation rate in galaxies. Using the FIR
or the UV alone can lead to errors: on one hand the star formation rate of
galaxies selected in UV is under-estimated by a
factor which can reach 3 using the FIR alone, on the other hand for the
vast majority of the
galaxies the UV must be corrected for dust attenuation before any quantitative
use. Therefore the best estimate of the star formation rate is probably to add
the observed FIR and UV contributions.
A FIR or a NUV selection in the nearby universe does not select
starbursts, FIR selected galaxies are found slightly more active in SFR than
the NUV selected ones. NUV selected galaxies have a mean ratio of the present
SFR to the past averaged one of 0.2-0.3
The dust attenuation measured by comparing the dust and UV emissions is found
to increase with the total luminosity of the galaxies. The interpretation of
the F(dust)/F(NUV) vs FUV-NUV diagramm (i.e. the dust attenuation vs the
slope of
their UV continuum) is difficult and depends on the dust properties and the
star formation history in a complex way.
The mean dust attenuation appears to increase from z=0 to z1 by
more than 1 mag.
References
- (1) Bell, E. 2002, ApJ 577, 150
- (2) Boselli, A., Gavazzi, G., Donas, J. & Scodeggio, M. 2001, AJ 121, 753
- (3) Buat, V., Xu, C. 1996, A & A, 306, 61
- (4) Buat, V., …Xu, C. 1999, A & A,
- (5) Buat, V., Iglesias-Paramo, J., Seibert, M. et al. 2005, ApJL in press
- (6) Calzetti, D., Kinney, A., Storchi-Bergmann, T. 1994, ApJ 352, 371
- (7) Charlot. S., Fall, M. 2000 ApJ 539, 718
- (8) Chary, R., Elbaz, D. 2001, ApJ 556, 562
- (9) Dale, D., Helou, G., Contursi, A., Silbermann, N., Kolhatkar, S. 2001, ApJ, 549, 215
- (10) Fioc, M., Rocca-Volmerange, B. 1997, A& A 326, 950
- (11) Goldader,J., D., Meurer, G., Heckman, T., M., Seibert, M., Sanders, D. B., Calzetti, D., Steidel, C., C. 2002, ApJ 568, 651
- (12) Gordon, K, Clayton, G., Witt, A., Misselt, K 2000, ApJ 533, 236
- (13) Iglesias-Páramo, J., Buat, V., Donas, J., Boselli, A., Milliard, B. 2004, A& A 419, 109
- (14) Kennicutt, R. 1998, ARAA 36, 189
- (15) Kong, X., Charlot, S., Brinchmann, J., Fall, M. 2004, MNRAS 349. 769
- (16) Meurer, G. R., Heckman, T. M., & Calzetti, D. 1999, ApJ, 521, 64
- (17) Saunders, W. et al. 2000, MNRAS 317, 55
- (18) Saunders, W., Rowan-Robinson, M., Lawrence, A. et al. 1990, MNRAS 242, 318
- (19) Schiminovich, D., Arnouts, S., Ilbert, O. et al. 2005, ApJL in press
- (20) Wyder, T., Treyer, M., Milliard, B. et al. 2005, ApJL in press