A radio study of the superwind galaxy NGC 1482
Abstract
We present multifrequency radio continuum as well as H i observations of the superwind galaxy NGC1482, with both the Giant Metrewave Radio Telescope (GMRT) and the Very Large Array (VLA). This galaxy has a remarkable hourglass-shaped optical emission line outflow as well as bi-polar soft X-ray bubbles on opposite sides of the galactic disk. The low-frequency, lower-resolution radio observations show a smooth structure. From the non-thermal emission, we estimate the available energy in supernovae, and examine whether this would be adequate to drive the observed superwind outflow. The high-frequency, high-resolution radio images of the central starburst region located at the base of the superwind bi-cone shows one prominent peak and more extended emission with substructure. This image has been compared with the infrared, optical red-continuum, H, and, soft and hard X-ray images from Chandra to understand the nature and relationship of the various features seen at different wavelengths. The peak of infrared emission is the only feature which is coincident with the prominent radio peak, and possibly defines the centre of the galaxy.
The H i observations with the GMRT show two blobs of emission on opposite sides of the central region. These are rotating about the centre of the galaxy and are located at 2.4 kpc from it. In addition, these observations also reveal a multicomponent H i-absorption profile against the central region of the radio source, with a total width of 250 km s-1. The extreme blue- and red-shifted absorption components are at 1688 and 1942 km s-1 respectively, while the peak absorption is at 1836 km s-1. This is consistent with the heliocentric systemic velocity of 185020 km s-1, estimated from a variety of observations. We discuss possible implications of these results.
keywords:
galaxies: individual (NGC1482) – galaxies: active – galaxies: starburst – galaxies: kinematics and dynamics – radio continuum: galaxies – radio lines: galaxies| RA (J2000)b | DEC (J2000)b | Typec | a bd | Vsyse | if | log(LFIR)g | Dh |
| (h m s) | (∘ ′ ′′) | (′ ′) | (km s-1) | (∘) | (L⊙) | (Mpc) | |
| 03 54 38.92 | 20 30 07.6 | SA0/a | 2.5 1.4 | 185020 | 58 | 10.66 | 24.7 |
Taken from the NASA Extragalactic Database (NED), unless stated otherwise. The position of radio peak from our high-resolution, VLA A-array, 8460 MHz image Morphological type. Optical major and minor axes. Heliocentric optical systemic velocity (Veilleux & Rupke, private communication). This is consistent with H i observations of Roth et al. (1991) and those presented in this paper. Inclination angle, from Strickland et al. (2004). Log of the far infra-red luminosity (Condon et al. 1990) using the revised distance. Distance estimated using the galaxy recessional velocity with respect to the cosmic microwave background radiation and H0=71 km s-1 Mpc-1 (Spergel et al. 2003). For this distance 1′′=120 pc.
1 Introduction
Galactic-scale outflows along the minor-axes of nearby edge-on galaxies have been observed over a wide frequency range extending from radio continuum to X-ray wavelengths. The more prominent outflows with an outflow mass and kinetic energy of approximately M⊙ and ergs respectively are often referred to as superwinds, and these have been observed over a wide range of redshifts (e.g. Heckman, Armus & Miley 1990; Pettini et al. 2001; Veilleux 2002a, 2003). The superwind could contain different phases of the metal enriched interstellar medium (ISM) such as hot X-ray emitting gas, warm ionized gas emitting ultraviolet (UV) and optical emission lines, synchrotron emitting relativistic plasma and magnetic fields, dust, as well as H i and molecular gas (Dahlem 1997; Strickland 2001). These superwinds play an important role in heating and supplying kinetic energy to the Inter Galactic Medium (IGM) and enriching it with metals. Many of these outflows are interpreted as the combined effect of numerous supernovae and stellar winds in the nuclear starforming region of the parent Seyfert or starburst galaxy. An active galactic nucleus (AGN) or winds from the tori in the nuclear regions could also contribute to the observed outflows (Heckman et al. 1990; Balsara & Krolik 1993; Baum et al. 1993; Krolik & Kriss 1995; Colbert et al. 1996a,b; Weaver 2001; Veilleux 2002b).
In this paper we present a detailed radio study of the interesting superwind galaxy NGC1482, which has received relatively little attention. The basic properties of this galaxy are summarised in Table 1. In an emission-line survey of early-type spirals Hameed & Devereux (1999) noticed the presence of “filaments and/or chimneys of ionized gas extending perpendicular to the disk”. Veilleux & Rupke (2002) imaged the galaxy in H and N ii and highlighted the remarkable hourglass-shaped optical emission line outflow with a velocity of 250 km s-1. They estimated the energy in the optical emission-line outflow to be at least 2 ergs. The ionization ratios of the gas in the superwind have been interpreted to be due to shock formation in the outflow. More recently, Veilleux et al. (2003 and private communication) have reported an outflow velocity of 460 km s-1 in one of the filaments. The soft X-ray image from the Chandra Observatory also exhibits bipolar emission along a similar axis to that of the optical hourglass-shaped structure (Strickland et al. 2004).
We have studied this galaxy at radio continuum wavelengths ranging from 335 MHz to 14965 MHz as well as in H i using both the GMRT and the VLA. While VLA images at 1.49 GHz have been presented by Condon et al. (1990), continuum observations at lower and higher frequencies as well as H i images have been presented here for the first time. The objectives of the observations were to clarify the radio structure, constrain the energetics and explore evidence of outflow at radio wavelengths. We first briefly describe the observations in Section 2. The large-scale radio structure, its comparison with the images at other wavelengths, and some of the implications are discussed in Section 3. The small-scale radio structure and a comparative study of this with features seen at other wavelengths are also presented in Section 3. Section 4 describes the H i observations, where we report the detection of both emission and absorption lines, discuss these results and compare with the spectral information at optical and CO wavelengths. In Section 5 we summarise the conclusions.
2 Observations and Data analyses
The observing log for both the GMRT and VLA observations is presented in Table 2, which is arranged as follows. Column 1: Name of the telescope where we also list the configuration for the VLA observations. Column 2: The frequency of the observations where H i denotes spectral line observations centred at an observed frequency of 1412 MHz. Columns 3 and 4: Dates of the observations and the time, t, spent on the source. Columns 5 and 6: The phase calibrator used and its flux density. A conservative estimate of the error in the flux density is approximately 10% at 335 and and 5% at the higher frequencies.
| Telescope | Freq. | Obs. | t | Phase | Scal. |
|---|---|---|---|---|---|
| MHz | date | min | Calib. | Jy | |
| GMRT | 335 | 2002Aug17 | 60 | 0521207 | 9.67 |
| GMRT | 615 | 2003Mar07 | 180 | 0453281 | 2.21 |
| VLA-BnA | 1365 | 2002May20 | 25 | 0416188 | 2.85 |
| GMRT | 1409,H i | 2002Nov16 | 180 | 0453281 | 1.99 |
| VLA-A | 4860 | 2003Jun26 | 54 | 0416188 | 0.68 |
| VLA-BnA | 8460 | 2002May20 | 23 | 0416188 | 0.68 |
| VLA-A | 8460 | 2003Jun26 | 60 | 0416188 | 0.83 |
| VLA-A | 14965 | 2003Jun26 | 20 | 0348278 | 1.02 |


2.1 GMRT
The GMRT consists of thirty antennas, each of 45 m diameter, in an approximate ‘Y’ shape similar to the VLA but with each antenna in a fixed position. Twelve antennas are randomly placed within a central 1 km by 1 km square (the “Central Square”) and the remainder form the irregularly shaped Y (6 on each arm) over a total extent of about 25 km. Further details about the array can be found at the GMRT website at http://www.gmrt.ncra.tifr.res.in. The observations were made in the standard fashion, with each source observation interspersed with observations of the phase calibrator. The primary flux density calibrator was 3C286 whose flux density was estimated on the Baars et al. (1977) scale, using the latest (1999.2) VLA values. The bandwidth of the continuum observations at 335 and 615 MHz was 16 MHz, while for the L-band observations it was 8 MHz. The data analyses were done using the Astronomical Image Processing System (AIPS) of the National Radio Astronomy Observatory. Since GMRT data is acquired in the spectral-line mode, gain and bandpass solutions were applied to each channel before combining them. The 335 MHz observations were affected by ionospheric phase fluctuations. A significant amount of data had to be edited, and the first round of phase self-calibration was done assuming a point source model. In the subsequent runs of self-calibration the image of the target source was used as the model. The position of the source was determined by aligning its peak with that of the 615 MHz image.
The analyses of the H i observations were also done in the standard way. 3C286 was the primary flux density and bandpass calibrator. The total bandwidth for H i observations was 8 MHz and the spectral resolution was 62.5 kHz, which corresponds to 13.3 km s-1 in the centre of the band. We discarded any antennas with more than 3 fluctuations in the bandpass gains during the observations. A few channels in the beginning and approximately ten channels towards the end were also not included in the analyses. The AIPS task UVLIN was used for continuum subtraction and the multi-channel data were then CLEANed using IMAGR.
Some of the observed parameters of the GMRT and the VLA continuum images are presented in Table 3 which is arranged as follows. Columns 1 and 2 are similar to that of Table 2, except that we also list the parameters from the NRAO VLA Sky Survey (NVSS). Columns 3 to 5: The resolution of the image with the major and minor axes being listed in arcsec and the position angle (PA) in degrees. Column 6: The rms noise in units of mJy/beam. Columns 7 and 8: The peak and total flux densities in units of mJy/beam and mJy respectively. In addition to the rms noise in the image, we also examined the change in flux density by varying the size of the box around the source. The error in the flux density is approximately 10% at 335 MHz and 5% at the higher frequencies.
2.2 VLA
The VLA observations were also made in the standard way with a phase calibrator being observed before and after each scan on a source. The primary flux density calibrator was 3C286. However, since 3C286 is significantly resolved on the longer baselines at 14965, 8460 and 4860 MHz with the VLA A-array, the following procedure was adopted. The flux density of 3C286 was calculated by the AIPS task SETJY. The flux density of the phase calibrator was estimated by comparing its visibility amplitude with those of 3C286 at the shorter baselines, over the uv ranges specified in the VLA Calibrator manual. These values of the phase calibrator flux density were incorporated using the task GETJY, and are also listed in Table 2. We attempted to make self-calibrated images for all the different data sets. However, the A-array images did not improve after self calibration. Therefore, BnA-array images presented here are self-calibrated ones, while the A-array ones are not.
3 Radio continuum emission
3.1 Large-scale structure
In Fig. 1 we show the optical R-band image of the galaxy (Strickland et al. 2004; and Strickland, private communication), our GMRT 335-MHz contour map superimposed on the optical image and our VLA BnA-array 1365-MHz image. The GMRT 335-MHz image, which has an angular resolution of 11.6 arcsec shows the source to be resolved with a deconvolved angular size of 148 arcsec along a PA of 107∘. Its angular dimensions are less than that of the optical galaxy, and shows no evidence of a large-scale outflow or halo due to diffusion of cosmic ray particles. This is consistent with the NVSS image where the source appears to be a single source with a 45 arcsec beam. The GMRT 615-MHz image is essentially similar to the 335-MHz image and is not shown here, although the flux density estimates are listed in Table 3. The somewhat higher-resolution VLA 1365-MHz image, which has a lower rms noise than the low-frequency GMRT images, shows the central region to be very clearly extended along a PA105∘, but again with no evidence of any large-scale diffuse emission.
A comparison of the radio image with the Chandra soft X-ray bubbles of plasma shows that the X-ray emission extends far beyond the radio extent as seen in the 335-MHz image (Fig. 2). The non-thermal synchrotron emission appears largely confined to the disk of the galaxy, with no significant emission from the outflowing superwind plasma.
The GMRT images do not appear to have missed significant emission from any diffuse component. A comparison of the GMRT flux densities with the known and reliable flux density measurements listed by NED (Fig. 3) shows that these values are consistent with the overall straight, non-thermal spectrum of the source with a spectral index, , of 0.82 (S) between 335 and 1400 MHz. We have not attempted to make a spectral index image from the low-resolution images since the number of beamwidths along the source is small.
Adopting the spectral index of 0.82 as the mean value over the region of emission, and assuming the synchrotron emission to have lower and higher cutoffs at 107 and 1010 Hz respectively, a proton to electron ratio of unity, a filling factor of unity and an oblate spheroidal distribution for the emitting region we estimate the minimum energy density and equipartiton magnetic field to be 5.910-11 ergs cm-3 and 25 G respectively. The radiative life time of an electron radiating in this field at 1.4 GHz is 2.2106 yr. These values are similar to estimates for nearby galaxies (e.g. Condon 1992). The proton to electron ratio is not well determined for external galaxies. For a value of 50 from studies of cosmic rays in our own Galaxy (e.g Webber 1991), the equipartition magnetic field would increase by a factor of 2.5.
Since the overall spectral index is steep, the contribution of the thermal fraction to the total emission is expected to be small. Using the expression due to Condon (1992) for the thermal fraction in spiral galaxies, as measured globally, we estimate that only 4, 7 and 11 per cent of the total emission could be due to thermal components at 335, 615 and 1400 MHz respectively. From the non-thermal emission, we estimate the supernova rate in this galaxy to be 0.14 yr-1 (Condon 1992). The supernova rate appears similar to estimates in other starburst galaxies such as 0.1 yr-1 for M82 (e.g. Huang et al. 1994), 0.1 to 0.3 for NGC253 (Ulvestad & Antonucci 1997), 0.1 yr-1 for the clumpy irregular starburst galaxy Mrk 325 (Condon & Yin 1990) and also for the starburst galaxy NGC3448 of the Arp 205 system (Noreau & Kronberg 1987) and 0.07 yr-1 for NGC6951 (Saikia et al. 2002).
We can examine whether the energy the from the estimated supernova rate is adequate to drive the observed superwind outflow. Adopting a value of 1051 ergs for the kinetic energy of a supernova, the available energy over the dynamical lifetime of the bubble, yr, is ergs. However, the energy which drives the outflow depends on the heating efficiency of the supernovae, i.e. the fraction of supernova energy which is not radiated away. In a classic paper, Larson (1974) estimates that approximately 10 per cent of the explosion energy is effectively transmitted to the gas. There is a wide range of values in the literature, with many of the simulations of galactic winds assuming a heating efficiency of 100 per cent. Melioli & de Gouveia Dal Pino (2004) note that this is often not consistent with the observations, and that the heating efficiency may be time dependent and sensitive to the initial conditions of the system, and cannot be assumed to be 100 per cent. For our purposes we assume an efficiency of 10 per cent, so that the available energy is ergs. Veilleux & Rupke (2002) estimate the kinetic energy involved in the outflow of the warm ionized gas to be 21053n ergs, where n is the number density in units of 100 cm-3. They estimate the number density of particles in the entrained material to be 100 cm-3 from their [S ii]6731/6716 line ratios. The total kinetic energy involved in the outflow could be significantly larger. In addition to the optical line-emitting gas and the known X-ray plumes, there could also be cold gas entrained in the flow. For example, for a sample of far-infrared bright, starburst galaxies, Heckman et al. (2000) estimate the kinetic energy in the cool gas to be 1055 ergs. In the case of NGC1482, we need a reliable estimate of total energy in the outflow before determining whether the observed supernova rate is adequate to drive the outflow.

| Telescope | Freq. | Beam size | rms | Spk | Stot. | ||
| MHz | maj. | min. | PA | mJy | mJy | mJy | |
| ′′ | ′′ | ∘ | /b | /b | |||
| GMRT | 335 | 11.6 | 11.6 | 0 | 2.24 | 370 | 723 |
| GMRT | 615 | 8.24 | 5.44 | 178 | 0.65 | 140 | 397 |
| VLA-BnA | 1365 | 5.13 | 2.23 | 62 | 0.17 | 35 | 198 |
| NVSS | 1400 | 45.0 | 45.0 | 0 | 0.50 | 23 | 224 |
| GMRT | 1409 | 2.96 | 2.01 | 25 | 0.60 | 21 | 218 |
| VLA-A | 4860 | 0.64 | 0.35 | 12 | 0.04 | 1.9 | 44 |
| VLA-BnA | 8460 | 1.06 | 0.55 | 46 | 0.07 | 1.3 | 25 |
| VLA-A | 8460 | 0.36 | 0.20 | 9 | 0.02 | 0.9 | 18 |
| VLA-A | 14965 | 0.20 | 0.11 | 5 | 0.09 | 0.3 | |


3.2 Small-scale structure
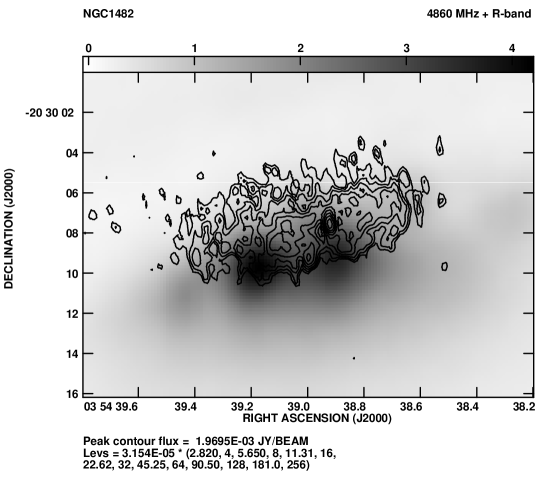
The 4860 MHz, VLA A-array image (Fig. 4) shows a prominent peak of emission with a brightness of 1.95 mJy/beam and more diffuse emission along a PA of 100∘, similar to the orientation of the galaxy. The diffuse emission is more prominent on the eastern side of the peak, the total flux density on this side being 27 mJy compared with 15 mJy on the western side. The brightest feature on the eastern side, which we call the secondary peak, is located at RA: 03 54 39.12, Dec: 20 30 08.60 and has a peak brightness of 0.65 mJy/beam. This image shows a sharper boundary on the southern side than on the northern one, as is also seen in the VLA BnA-array image at 1365 MHz (Fig. 1). The somewhat lower-resolution VLA BnA-array, 8460 MHz snap-shot image shows basically a similar structure with the peak brightness being 1.30 mJy/beam. Smoothing the 4860 MHz image to that of the BnA array 8460 MHz one yields a peak brightness of 2.38 mJy/beam and a spectral index of 1 for the prominent peak of emission. The spectral index of the central region between 4860 and 8460 MHz is also 1, showing that the entire region has a steep radio spectrum.


The expected brightness of this peak of emission at 14965 MHz with a similar resolution to that of the VLA BnA-array image is 0.7 mJy/beam. Its non-detection with a 3 upper limit of 0.3 mJy/beam in the image with a resolution of 0.15 arcsec is consistent with this. Although its steep spectral index does not suggest it to be an AGN, it is difficult to rule out the possibility of there being a weak AGN with more extended emission associated with it. It is relevant to note here that from optical spectroscopic observations, Kewley et al. (2000) have classified it to be a starburst galaxy without an AGN. The brightness temperature of the peak of emission, estimated from the 4860 MHz image (e.g. Condon et al. 1991) is only 630∘ K making it difficult to use it as a diagnostic to identify whether it is an AGN. The VLA A-array 8460 MHz image with a resolution of 0.27 arcsec shows the peak feature to have a possible extension to the south and again more emission on the eastern side of this peak (9 mJy) compared with the western side (6 mJy). The peak brightness here is 0.9 mJy/beam. The brightness temperature estimated for the peak is 740∘ K. The linear resolution in the VLA A-array 8460 MHz image is approximately 30 pc, and its peak luminosity is 6.51019 W Hz-1. The peak luminosity in the other regions of the source is typically 1018 W Hz-1. It is of interest to compare this with other galaxies. For example, the median luminosity at 8.4 GHz of the components observed in M82 which is at a distance of 3.4 Mpc is 21018 W Hz-1 (Huang et al. 1994; Allen & Kronberg 1998) when observed with a linear resolution of 3 pc. Considering a more distant galaxy, the median luminosity for the archetypal starburst galaxy in the southern hemisphere, NGC1808 (distance10.9 Mpc), is about 8 W Hz-1 with a linear resolution of 30 pc (Collison et al. 1994). The luminosities in NGC1482 appear similar to the discrete features in some of the well-known archetypal starburst galaxies.
3.3 Comparison with other wavebands
The high-resolution radio images, which define the structure of the circumnuclear starburst region, consist of one prominent peak of emission and several weaker secondary peaks. A superposition of the VLA 4860 MHz image on the optical, hourglass-shaped structure traced by the H emission (Fig. 5) shows that the starburst region lies at the base of this structure, and possibly provides the energy to drive the outflow. The 4860 MHz image and the two H peaks of emission at the extremeties appear to lie along a line perpendicular to the axis of the outflow. The 4860 MHz image appears displaced to the north in the central visible H region of emission; this apparent displacement could be largely due to obscuration of the northern part by the dust lane.
In order to understand the nature of the prominent radio peak we have compared the 4860 MHz radio image with the optical R-band continuum, H, hard X-ray and infrared images (Fig. 6). The positions of the peaks in J2000 co-ordinates at the different wavelengths are listed in Table 4. These positions have been estimated from the FITS images kindly provided by Strickland and Veilleux (private communication). The R-band image shows two prominent peaks of emission with the peak brightness of the eastern one being brighter by a factor of 1.14, and a dust lane to the north. The northern part of the the 4860 MHz image is seen through the dust lane. The R-band peaks possibly arise due to a combination of enhanced emission in the sites of star formation and differential extinction in the circumnuclear region. These peaks skirt the southern edge of the radio continuum image and are not coincident with the radio peak. The H image also shows two peaks of emission with the maximum value for the eastern one being brighter than the western one by a factor of 2. The H peaks also lie along the southern boundary of the image, are within 1.′′5 of the peaks in the R-band image, and are not coincident with the radio peaks.
| Peaks | RA(J2000) | Dec.(J2000) |
|---|---|---|
| Radio 4860 MHz | 03 54 38.92 | 20 30 07.5 |
| Radio 8460 MHz | 03 54 38.92 | 20 30 07.6 |
| X-ray West | 03 54 39.10 | 20 30 08.2 |
| X-ray East | 03 54 39.31 | 20 30 10.1 |
| H West | 03 54 39.05 | 20 30 11.2 |
| H East | 03 54 39.18 | 20 30 10.5 |
| R-band West | 03 54 38.92 | 20 30 09.3 |
| R-band East | 03 54 39.18 | 20 30 09.9 |
The 2 to 8 keV hard X-ray Chandra image also shows two compact peaks of emission. Such features have been seen in a number of nearby starburst galaxies such as M82 (Zezas et al. 2001), NGC4038/4039 (Zezas et al. 2002) and NGC3256 (Lira et al. 2002), and are interpeted to be due to X-ray binaries or supernova remnants. In NGC1482, the western hard X-ray peak is within 0.5 arcsec of the secondary radio peak (see Fig. 6). The point source subtracted hard X-ray image (Strickland et al. 2004), not shown here, reveals more extended emission coincident with the secondary peak in the 4860 MHz image. These are possibly due to one or more supernova remnants. The eastern hard X-ray peak (see Fig. 6) lies at the southern edge of the radio image and does not have any compact component associated with it. No hard X-ray peak is seen at the position of the prominent peak in the radio image.
A superposition of the radio image on the infrared 2MASS (2 Micron All Sky Survey) K-band image (Jarrett et al. 2003) shows the infrared peak to be coincident with the prominent radio peak. The infrared image, which is largely due to a population of old giant stars, also appears asymmetric with more emission on the eastern side than the western one. This asymmetry is similar to what is seen in the radio image, and reflects a greater degree of circumnuclear activity on the eastern side of this peak. The coincidence of the radio and infrared peaks suggest that this is possibly the centre of the galaxy. The centre of the galaxy estimated from the outer isophotes of the R-band image is at RA 03 54 38.91 and Declination 20 30 07.2, which is within an arcsec of the radio peak in the high-resolution images. The geometrical centre of a line joining the peaks of the red- and blue-shifted H i emission blobs (RA: 03 54 38.8 and Dec.: 20 30 10 in J2000 co-ordinates, Section 4.1) is within 2 arcsec of this position, and hence co-incident with it within the errors.
4 H i Observations
The H i spectra towards different regions of the galaxy show significant H i emission from two diametrically opposite regions located at a distance of 20 arcsec from the nuclear region, while H i in absorption is seen against the radio continuum source. These observations which have an rms noise of 0.6 mJy/beam per channel are described below.
4.1 H i emission
The global H i profile from a tapered image with an angular resolution of 8.196.52 arcsec along a PA of 36∘ is shown in Fig. 7. This spectrum has been obtained by specifying a box around the visible extent of the galaxy, and there is a hint that it could be double-humped. The heliocentric velocities at zero intensity range from 1690 to 2020 km s-1, indicating a systemic velocity of 185520 km s-1. The total width is 330 km s-1, similar to that of typical spiral galaxies. The published H i spectrum by Roth, Mould & Davies (1991) is very similar and has a central velocity of 1859 km s-1 with a velocity resolution of 7.3 km s-1. The total H i flux density estimated from our spectrum is 91 Jy km s-1, implying that the total H i mass using the standard expression (e.g. Mirabel & Sanders 1988) is 13.51.5108M⊙.

We compare the global H i profile with the CO J=10 spectra published by a number of authors (Sanders et al. 1991; Elfhag et al. 1996; Chini et al. 1996). Sanders et al. (1991) find a double-humped profile with the blue-shifted component being narrower and weaker than the redshifted one, similar to the H i profile. The velocity width at the 20 per cent level of the peak is 325 km s-1 . CO J=10 spectra published by Elfhag et al.(1996) and Chini et al. (1996) span a similar velocity range, but show significant differences in their CO profiles. Chini et al. have noted the difference and have mentioned that they do not have an explanation.
The estimates of heliocentric systemic velocity from H i observations are consistent with those quoted from CO observations by Young et al. (1995) and Elfhag et al. (1996). They find the values to be 1848 and 1847 km s respectively with spectral resolutions of 1015 km s-1. These values agree with the estimate of 185020 km s-1 by Veilleux & Rupke (private communication) from their optical spectroscopic observatinos. The earlier estimate of 191639 km s-1 obtained by fitting the H, H, [O iii], [N ii] and [S ii] lines (Da Costa et al. 1991) appear to be higher. Da Costa et al. note in their paper that Fairall has pointed out that some of their estimates differ from those in the literature by 100 km s-1. At present, we adopt the value of 185020 km s-1 as the heliocentric systemic velocity of the galaxy.


The H i total intensity map has been generated from a MOMENT analysis in AIPS by integrating the velocities from 2090 to 1555 km s-1 and blanking out points which are below three times the rms noise. A Hanning smoothing along the velocity axis and a Gaussian smoothing in the spatial plane were used for making this image. There are two blobs of emission on opposite sides of the nuclear region, and located about 20 arcsec (2.4 kpc) from it (Fig. 8). van Driel (1987) and van Driel & van Woerden (1991) have studied the distribution and kinematics of a sample of lenticulars and early-type disk galaxies and compared their properties with late-type spirals. They note that while most barred spirals have a pronounced central hole in their H i distribution, often as large as the bar itself, non-barred spirals and S0/a galaxies generally show filled H i disks, sometimes with a central depression. Although our results on H i observations of NGC1482, an S0/a galaxy, is broadly consistent with these trends, the depletion appears pronounced, possibly due to the nuclear starburst.
At about 20% of the peak intensity in the spectrum (Fig. 10), the estimated central velocity is 183520 km s-1, consistent with the systemic velocity. The western blob has a maximum red shift of 190 km s-1 relative to the systemic velocity of 1850 km s-1, while the maximum blue-shift value for the eastern one is 220 km s-1. The width of the line towards each blob is 250 km s-1 at 20 % of the peak intensity. The estimated column density and mass for the western blob are 4.00.31021 atoms cm-2 and 151107 M⊙ respectively, while the corresponding values for the eastern blob are 3.80.31021 atoms cm-2 and 13.51107 M⊙ respectively.
The H i total-intensity distribution is shown superimposed on an optical R-band image of the galaxy as well as on the H ionization cone in Fig. 8. It is clear that the H i blobs of emission lie at the outer edges of the galaxy close to the edge of the dust lane. It avoids the central region where active star formation is taking place. A comparison of the H i emission blobs with the H image (Fig. 8) shows that the H i blobs define an axis which is approximately perpendicular to the optical emission-line outflow bicone. The peaks of these two blobs are close to two H knots or peaks of emission in the outer edges of the galaxy. The N ii to H flux density ratios suggest that the two knots are consistent with these being H ii regions (Veilleux & Rupke 2002). More sensitive H i observations of higher angular resolution are required to establish reliably the structure and dynamics of the blobs, and the effects of the H knots and the circumnuclear startburst on these properties.
4.2 H i absorption


In Fig. 9, we present the absorption profiles towards different regions of the continuum source with an angular resolution of 6.955.17 arcsec along PA of 34∘, and an rms noise of 0.6 mJy/beam. A 21-cm continuum image with an angular resolution of 32 arcsec along a PA of 28∘ from the same data set is also shown. The continuum image shows evidence of two peaks of emission towards the nuclear region. The peak absorption occurs at a heliocentric velocity of 183615 km s-1, which is consistent with the heliocentric systemic velocity. An absorption feature at this velocity is seen over most of the source. In addition there is a blue-shifted component at a heliocentric velocity of 1688 km s-1 which is prominent on the eastern side. The western side shows a weaker red-shifted shoulder with a heliocentric velocity of 1942 km s-1. These features which are seen in the absorption spectrum against the nuclear region (see Fig. 10) taken over a rectangular area of 74 arcsec, highlights the possibility that absorption is caused by multiple clouds moving with different velocities. Hydrodynamical simulations of starburst-driven superwinds show that the cool gas could expand laterally in the disk of the galaxy, be carried vertically outwards by the tenuous superwind or be entrained in the interface between the hot, superwind fluid and the cool, dense ISM (e.g. Heckman et al. 1990, 2000). For a systemic velocity of 185020 km s-1, there is a suggestion of a mild asymmetry in the absorption profile with the approaching component being blue shifted by 162 km s-1 while the receding component is red shifted by 92 km s-1. In addition to galactic rotation, the width of the absorption profile may also be due to cool, HI components which have been hydrodynamically affected by the superwind, but this needs further investigation.
The optical depth in each velocity channel has been calculated using the background continuum flux density of 60 mJy from the area of 74 arcsec. The peak optical depth estimated from this spectrum is 0.11. The total column density is 2.80.11021 cm-2, which has been estimated in the ususal way (e.g. Heckman, Balick & Sullivan 1978) by integrating the optical depth from 1675 to 1956 km s-1, and assuming a spin temperature of 100∘ K. The corresponding total mass of the absorbing H i clouds is 6.30.3106M⊙.

5 Summary and concluding remarks
The results of a radio study of the superwind galaxy NGC1482 which has a remarkable hourglass-shaped optical emission line outflow as well as bipolar soft X-ray bubbles of emission, are summarised and discussed briefly here.
-
1.
The low-frequency images trace the relatively smooth non-thermal emission due to relativistic particles generated largely in the starburst. There is no evidence of significant non-thermal emission along the optical hourglass-shaped or X-ray outflows.
-
2.
From radio observations we have estimated the supernova rate and find it to be similar to other well-known starburst galaxies. We also estimate the available energy in the supernovae, which could be the driving force for the superwind outflow. However, an estimate of the total energy in all the different components of the outflow is required before determining whether the energy in the supernovae is adequate to drive the superwind.
-
3.
The higher resolution 4860 and 8460 MHz images, which trace the circumnuclear starburst region, show a single prominent peak and secondary substructure embedded in the more extended emission. These lie at the base of the optical hourglass-shaped structure and the X-ray outflows.
-
4.
The prominent radio peak in the high-resolution images has a steep radio spectrum between 4860 and 8460 MHz and has not been detected at 14965 MHz. The highest resolution 8460 MHz A-array image shows an extension towards the south. The brightness temperature of the prominent peak in the 8460 MHz A-array image is 740∘ K, and it is difficult to distinguish whether it is an AGN or non-thermal emission from a compact starburst region. Optical spectroscopic observations by Kewley et al. (2000) show no evidence of an AGN.
-
5.
The prominent radio peak is not coincident with the peaks of emission in the R-band, H and hard X-ray images, but is coincident with the peak in the 2MASS K-band image, suggesting that this feature is possibly the centre of the galaxy. The centre of the galaxy estimated from the outer isophotes of the R-band image is within an arcsec of the radio peak. The geometrical centre of a line joining the peaks of the red- and blue-shifted H i blobs of emission is within 2 arcsec of the prominent radio peak.
-
6.
The H i observations reveal two blobs of emission on opposite sides of the centre of the galaxy. The western blob has a maximum red shift of 190 km s-1 relative to the systemic velocity of 185020 km s-1, while the maximum blue shift for the eastern one is 220 km s-1. These blobs are located at a distance of 2 kpc from the centre and have masses of approximately 15 and 13.5107 M⊙ respectively.
-
7.
The H i absorption profile shows multiple components with the deepest absorption feature at 1836 km s-1, consistent with the systemic velocity of the galaxy. The H i mass estimated from the absorption profile is 6.3106 M⊙. Relative to the systemic velocity of 185050 km s-1, there is a suggestion of a mild asymmetry in the absorption profile which could be due to H i clouds hydrodynamically affected by the superwind, in addition to the effects of galactic rotation.
-
8.
Although the distribution of H i gas is consistent with that seen for other S0/a galaxies (van Driel 1987; van Driel & van Woerden 1991), the central depletion is pronounced, possibly due to the nuclear starburst.
Acknowledgments
We are grateful to Sylvain Veilleux, David Rupke and Dave Strickland for providing us with FITS files of their optical and X-ray images; Sylvain Veilleux and David Rupke for communicating their results on the systemic velocity of the galaxy prior to publication; an anonymous referee, and Dave Strickland and Sylvain Veilleux for many valuable and critical comments; Jayaram Chengalur, Neeraj Gupta, Nimisha Kantharia, Vasant Kulkarni and Subhashis Roy for their comments on the manuscript. One of us (AH) thanks the Kanwal Riki scholarship of TIFR for partial financial support. The GMRT is a national facility operated by the National Centre for Radio Astrophysics of the Tata Institute of Fundamental Research. VLA is a operated by Associated Universities, Inc. under contract with the National Science Foundation. This research has made use of the NASA/IPAC extragalactic database (NED) which is operated by the Jet Propulsion Laboratory, Caltech, under contract with the National Aeronautics and Space Administration.
References
- [] Allen M.L., Kronberg P.P., 1998, ApJ, 502, 218
- [] Baars J.W.M., Genzel R., Pauliny-Toth I.I.K, Witzel A., 1977, A&A, 61, 99
- [] Balsara D.S., Krolik J.H., 1993, ApJ, 402, 109
- [] Baum S.A., O‘Dea C.P., Dallacassa D., de Bruyn A.G., Pedlar A., 1993. ApJ, 419, 553
- [] Chini R., Krügel E., Lemke R., 1996, A&AS, 118, 47
- [] Colbert E.J.M., Baum S.A., Gallimore J.F., O’Dea C.P., Lehnert M.D., Tsvetanov Z.I., Mulchaey J.S., Caganoff S., 1996a, ApJS, 105, 75
- [] Colbert E.J.M., Baum, S.A., Gallimore J.F., O’Dea C.P., Christensen, J.A., 1996b, ApJ, 467, 551
- [] Collison P.M., Saikia D.J., Pedlar A., Axon D.J., Unger S.W., 1994, MNRAS, 268, 203
- [] Condon J.J., 1992, ARA&A, 30, 575
- [] Condon J.J., Helou G., Sanders D.B., Soifer B.T., 1990, ApJS, 73, 359
- [] Condon J.J., Yin Q.F., 1990, ApJ, 357, 97
- [] Condon J.J., Huang Z.-P., Yin Q.F., Thuan T.X., 1991, ApJ, 378, 65
- [] Da Costa L.N., Pellegrini P.S., Davis M., Meiksin A., Sargent W.L.W., Tonry J.L., 1991, ApJS, 75, 935
- [] de Vaucouleurs G., de Vaucouleurs A., Corwin Jr H.G., Buta R.J., Paturel G., Fouqué P., 1991, Third Reference Catalogue of Bright Galaxies, Springer-Verlag
- [] Dahlem M., 1997, PASP, 109, 1298
- [] Elfhag T., Booth R.S., Höglund B., Johansson L.E.B., Sandqvist Aa., 1996, A&AS, 115, 439
- [] Hameed S., Devereux N., 1999, AJ, 118, 730
- [] Heckman T.M., Balick B., Sullivan III W.T., 1978, ApJ, 224, 745
- [] Heckman T.M., Armus L., Miley G.K., 1990, ApJS, 74, 833
- [] Heckman T.M., Lehnert M.D., Strickland D.K., Armus L., 2000, ApJS, 129, 493
- [] Hota A., Saikia D.J., 2003, BASI, 31, 425
- [] Huang Z.P., Thuan T.X., Chevalier R.A., Condon J.J., Yin Q.F., 1994, ApJ, 424, 114
- [] Jarrett T.H., Chester T., Cutri R., Schneider S.E., Huchra J.P., 2003, AJ, 125, 525
- [] Kewley L.J., Heisler C.A., Dopita M.A., Sutherland R., Norris R.P., Reynolds J., Lumsden S., 2000, ApJ, 530, 704
- [] Krolik J.H., Kriss G., 1995, ApJ, 447, 512
- [] Larson R.B., 1974, MNRAS, 169, 229
- [] Lira P., Ward M., Zezas A., Alonso-Herrero A., Ueno S., 2002, MNRAS, 330, 259
- [] Melioli C., de Gouveia Dal Pino E.M., 2004, A&A, 424, 817
- [] Mirabel I.F., Sanders D.B., 1988, ApJ, 335, 104
- [] Noreau L., Kronberg P.P., 1987, AJ, 93, 1045
- [] Pettini M., Shapley A.E., Steidel C.C., Cuby J.-G., Dickinson M., Moorwood A.F.M., Adelberger K.L., Giavalisco M., 2001, ApJ, 554, 981
- [] Roth J., Mould J.R., Davies R.D., 1991, AJ, 102, 1303
- [] Saikia D.J., Phookun B., Pedlar A., Kohno K., 2002, A&A, 383, 98
- [] Sanders D.B., Scoville N.Z., Soifer B.T., 1991, ApJ, 370, 158
- [] Spergel D.N. et al., 2003, ApJS, 148, 175
- [] Strickland D., 2001, in Chemical enrichment of the ICM and IGM, eds Fusco-Femiano R., Matteucci F., ASP Conf. Proc., 253, 387
- [] Strickland D.K., Heckman T.M., Colbert E.J.M., Hoopes C.G., Weaver K.A., 2004, ApJS, 151, 193 (astro-ph/0306592)
- [] Tully R.B., 1988, Nearby Galaxies Catalogue, Cambridge University Press
- [] Ulvestad J.S., Antonucci R.R.J., 1997, ApJ, 488, 621
- [] van Driel W., 1987, PhD Thesis, University of Groningen
- [] van Driel W., van Woerden H., 1991, A&A, 243, 71
- [] Veilleux S., 2002a, in Galaxies: The Third Dimension, eds Rosado M., Binette L., Arias L., ASP Conf. Series, 282, 293
- [] Veilleux S., 2002b, in Extragalactic Gas at Low Redshift, eds Mulchaey J.S., Stocke J., ASP Conf. Series, 254, 313
- [] Veilleux S., 2003, astro-ph/0309119
- [] Veilleux S., Rupke D.S., 2002, ApJ, 565, L63
- [] Veilleux S., Shopbell P.L., Rupke D.S., Bland-Hawthorn J., Cecil G., 2003, AJ, 126, 2185
- [] Weaver K.A., 2001, in The Central Kiloparsec of Starbursts and AGN: The La Palma Connection, eds Knapen J.H., Beckman J.E., Shlosman I., Mahoney T.J., SP Conf. Proc., 249, 389
- [] Webber W.R., 1991, in The interpretation of modern synthesis observations of spiral galaxies, eds Duric N., Crane P.C., ASP Conf. Series, 18, 37
- [] Young J.S. et al., 1995, ApJS, 98, 219
- [] Zezas A., Fabbiano G., Prestwich A., Ward M., Murray S., 2001, in Central kpc of starburst and AGN, eds Knapen J.H., Beckman J.E., Shlosman I., Mahoney T.J., ASP Conf. Ser., 249, 425
- [] Zezas A., Fabbiano G., Rots A.H., Murray S., 2002, ApJ, 577, 710