Origin of radio emission from nearby low-luminosity active galactic nuclei
Abstract
We use the observational data in radio, optical and X-ray wavebands, for a sample of active galactic nuclei (AGNs) with measured black hole masses, to explore the origin of radio emission from nearby low-luminosity active galactic nuclei (LLAGNs). The maximal luminosity of an advection dominated accretion flow (ADAF) can be calculated for a given black hole mass, as there is a critical accretion rate , above which the ADAF is no longer present. We find that the radio luminosities are higher than the maximal luminosities expected from the ADAF model, for most sources in this sample. This implies that the radio emission is dominantly from the jets in these sources. The radio emission from a small fraction of the sources (15/60, hereafter referred to as radio-weak sources) in this sample can be explained by the ADAF model. However, comparing the observed multi-band emission data with the spectra calculated for the ADAF or ADIOS (adiabatic inflow-outflow solution) cases, we find that neither ADAF nor ADIOS models can reproduce the observed multi-band emission simultaneously, with reasonable magnetic field strengths, for these radio-weak sources. A variety of other possibilities are discussed, and we suggest that the radio emission is probably dominated by jet emission even in these radio-weak LLAGNs.
1 Introduction
There is increasing evidence for supermassive black holes in both distant luminous AGNs and nearby galaxies. Black hole accretion is thought to power AGNs, and the UV/optical bump observed in luminous quasars is naturally interpreted as blackbody emission from standard thin disks (e.g., Sun & Malkan, 1989). A small fraction of quasars ( 10 percent) are radio-loud, which are defined by radio-loudness / (Kellermann et al., 1989; Visnovsky et al., 1992; Stocke et al., 1992; Kellermann et al., 1994; Hooper et al., 1995). High resolution radio observations show that the radio emission of these luminous radio-loud quasars is usually related to their relativistic jets. It is found that some nearby active galaxies share similar characteristics with those luminous quasars, but with relatively weaker broad-line emission and radio cores (Junor & Biretta, 1995; Ho, Filipenko & Sargent, 1997a; Bietenholz, Bartel & Rupen, 2000; Falcke et al., 2000; Nagar et al., 2001). These low-luminosity active galactic nuclei (LLAGNs) are very common in the local universe. According to the Palomar survey (Ho, Filipenko & Sargent, 1997b), more than 40 percent of all nearby galaxies are brighter than and emit AGN-like optical spectra.
Most of these LLAGNs are highly sub-Eddington systems, i.e., (Ho, 2003). Accreting at less than a few percent of the Eddington rate, the black hole may accrete via an ADAF (Narayan & Yi, 1994; Abramowicz et al., 1995; Narayan & Yi, 1995a, b; Chen et al., 1995). The ADAF model can successfully explain most observational features of Sagittarius at the center of our Galaxy (Narayan, Yi & Mahadevan, 1995; Manmoto, Mineshige & Kusunose, 1997; Mahadevan, 1998; Narayan et al., 1998) and other LLAGNs, such as NGC4258 (Lasota et al., 1996; Gammi, Narayan & Blandford, 1999).
Lasota et al. (1996) suggested that the ADAFs in most LLAGNs should be truncated to standard thin disks at certain radii, in order to explain the observed spectra. Several investigations were carried out to fit the spectra of LLAGNs, such as M81 and NGC4579, using the ADAF+SD (standard disk) models (Quataert et al., 1999). This model can successfully explain most important features of LLAGNs, but underpredict the detected low frequency radio flux by more than one order of magnitude(Falcke et al., 2004; Yuan et al., 2002; Falcke & Markoff, 2000). They proposed that outflows/jets might be in these sources, and that the presence of such outflows/jets is supported by theoretical calculations on ADAFs as they have positive bernoulli constants (Narayan & Yi, 1994, 1995a). Recently, the modified ADAF model, the powerful windy ADAF (adiabatic inflow-outflow solutions [ADIOSs]) (Blandford & Begelman, 1999), and convection dominated flows (CDAFs) (Narayan, Igumenshchev & Abramowicz, 2000; Stone, Pringle & Begelman, 1999), were proposed to explain the observational features of LLAGNs. Some LLAGNs have been observed and detected with the Very Long Baseline Array (VLBA) at different frequencies (Ulvestad & Ho, 2001; Nagar, Wilson & Falcke, 2001; Anderson, Ulvestad & Ho, 2004), which implies that the jet should dominate the radio emission from the nuclei in some sources. The VLBI observations show that the radio core sizes are very small in most of these sources.
In this paper, we use a sample of LLAGNs, with measured black hole masses, to explore the origin of their radio emission.
2 The sample
The LLAGN sample used for present investigation is selected from Ho (2002). The sources in this sample, which have the most up-to-date estimated black hole masses, high angular resolution optical and radio measurements. This sample covers a wide range of nuclear activity, from nearby inactive nuclei to classical Seyfert 1 nuclei and luminous quasars. In our present investigation, we focus on the LLAGNs, and the Palomar-Green quasars are not included, as they are well-known luminous quasars. The optical emission from the host galaxies dominates over that from the nuclei for most LLAGNs. In some extreme cases, the nucleus accounts for merely 0.01 percent of the integrated light (Ho & Peng, 2001). The emission from the nuclei reflect the nature of the central engines in these LLAGNs. The core radio emission has been measured by the VLA at 6 cm, with beam size . The nuclear spectral power at 6 cm, computed from the observed flux density, represents the emission associated with the “active” (nonstellar) nucleus. Since a number of objects have type 2 nuclei, which may be hidden from direct view, or at least appreciably extincted, the known relation between luminosity and -band absolute magnitude for type 1 AGNs is used to estimate the of these LLAGNs (Ho & Peng, 2001). Ho (2002) introduced a modified radio-loudness / to measure the radio activities in these LLAGNs, where and are the core luminosities, as measured by the Very Large Array (VLA) and Hubble Space Telescope (HST), respectively. It is found that all these LLAGNs are radio-loud () by this definition, instead of radio-quiet in the conventional definition.
X-ray observations can also provide a direct probe of the central engines, if the X-ray emission is not obscured. We searched the literature, and compiled the X-ray emission data measured at different energy bands, which were converted to . For the sources without measured photon indices, we adopt the conventional assumption that photon index . As a result, we have a sample of 62 LLAGNs, of which 57 have measured optical nuclei, 60 have measured radio nuclei, and 57 have measured X-ray emission. All the data in this sample are listed in Table 1, and more details may be found in Ho (2002).
3 Spectra of ADAF/ADIOS
In this work, we use the following dimensionless variables:
| (1) |
where the Schwarzschild radius is defined as
| (2) |
and the Eddington accretion rate is defined as
| (3) |
An accretion efficiency of is adopted in this work (Frank, King & Raine, 1992). When the mass accretion rate is below a critical rate, , where is the viscosity parameter, the accretion flow is thought to be an optically thin “advection-dominated” accretion flow (ADAF) (Narayan & Yi, 1995b; Mahadevan, 1997, hereafter M97). We can calculate the ADAF spectrum, using the approach proposed in M97, if the black hole mass , the dimensionless accretion rate , the viscosity , and the ratio of the gas to total pressures, are specified. For the fixed black hole mass , the ADAF luminosities in different bands (i.e., the optical, radio and X-ray) increase with . Cao (2002) showed that the maximal optical luminosity of an ADAF always requires , i.e., equipartition between the magnetic and gas pressures. Our numerical results show that the maximal radio luminosity requires , and that the maximal X-ray luminosity requires , if all other parameters are fixed. By varying the dimensionless accretion rate , we can obtain the numerically maximal luminosity at a given wavelength , as a function of black hole mass .
For an ADIOS flow, the accretion rate is a function of radius , instead of being a constant independent of as in a pure ADAF model (Blandford & Begelman, 1999; Quataert & Narayan, 1999). A dimensionless accretion rate, , is assumed for the ADIOS flow, where is the mass accretion rate at , and is a parameter describing the strength of the winds (Blandford & Begelman, 1999). For strong winds (corresponding to a large ), the spectrum emitted from the flow is modified, as its structure is significantly altered by the winds. Both synchrotron and bremsstrahlung emission decrease with increasing , as a large leads to lower density and lower electron temperature in the inner region of the flow. An ADIOS is described by a similar set of equations as for an ADAF, with an -dependent accretion rate assumed. The spectral calculations for the ADIOS flows are presented in Chang, Choi & Yi (2002), which are briefly summarized here (several errors in their paper have been fixed).
The total heating rate of the ADIOS flow is given by
| (4) |
where , is the outer radius of the ADIOS flow, which extends to .
The total ion-electron heating rate for the electrons in the flow is
| (5) |
where , , are the constants as defined in Narayan & Yi (1995b), and is given by Eq. (11) in M97.
As suggested by Narayan & Yi (1995b), it is a good approximation to assume and to be constant in the flow for spectral calculations. For a given , the cut-off frequency of cyclosynchrotron emission at each radius is given by
| (6) |
where , , , , and , , are electron charge, the magnetic field strength and electron mass respectively. The peak frequency of cyclosynchrotron emission is originated at ,
| (7) |
The synchrotron spectrum of the ADIOS flow is then described by
| (8) |
where . We can obtain the radio luminosity at peak frequency ,
| (9) |
The total synchrotron power is approximately given by
| (10) |
The total power of the bremsstrahlung emission and its spectrum are given by
| (11) |
and
| (12) |
where is given in M97 (Eq. 28). For the Comptonization of synchrotron photons, the optical depth is given by
| (13) |
The Compton spectrum and total Compton power are given by
| (14) |
and
| (15) |
For a given set of parameters: , , , and , the total heating of the electrons should be balanced by the sum of the individual cool terms: . The electron temperature can be calculated from the above energy equations, and then the spectrum of the ADIOS flow can be calculated, if all these parameters are specified.
4 Results
4.1 Relations between black hole masses and luminosities
The relations between the black hole masses and the continuum luminosities in different wavebands, for the sources in our sample, are plotted in Figs. 1 (radio), 2 (optical), and 3 (X-ray), respectively. As discussed in Sect. 3, the maximal continuum luminosities in different wavebands, for a pure ADAF model, can be calculated as function of black hole mass , if the parameter is specified. The maximal luminosities increase with the viscosity parameter , so the maximal luminosity of , , and for are plotted in Figs. 1-3, respectively. In Fig. 1, we find that 15 sources in our sample have 5 GHz luminosities less than the maximal radio luminosities predicted by the pure ADAF model (hereafter, these 15 sources are referred to as radio-weak AGNs). For these radio-weak AGNs, their radio emission is so weak that can be explained by the ADAF model. However, these sources, different from the conventionally defined radio-quiet AGNs, have their radio-loudness (their optical core emission is also very weak). In Figs. 2 and 3, we find that all these radio-weak sources have optical and X-ray luminosities less than that predicted by the pure ADAF model. It is found that some sources, with radio luminosities higher than the maximal luminosities predicted by the pure ADAF model, are situated below the maximal optical and X-ray luminosities predicted by the pure ADAF model in Figs. 2 and 3 (see the square sources in Figs. 1, 2, and 3).
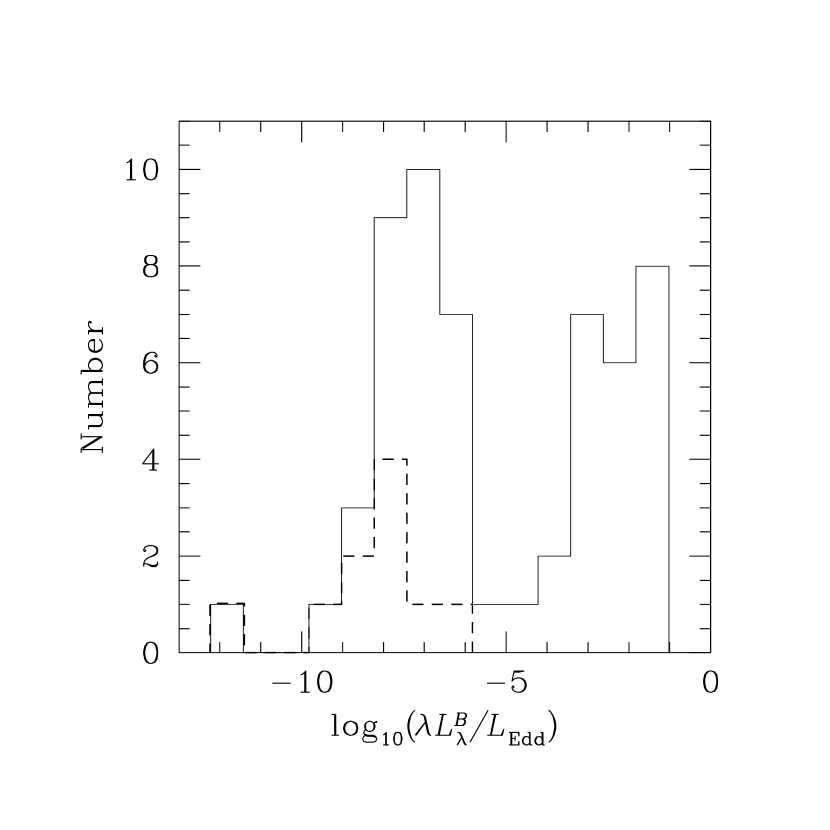
4.2 Distribution of Eddington ratio
The distribution of the Eddington ratio, , is plotted in Fig. 4. A bimodal distribution of is found for the whole sample. We calculated the statistical significance of this possible bimodality, using the KMM algorithm (Ashman, Bird & Zepf, 1994). The KMM test shows that the distribution of is non-unimodal (with P-value = 0.003 0.05) with null hypothesis. No selection effects were found that may lead to such a bimodal distribution of for this sample. Marchesini, Celotti & Ferrarese (2004) also found that a bimodal distribution of the dimensionless accretion rate , for a sample of radio galaxies and radio-loud quasars, which is similar to ours. Begelman & Celotti (2004) proposed that sources with lower accretion rates can be explained if ADIOS flows are present. All 15 radio-weak sources in our sample have systematically lower ratios, which may be in either the ADAF or ADIOS states.
4.3 Test ADAF model
There are 15 radio-weak sources in our sample, including four sources (NGC 3377, NGC 4342, NGC 4697 and NGC 5845) without measured optical nuclei, and two sources (NGC 4596 and NGC 5845) without measured X-ray emission. There are 10 radio-weak sources having all optical, radio, and X-ray emission data. The black hole masses of these 10 radio-weak sources are in the range . The ADAF spectrum can be calculated, if the black hole mass , the accretion rate , and the parameters , are specified (M97). The spectral energy distributions (SEDs) are similar for different black hole masses, if the accretion rate , the parameters , and are fixed. So, is adopted in our spectral calculations for ADAFs, and this should not affect our main conclusions. The relation between / and is plotted in Fig. 5, for . The ADAF spectral calculations for different field strengths , and accretion rates , are also plotted in Fig. 5. Compared with our spectral calculations, the magnetic field strength () is required to be very small (), for some radio-weak sources, if they are indeed in a pure ADAF state. Some sources (e.g., NGC 4649) are even required to have . The corresponding results for are presented in Fig. 6.
The radio emission from the ADAF model depends sensitively on the magnetic field strength. The maximal luminosity of a pure ADAF, with such a weak magnetic field strength, can also calculated as described in Sect. 3. It is found that 6 radio-weak sources (NGC 221, NGC 3608, NGC 4291, NGC 4459, NGC 4564 and NGC 4649) in our sample have radio luminosity higher than the maximal values predicted by the ADAF model, if they indeed have the very weak magnetic field strengths (very low values of ), as required by the ADAF spectral calculations in these sources (see Figs. 1 and 5). For example, the spectral calculations require for NGC 4649, while its radio luminosity is higher than the maximal luminosity of a pure ADAF model, calculated for .
4.4 Test ADIOS model
The accretion rate is no longer constant for an ADIOS flow, as matter is carried away by the winds. For an ADIOS flow, is assumed, and the detailed spectral calculations for ADIOS flow are similar to those for pure ADAF model, as described in Sect. 3. For =1, the relations between / and for =0.4 (mild winds), and =0.99 (strong winds), are plotted in Figs. 7 and 8, respectively. In Fig. 7, we find that extremely weak magnetic field strengths () are required to explain the observed spectra for these 10 radio-weak sources, if they are in a pure ADIOS state, which is similar to that from the pure ADAF models. ADIOS flow with strong winds () cannot explain the SEDs of all of these radio-weak sources.
4.5 ADAF+SD model
An ADAF may be present near the black hole, and it may transit to a cold standard disk (SD) beyond the transition radius (Esin, McClintock & Narayan, 1997). Cao (2002)’s calculations indicated that the optical continuum emission from the inner ADAF region can be neglected, compared with that from the outer SD, if is around tens to several hundred Schwarzchild radii. The spectrum of the outer SD can be calculated, if the black hole mass , accretion rate , and the transition radius , are specified. It is found that the transition radii of these radio-weak sources are around , if is adopted (see Fig. 2).
5 Discussion
5.1 Different accretion modes of LLAGNs
Most LLAGNs in our sample have strong radio emission, which is probably dominated by jet emission (see Fig. 1). However, the origin of the radio emission, from the radio-weak LLAGNs in this sample (the triangles in the figures) is still unclear. The radio emission may be from either the jets (outflows) or the ADAFs (ADIOS flows), or from both, because the synchrotron emission of the hot electrons in the ADAFs (ADIOS flows) is important. For the radio-weak LLAGNs in our sample, their radio emission is fainter than the maximal radio luminosity predicted by the ADAF model. Thus, in principle, their radio emission can be explained as the synchrotron emission from the hot electrons in ADAFs, which is supported by the fact that their X-ray and optical luminosities are also lower than the maximal values predicted by the ADAF models (see Figs. 2 and 3). All these 10 radio-weak LLAGNs have relatively lower values of (see Fig. 4). The bimodal distribution of implies that these radio weak sources probably have ADAFs or ADIOS flows, while the sources in the population with higher values of only have standard thin disks.
5.2 Can the radio emission from the radio-weak LLAGNs be explained by radiatively inefficient accretion models?
The spectra of ADAFs can be calculated, if the black hole mass , the dimensionless accretion rate , the magnetic field strength parameter , and the viscosity parameter , are specified. We compare the observational data in radio, optical and X-ray wavebands with theoretical ADAF spectral calculations in Figs. 5 and 6, for different values of . It is found that extremely weak magnetic field strengths (e.g., ) are required if these 10 radio-weak sources are in the pure ADAF state. However, Pan, Lu & Gu (2002) found that the two-temperature ADAF structure is suppressed if no magnetic field is present in the ADAF. It is still unclear whether an ADAF can have such weak magnetic field strengths, because the magnetic field can be easily amplified through dynamo processes in accretion flows. This may imply that the radio emission of these radio-weak sources cannot be solely attributed to pure ADAFs.
The ADAF radio emission depends sensitively on the magnetic field strength. If the magnetic fields of the flows in these radio-weak sources are so weak, as required by the ADAF spectral calculations, we find that 6 of the 10 radio-weak sources have higher radio luminosities than the maximal luminosities for ADAFs (see Fig. 1). This indicates that the ADAFs are unable to produce the observed radio emission, at least in these six sources, even if the field strength is extremely weak. Thus, jet radio emission may be important in these sources, which is consistent with the two very weak radio lobes detected in NGC 4649 (Stanger & Warwick, 1986).
Similar analyses have been done for the ADIOS cases. The results of the ADIOS models with mild winds are similar to the ADAF cases (Fig. 7). Very weak magnetic fields are required in the ADIOS flows. The ADIOS flows with strong winds, for example, , cannot reproduce the observed radio emission of all these radio-weak sources.
Convection dominated accretion flows (CDAFs) may be a possible alternative for ADAFs or ADIOS flows (Narayan, Igumenshchev & Abramowicz, 2000; Stone, Pringle & Begelman, 1999). The accretion rates of CDAFs are much smaller than those in non-convecting ADAFs, so the CDAFs are relatively very faint (Ball, Narayan & Quataert, 2001). This implies that most radio-weak LLAGNs in this sample may be too bright to be powered by pure CDAFs, though the quantitatively calculations are still unavailable. Even if CDAFs are present in these sources, we expect that the jet emission is still required to explain their observed radio emission, and our main conclusions on the origin of their radio emission should remain unchanged.
In our analyses, we have assumed that all the emission in different wavebands (radio, optical, and X-ray) is from the nuclei of the sources, without being absorbed. We note that several sources in our sample are type 2 AGNs, and that putative tori may be present to obscure nuclear emission. The -band luminosities of these sources are estimated by using the relation (Ho & Peng, 2001). For type 2 AGNs, only narrow-line emission is observed, as broad-line emission may be obscured by the putative tori. It is found that the mean ratio of the broad to narrow components is , for a sample of 119 low-redshift Seyfert 1 type AGNs (Xu et al., 2003). Osterbrock (1981) found that the ratio is around 2-4.5 for five Seyfert 1 galaxies. Schulz, Knake & Kaler (1994) also found that this ratio is around 1.6-7 for three low-luminosity Sefert 1 galaxies. Even if this is the case for radio-weak sources in our sample, the -band luminosities of any type 2 LLAGNs may be underestimated by no more than one order of magnitude, and most of the radio-weak LLAGNs in our sample still cannot be interpreted with reasonable magnetic field strengths (Figs. 5-8). If the putative tori are indeed present to obscure the nuclear emission, the 2 keV X-ray emission may be partly absorbed by the tori, if not all absorbed. In this case, the intrinsic X-ray luminosities of type 2 LLAGNs should higher than the observed values. This requires the magnetic field strengths of the accretion flows to be even weaker than in our present calculations (see Figs. 5-8). Thus our main conclusion on the origin of the radio emission will remain unchanged, even if the nuclear emission of some radio-weak LLAGNs may be obscured by the putative tori.
5.3 Other possible models for radio-weak LLAGNs
It should be cautioned that our present analyses are performed by assuming all the emission in the different wavebands to be from ADAFs or ADIOS flows. If the ADAF (ADIOS flow) is truncated to a standard thin disk at a certain radius, the observed optical emission may be dominated by the outer standard disk. For such ADAF+SD (or ADIOS+SD) systems, it is found that the transition radii of these radio-weak LLAGNs should be around , if is adopted (Fig. 2). If this is the case, the optical emission from the ADAF (or ADIOS flow) should be less than the observed values. This requires the points in Figs.5-8 to be shifted towards the left, i.e., much weaker field strengths are required in the spectral calculations and our conclusions will thus be strengthened.
Besides the ADAF or ADIOS flow, the X-ray emission may also be from the jet or the corona above the outer standard thin disk surrounding the ADAF or ADIOS flow. In this case, only a fraction of the observed X-ray emission is from the ADAF or ADIOS flow. The locations of the sources would be shifted downwards, and they could be explained by the ADAF/ADIOS flow with relatively stronger magnetic field strength (see Fig. 5). Comparisons of the observed optical luminosities with the theoretical spectral calculations for ADAF+SD systems require the transition radii of these radio-weak LLAGNs to be larger than 100 , if is adopted. For a higher adopted , the transition radii should be larger. Witt, Czerny & Zycki (1997) found that the corona cannot survive if the accretion rate is less than a critical value at a given radius (Figs. 3a, b in their paper). Their calculations showed that, the corona should be absent if the transition radii of these radio-weak LLAGNs are larger than 100 , with such a low accretion rate. Thus, the X-ray emission cannot be attributed to the corona above the outer thin disk for these radio-weak LLAGNs. The radio flux densities of these radio-weak sources are around sub-mJy, except for NGC 4649 and Milky way, which are beyond the observational capability of VLBI. We suggest that future high-sensitivity Square Kilometer Array (SKA) observations of these LLAGNs should help to verify the origins of their radio emission.
References
- Abramowicz et al. (1995) Abramowicz, M. A., Chen, X., Kato, S., Lasota, J. P., & Regev, O. 1995, ApJ, 438, L37
- Anderson, Ulvestad & Ho (2004) Anderson, J. M., Ulvestad, J. S., & Ho, L. C. 2004, ApJ, 603, 42
- Ashman, Bird & Zepf (1994) Ashman K. M., Bird C. M., & Zepf S. E. 1994, AJ, 108, 2348
- Baganoff et al. (2003) Baganoff, F. K. et al. 2003, ApJ, 591, 891
- Ball, Narayan & Quataert (2001) Ball, G. H., Narayan, R., & Quataert, E. 2001, ApJ, 552, 221
- Begelman & Celotti (2004) Begelman M. C., & Celotti A. 2004, MNRAS, in press (astro-ph/0406607)
- Beuing et al. (1999) Beuing, J., Dobereiner, S., Bohringer, H., & Bender, R. 1999, MNRAS, 302, 209
- Bietenholz, Bartel & Rupen (2000) Bietenholz, M. F., Bartel, N., & Rupen, M. P. 2000, ApJ, 532, 895
- Blandford & Begelman (1999) Blandford, R. D., & Begelman, M. C. 1999, MNRAS, 301, L1
- Cao (2002) Cao, X. 2002, ApJ, 570, L13
- Chen et al. (1995) Chen, X., Abramowicz, M. A., Lasota, J. P., Narayan, R., & Yi, I. 1995, ApJ, 443, L61
- Chang, Choi & Yi (2002) Chang, H. Y., Choi C. S., & Yi, I. 2002, AJ, 124, 1948
- Colbert & Mushotzky (1999) Colbert, E. J. M., & Mushotzky, R. F. 1999, ApJ, 519, 89
- Eracleous, Halpern & Charlton (2003) Eracleous, M., Halpern, J. P., & Charlton, J. C. 2003, ApJ, 582, 633
- Esin, McClintock & Narayan (1997) Esin, A. A., McClintock, J. E., & Narayan, R. 1997, ApJ, 489, 865
- Fabbiano, Kim & Trinchieri (1992) Fabbiano, G., Kim, D. W., & Trinchieri, G. 1992, ApJS, 80, 531
- Falcke et al. (2000) Falcke, H., Nagar, N. M., Wilson, A. S., & Ulvestad, J. S. 2000, ApJ, 542, 197
- Falcke & Markoff (2000) Falcke, H., & Markoff, S. 2000, A&A, 362, 113
- Falcke et al. (2004) Falcke, H., Krding, E., & Markoff, S. 2004, A&A, 414, 895
- Frank, King & Raine (1992) Frank, J., King, A., & Raine, D. 1992, Accretion Power in Astrophysics (Cambridge: Cambridge Univ. Press)
- Gammi, Narayan & Blandford (1999) Gammie, C. F., Narayan, R., & Blandford, R. 1999, ApJ, 516, 177
- George et al. (2000) George, I. M., et al. 2000, ApJ, 531, 52
- Halderson et al. (2001) Halderson, E. L., Moran, E. C., Filippenko, A. V., & Ho, L. C. 2001, AJ, 122, 637
- Ho, Filipenko & Sargent (1997a) Ho, L. C., Filippenko, A. V., Sargent, W. L. W., & Peng, C. Y. 1997a, ApJS, 112, 391
- Ho, Filipenko & Sargent (1997b) Ho, L. C., Filippenko, A. V., & Sargent, W. L. W. 1997b, ApJ, 487, 568
- Ho & Peng (2001) Ho, L. C., & Peng, C. Y. 2001, ApJ, 555, 650
- Ho (2002) Ho, L. C. 2002, ApJ, 564, 120
- Ho (2003) Ho, L. C. 2003, ASP Conf. Ser. 290: Active Galactic Nuclei: from Central Engine to Host Galaxy, 601
- Hooper et al. (1995) Hooper, E. J., Impey, C. D., Foltz, C. B., & Hewett, P. C. 1995, ApJ, 445, 62
- Ishisaki et al. (1996) Ishisaki, Y. et al. 1996, PASJ, 48, 237
- Junor & Biretta (1995) Junor, W., & Biretta, J. A. 1995, AJ, 109, 500
- Kellermann et al. (1994) Kellermann, K. I., Sramek, R. A., Schmidt, M., Green, R. F., & Shaffer, D. B. 1994, AJ, 108, 1163
- Kellermann et al. (1989) Kellermann, K. I., Sramek, R., Schmidt, M., Shaffer, D. B., & Green, R. 1989, AJ, 98, 1195
- Lasota et al. (1996) Lasota, J. P., Abramowicz, M. A., Chen, X., Krolik, J., Narayan, R., & Yi, I. 1996, ApJ, 462, 142
- Mahadevan (1997, hereafter M97) Mahadevan, R. 1997, ApJ, 477, 585
- Mahadevan (1998) Mahadevan, R. 1998, Nature, 394, 651
- Manmoto, Mineshige & Kusunose (1997) Manmoto, T., Mineshige, S., & Kusunose, M. 1997, ApJ, 489, 791
- Marchesini, Celotti & Ferrarese (2004) Marchesini, D., Celotti A., & Ferrarese, L. 2004, MNRAS, in press (astro-ph/0403272)
- Matt et al. (2000) Matt, G., Fabian, A. C., Guainazzi, M., Iwasawa, K., Bassani, L., & Malaguti, G. 2000, MNRAS, 318, 173
- Merloni et al. (2003) Merloni, A., Heinz, S., & di Matteo, T. 2003, MNRAS, 345, 1057
- Nagar et al. (2001) Nagar, N. M., Wilson, A. S., Falcke, H., & Ulvestad, J. S. 2001, AGN Surveys, Proceedings of IAU Colloquium 184., Ed. R. F. Green, E. Y. Khachikian, and D. B. Sanders. Publisher: ASP, 81
- Nagar, Wilson & Falcke (2001) Nagar, N. M., Wilson, A. S., & Falcke, H. 2001, ApJ, 559, 87
- Narayan & Yi (1994) Narayan, R., & Yi, I. 1994, ApJ, 428, L13
- Narayan & Yi (1995a) Narayan, R., & Yi, I. 1995a, 444, 231
- Narayan & Yi (1995b) Narayan, R., & Yi, I. 1995b, 452, 710
- Narayan, Yi & Mahadevan (1995) Narayan, R., Yi, I., & Mahadevan, R. 1995, Nature, 374, 623
- Narayan et al. (1998) Narayan, R., Mahadevan, R., Grindlay, J. E., Popham, R. G., & Gammie, C. 1998, ApJ, 492, 554
- Narayan, Igumenshchev & Abramowicz (2000) Narayan, R., Igumenshchev, I. V., & Abramowicz, M. A. 2000, ApJ, 539, 798
- Osterbrock (1981) Osterbrock, D. E. 1981, ApJ, 249, 462
- Pan, Lu & Gu (2002) Pan, L. B., Lu, J. F., & Gu, W. M. 2002, ChA&A, 26, 27
- Prieto et al. (2001) Prieto, M. A., P rez Garc a, A. M., & Rodr guez Espinosa, J. M. 2001, A&A, 377, 60
- Quataert et al. (1999) Quataert, E., di Matteo, T., Narayan, R., & Ho, L. C. 1999, ApJ, 525, 89
- Quataert & Narayan (1999) Quataert, E., & Narayan, R. 1999, ApJ, 520, 298
- Schulz, Knake & Kaler (1994) Schulz, H., Knake, A., & Schmidt-Kaler, T. 1994, A&A, 288, 425
- Stanger & Warwick (1986) Stanger, V. J., & Warwick, R. S. 1986, MNRAS, 220, 363
- Stocke et al. (1992) Stocke, J. T., Morris, S. L., Weymann, R. J., & Foltz, C. B. 1992, ApJ, 396, 487
- Stone, Pringle & Begelman (1999) Stone, J. M., Pringle, J. E., & Begelman, M. C. 1999, MNRAS, 310, 1002
- e.g., Sun & Malkan (1989) Sun, W. H.,& Malkan, M. A. 1989, ApJ, 346, 68
- Trinchieri et al. (1999) Trinchieri, G., Israel, G. L., Chiappetti, L., Belloni, T., Stella, L., & Primini, F. 1999, A&A, 348, 43
- Turner & Pounds (1989) Turner, T. J., & Pounds, K. A. 1989, MNRAS, 240, 833
- Ulvestad & Ho (2001) Ulvestad, J. S.,& Ho, L. C. 2001, ApJ, 562, L133
- Visnovsky et al. (1992) Visnovsky, K. L., Impey, C. D., Foltz, C. B., Hewett, P. C., Weymann, R. J., & Morris, S. L. 1992, ApJ, 391, 560
- White, Giommi & Angelini (2000) White N. E., Giomm P., & Angelini L., ROSAT Position Sensitive Proportional Counter Pointed, observations as generated by White, Giommi and Angelini, May 2000 (From NED)
- Witt, Czerny & Zycki (1997) Witt, H. J., Czerny, B., & Zycki, P. T. 1997, MNRAS, 286, 848
- Xu et al. (2003) Xu D. W., et al. 2003, ApJ, 590, 73
- Yuan et al. (2002) Yuan, F., Markoff, S., & Falcke, H. 2002, A&A, 383, 854
- Zang & Meurs (2001) Zang, Z., & Meurs, E. J. A. 2001, ApJ, 556, 24
| Source Name | b | c | Distance d | e | References | |
|---|---|---|---|---|---|---|
| 3C 120 (Mrk 1506) | 7.36 | 40.20 | 24.90 | 137.8 | 40.40 | 1 |
| 3C 390.3 (VII w 838) | 8.53 | 40.33 | 25.62 | 241.2 | 40.49 | 2 |
| Ark 120 (Mrk 1095) | 8.26 | 40.93 | 21.80 | 134.6 | 40.45 | 1 |
| Arp 102B | 8.34 | 38.92 | 22.87 | 99.7 | 39.83 | 3 |
| Circinus | 6.11 | 39.56 | 21.04 | 4.0 | 38.49 | 4 |
| Fairall 9 | 7.90 | 41.13 | 22.96 | 199.8 | 40.34 | 1 |
| IC4329A | 6.69 | 39.58 | 22.25 | 65.5 | 39.94 | 1 |
| Mrk 79 (UGC 3973) | 7.71 | 39.85 | 21.62 | 91.3 | 39.81 | 1 |
| Mrk 110 | 6.74 | 39.64 | 21.76 | 147.7 | 40.25 | 5 |
| Mrk 279 (UGC 8823) | 7.62 | 39.84 | 22.09 | 126.6 | 40.21 | 2 |
| Mrk 335 | 6.79 | 40.23 | 21.60 | 106.6 | 39.78 | 1 |
| Mrk 509 | 7.76 | 40.87 | 22.11 | 143.8 | 40.51 | 1 |
| Mrk 590 (NGC 863) | 7.25 | 38.85 | 21.91 | 109.2 | 40.05 | 1 |
| Mrk 817 (UGC 9412) | 7.64 | 39.96 | 22.05 | 131.0 | 39.22 | 6 |
| NGC 1068 (M77) | 7.20 | 38.47 | 22.43 | 14.4 | 37.50 | 1 |
| NGC 3227 | 7.59 | 37.84 | 21.20 | 20.6 | 38.44 | 1 |
| NGC 3516 | 7.36 | 39.07 | 21.34 | 38.9 | 39.69 | 2 |
| NGC 3783 | 6.97 | 39.48 | 21.36 | 38.5 | 39.20 | 1 |
| NGC 4051 | 6.11 | 37.63 | 20.54 | 17.0 | 38.34 | 1 |
| NGC 4151 | 7.18 | 39.30 | 21.84 | 20.3 | 39.28 | 1 |
| NGC 4593 | 6.90 | 39.00 | 20.48 | 39.5 | 39.21 | 1 |
| NGC 4945 | 6.04 | 37.64 | 21.59 | 4.2 | 38.74 | 4 |
| NGC 5548 | 8.09 | 39.71 | 21.86 | 70.2 | 39.68 | 1 |
| NGC 7469 | 6.81 | 39.82 | 22.47 | 66.6 | 39.64 | 1 |
| IC 342 | 5.70 | 33.48 | 17.95 | 1.8 | 34.84 | 7 |
| IC1459 | 8.57 | 36.66 | 23.02 | 29.2 | 37.15 | 2 |
| NGC 205 (M110) | 4.97 | 31.04 | 17.12 | 0.74 | 32.19 | 8 |
| NGC 598 (M33) | 3.18 | 31.29 | 16.70 | 0.87 | 34.97 | 7 |
| NGC 821 | 7.70 | 35.05 | 19.54 | 24.1 | 37.75 | 9 |
| NGC 1023 | 7.59 | 34.62 | … | 11.4 | … | … |
| NGC 2778 | 7.30 | … | 19.58 | 22.9 | 36.95 | 9 |
| NGC 2787 | 7.59 | 35.19 | 19.78 | 7.5 | 34.89 | 2 |
| NGC 3031 (M81) | 7.80 | 36.12 | 20.23 | 3.9 | 36.73 | 10 |
| NGC 3245 | 8.32 | 36.36 | 20.24 | 20.9 | … | … |
| NGC 3384 | 7.25 | 34.60 | 18.91 | 11.6 | 36.00 | 11 |
| NGC 3998 | 8.75 | 37.06 | 21.29 | 14.1 | 38.15 | 2 |
| NGC 4203 | 7.08 | 36.11 | 20.43 | 14.1 | 36.29 | 12 |
| NGC 4258 (M106) | 7.61 | 35.11 | 19.35 | 7.3 | 35.06 | 12 |
| NGC 4261 | 8.72 | 35.99 | 22.58 | 31.6 | 37.66 | 2 |
| NGC 4374 (M84) | 9.20 | 35.67 | 22.15 | 18.4 | 36.14 | 7 |
| NGC 4395 | 5.04 | 34.87 | 18.29 | 3.6 | 34.04 | 12 |
| NGC 4473 | 8.00 | 34.75 | 19.77 | 15.7 | 36.04 | 13 |
| NGC 4486 (M87) | 9.53 | 36.23 | 23.09 | 16.1 | 37.42 | 12 |
| NGC 4594 (M104) | 9.04 | 36.00 | 21.15 | 9.8 | 37.19 | 2 |
| NGC 6251 | 8.73 | 36.24 | 24.22 | 94.8 | 38.64 | 2 |
| NGC 7052 | 8.56 | 36.75 | 22.64 | 63.6 | … | … |
| NGC 7457 | 6.53 | 33.91 | … | 13.2 | 36.50 | 9 |
| MilkyWay | 6.47 | 29.07 | 15.79 | 0.008 | 28.61 | 14 |
| NGC 221 (M32) | 6.59 | 32.73 | 16.89 | 0.81 | 34.14 | 7 |
| NGC 224 (M31) | 7.52 | 36.02 | 15.40 | 0.76 | 35.81 | 15 |
| NGC 3115 | 8.96 | 34.92 | 18.57 | 9.7 | 35.44 | 13 |
| NGC 3377 | 8.00 | … | 18.88 | 11.2 | 35.53 | 11 |
| NGC 3379 (M105) | 8.00 | 34.98 | 19.03 | 10.6 | 34.92 | 12 |
| NGC 3608 | 8.04 | 35.08 | 19.50 | 22.9 | 36.29 | 11 |
| NGC 4291 | 8.17 | 35.09 | 19.43 | 26.2 | 37.01 | 11 |
| NGC 4342 | 8.53 | … | 19.23 | 16.8 | 35.65 | 13 |
| NGC 4459 | 7.81 | 35.58 | 19.39 | 16.1 | 35.95 | 13 |
| NGC 4564 | 7.75 | 34.44 | 19.13 | 15.0 | 35.90 | 11 |
| NGC 4596 | 7.76 | 34.89 | 19.23 | 16.8 | … | … |
| NGC 4649 (M60) | 9.30 | 34.44 | 20.78 | 16.8 | 37.22 | 11 |
| NGC 4697 | 8.08 | … | 19.01 | 11.7 | 36.18 | 11 |
| NGC 5845 | 8.51 | … | 19.60 | 25.9 | … | … |
References. — (1)Turner & Pounds (1989); (2)Merloni et al. (2003); (3)Eracleous, Halpern & Charlton (2003); (4)Matt et al. (2000); (5)George et al. (2000); (6)Prieto et al. (2001); (7)Colbert & Mushotzky (1999); (8)Zang & Meurs (2001) ; (9)Beuing et al. (1999); (10)Ishisaki et al. (1996); (11)Fabbiano, Kim & Trinchieri (1992); (12)Halderson et al. (2001); (13)White, Giommi & Angelini (2000); (14)Baganoff et al. (2003); (15)Trinchieri et al. (1999).