The Coronae of AB Dor and V471 Tau: Primordial angular momentum vs tidal spin-up
Abstract
The zero-age main-sequence star AB Dor and the K dwarf component of the V471 Tau close binary have essentially identical rotation rates and spectral types. An analysis of their high resolution Chandra X-ray spectra reveals remarkably similar coronal characteristics in terms of both temperature structure and element abundances. Both stars show depletions of low FIP elements by factors of , with higher FIP elements showing more mild depletions. No evidence for enhancements of very low FIP ( eV) elements, such as Na, Al and Ca, as compared to other low FIP elements was found. The abundance anomaly pattern for AB Dor and V471 Tau is similar to, though less extreme than, the abundance anomalies exhibited by active RS-CVn-type binaries. While we find statistically significant structure in the underlying differential emission measure distributions of these stars over narrow temperature intervals, this structure is strongly dependent on the lines used in the analysis and is probably spurious. Based on their X-ray similarities, we conclude that the exact evolutionary state of a star has little effect on coronal characteristics, and that the parameters that dominate coronal structure and composition are simply the rotation rate and spectral type.
Subject headings:
stars: abundances — stars: activity — stars: coronae — stars: late-type — Sun: corona — X-rays: stars1. Introduction
The solar coronal abundance anomaly commonly known as the “FIP Effect” (or First Ionization Potential Effect), in which low first ionization potential (FIP) elements ( 10 eV; e.g. Si, Fe, Mg) appear enhanced by average factors of 3-4, was already well established by the time the first observational clues to similar abundance anomalies in stellar coronae were uncovered in the 1990’s (e.g. Feldman, 1992). These clues came from low resolution soft X-ray spectra (GINGA, ASCA, BeppoSAX), together with moderate resolution extreme ultraviolet (EUV) spectra obtained by the Extreme Ultraviolet Explorer (EUVE). The early stellar studies found evidence for a solar-like FIP Effect in some stars, but for the more active stars the abundances pointed toward metal-paucity rather than enhancement (e.g. S. Drake, 1996, and earlier references therein).
In the last three years—the beginning of the Chandra and XMM-Newton—era has seen the early hints of abundance anomalies fleshed out into an interesting array of diverse abundance patterns in which active stars appear to show signs not only of low FIP element depletion, but also of high FIP element enhancements (Singh et al., 1995). Studies of solar-like active stars confirm the suspicions engendered by earlier work (e.g. J. Drake, 1996, and earlier references therein) that a transition from a metal-depleted to a metal-rich corona occurs as the activity decreases (Güdel et al., 2002); this is now better characterised as a change from an apparently “inverse FIP Effect” to a FIP Effect. Audard et al. (2003b) showed a similar transitions from an inverse FIP effect to the absence of an obvious FIP effect for RS CVn binary stars with decreasing activity. Only one star studied in detail to date based on high resolution spectra appears to have a coronal composition demonstrably similar to that of its underlying photosphere—the subgiant Procyon (F5IV) (Drake et al., 1995; Raassen et al., 2002).
In the last decade, the community working on coronal abundances have argued (e.g. Drake, 2003a, and earlier references therein) that coronal abundances, when better understood, might provide new and powerful diagnostics of the physical processes underpinning stellar coronae. The emerging patterns of coronal abundance anomalies are telling us something about the dynamics structure and heating of coronal plasma; the challenge is in learning to read these patterns.
Aiming toward this goal, one question that arises is that of fine tuning of abundance patterns: how similar are abundance anomalies in stars that superficially might have similar parameters? Drake (2003b) presented a differential analysis of the active binaries Algol and HR1099—two binary systems whose coronally-dominant components are of very similar spectral type and rotation period, but which have had quite different evolutionary histories—and found strong similarities in their quiescent X-ray spectra and coronal abundances.
Here, we note that the young single active star AB Dor and the active component of the binary system V471 Tau are both early K dwarfs and have rotation periods of half a day. Superficially, we might also expect them to have very similar coronal characteristics. However, Still & Hussain (2003) have derived coronal abundances for V471 Tau based on low resolution ASCA CCD pulse height spectra which are significantly larger than those derived for AB Dor by other authors using similar observational material, in addition to EUVE, XMM-Newton and Chandra spectra (Rucinski et al., 1995; Mewe et al., 1996; Ortolani et al., 1998; Maggio et al., 2000; Güdel et al., 2001; Sanz-Forcada et al., 2003). The apparent difference between the coronal abundances of the two stars might be hinting that their coronae are indeed fundamentally different. Such a dissimilarity might reflect the entirely different angular momentum evolution of the two stars: the rapid rotation of AB Dor is due to its relative youth, while that of V471 Tau is due to tidal spin-up from interaction with its close companion.
In this paper, using Chandra High and Low Energy Transmission Grating spectrograph (HETGS and LETGS) observations, we present a comparative analysis of the coronal X-ray spectra of AB Dor and V471 Tau, with particular emphasis on their abundances. We first describe the two stars and briefly review earlier work (§2), then in §3 we report on the Chandra observations and data reduction. The methods used for a differential emission measure analysis together with results obtained are shown in §4. In §5 we discuss our results on the coronal and temperature structure and report our conclusions in §6.
2. Program Stars
2.1. AB Dor
AB Doradus (HD 36705) is a young, relatively bright (V=6.9) and rapidly rotating late-type star with spectral type K0-2 V. It is an example of the very active cool stars that are just evolving onto the main sequence. Its age is estimated to be 20-30 Myr (Guirado et al., 1997; Collier-Cameron & Foing, 1997), and Innis et al. (1986) suggested that AB Dor is member of the Pleiades based on its space velocity. The main physical parameters of AB Dor are shown in Table 1. Amado et al. (2001) showed evidence of a solar-type activity cycle on AB Dor, with the starspot coverage increasing and decreasing with a period of 22-23 yr. Extensive Doppler imaging on this star has revealed the presence of a long term polar spot (Collier-Cameron & Unruh, 1994; Donati & Collier Cameron, 1997; Donati et al., 1999). The very fast rotation rate of AB Dor produces strong magnetic fields which has been investigated through Zeeman-Doppler Imaging by several authors (e.g. Donati & Collier Cameron, 1997; Donati et al., 1999). Lim et al. (1994) presented measurements of the spectrum and polarization of the rotationally modulated radio emission on AB Dor.
AB Dor was originally discovered as a bright X-ray source, with Einstein, by Pakull (1981). Since then it has been extensively observed in the ultraviolet (Rucinski et al., 1995; Moos et al., 2000; Vilhu et al., 2001) and X-rays (Vilhu et al., 1987; Collier Cameron et al., 1988; Mewe et al., 1996; Kuerster et al., 1997; Maggio et al., 2000; Güdel et al., 2001). Kuerster et al. (1997) found variability on short timescales but no long-term trend or cyclical variability of the X-ray emission. Their study showed that about 15% of the X-ray emission is rotationally modulated, indicating that at least part of the X-ray emission must have scale sizes below a stellar radius. Collier Cameron et al. (1988), Schmitt et al. (1998) and Maggio et al. (2000) have reported X-ray flares on AB Dor.
The photospheric abundances of AB Dor are relatively well studied; Vilhu et al. (1987) found a solar-like metallicity, [Fe/H]=0.10.2, based on a high resolution spectroscopic study. The Fe photospheric abundance reported for the Pleiades by several authors (e.g.; King et al., 2000; Boesgaard, 1989; Cayrel et al., 1985) show a slightly super-solar value, 0.02[Fe/H]0.15. Similar values have been reported for other elements ([O/H]=0.14 (Schuler et al., 2004), [Mg/H]=0.05 and [Si/H]=0.07 (King et al., 2000)). A low coronal iron abundance, [Fe/H]=-0.95, found by Mewe et al. (1996) using simultaneous observations with EUVE and ASCA, was confirmed by Güdel et al. (2001) using XMM-Newton data and what appears to be an “inverse FIP” effect—that elements with high First Ionization Potentials (FIPs) (e.g., C, N, O, Ne, Ar) appear enhanced relative to low FIP elements (e.g., Mg, al, Si, Fe), opposite what is observed in the solar corona (e.g. Feldman, 1992). These values were 3-5 times lower than the photospheric abundance obtained by Vilhu et al. (1987). Sanz-Forcada et al. (2003) reported coronal abundances for AB Dor based on XMM-Newton and Chandra spectra showing a similar Fe depletion.
2.2. V471 Tau
V471 Tau (BD+16 516) is a rapidly rotating relatively faint (V=9.5) detached eclipsing binary first observed by Nelson & Young (1970). The system is composed of a cool main-sequence chromospherically active K2 V star (Guinan & Sion, 1984) and a degenerate hot white dwarf (DA1.5) separated by only 3.4 stellar radii. During the primary eclipse, the hot white dwarf acts as a beaming probe for the K2 star’s atmosphere (Guinan et al., 1986). The system is thought to belong to our nearest open cluster the Hyades based on Hipparcos proper-motion and parallax measurements (Provencal et al., 1996; de Bruijne et al., 2001), although this point has been controversial (see discussion by Martin et al., 1997). The basic properties of V471 Tau are summarized in Table 1.
As discussed by Paczynski (1976), the V471 Tau system has probably been through a common-envelope (CE) stage, and the system is evolving to become a cataclysmic variable in which the K dwarf overfills its Roche lobe, leading to mass transfer onto the white dwarf. V471 Tau is often considered to be the prototypical ”precataclysmic” binary (see Bond, 1985); it is one of two known post-CE, pre-CV systems in the Hyades cluster (the other being HZ 9). Based on the same Chandra LETGS spectrum that we analyse in this paper, Drake & Sarna (2003) provided the first direct observational evidence of the CE phase of V471 Tau, demonstrating that the coronal C abundance was depleted relative to N as would be expected from the surface contamination of the K dwarf by the evolved and expanded envelope of the primary star. V471 Tau is currently the only known precataclysmic variable detected at radio wavelengths (Lim et al., 1996).
Several observers have reported a strong, complex, and variable H feature that goes from absorption to emission as the system rotates (Young et al., 1988; Skillman & Patterson, 1988). Other chromospheric lines such as the Ca II H & K and Ca II infrared triplet show similar behavior confirming that the activity is coming from the chromosphere of the K dwarf. Different authors have presented evidence for magnetically induced activity on the K dwarf based on optical and photometric flares (Young et al., 1991), X-ray flares (Young et al., 1983) and radio flaring activity (Patterson et al., 1993; Nicholls & Storey, 1999). Jensen et al. (1986) and Sion et al. (1998) found a periodic 9.25 minute modulation in the soft X-ray and EUV bands of V471 Tau, subsequently found in the optical band by Robinson et al. (1988). It is now believed that the variability is caused by rotational modulation of the magnetic white dwarf (Clemens et al., 1992; Barstow et al., 1993). Wheatley (1998) found that the rotation rate and X-ray luminosity of the K star in V471 Tau are typical of K stars found in the Pleiades.
The photospheric abundances for the Hyades open cluster, to which V471 Tau is thought to belong, are generally better determined than those for most coronally active field stars. Cayrel et al. (1985) reported an analysis of high signal-to-noise ratio Coudé spectra for 12 Hyades dwarfs, together with solar spectra for comparison, in order to obtain accurate abundances for iron and other metals in the Hyades. They determined mean Fe and Si abundances slightly higher than the solar values, [Fe/H]=0.120.03 and [Si/H]=+0.160.04. Varenne & Monier (1999) derived abundances for O I, [O/H]=+0.07 for a similar sample. Boesgaard & Budge (1989) and Varenne & Monier (1999) found, based on a sample of F stars in the Hyades, similar values for the [Fe/H]. Smith & Ruck (1997) reported a global metallicity for the Hyades cluster of [Fe/H]=+0.13 based on values determined for individual dwarfs and giants from high resolution spectra. Smith (1999) derived similar values for the Hyades K0 giants Tau and Tau. Based on low resolution X-ray CCD spectra, Still & Hussain (2003) reported coronal abundances showing only a very mild Fe abundance depletion relative to photospheric estimates, together with evidence for an inverse FIP effect. In their analysis Fe coronal abundance shows a factor of 2 depletion while Ne shows a factor of 3 enhancement, both relative to photospheric values.
3. Observations
The Chandra HETGS observation of AB Dor was carried out in 1999 September using the AXAF CCD Imaging Spectrometer (ACIS-S), while the Chandra LETGS observation of V471 Tau was carried out in 2002 January using the High Resolution Camera spectroscopic (HRC-S) detector. Both observations employed their respective detectors in their standard instrument configurations. The observations are summarized in Table 2.
Pipeline-processed (CXC software version 6.3.1) photon event lists were reduced using the CIAO software package version 2.2, and were analyzed using the IDL111Interactive Data Language, Research Systems Inc.-based PINTofALE software suite (Kashyap & Drake, 2000). In the case of V471 Tau, processing included filtering of events based on observed signal pulse-heights to reduce background (Kashyap & Drake 2000, Wargelin et al., in preparation). The analysis we have performed consisted of line identification and fitting, reconstruction of the plasma emission measure distribution including allowance for blending of the diagnostic lines used, and finally, determination of the element abundances.
The white dwarf component of V471 Tau exhibits a strong thermal continuum at long wavelengths ( 50Å), which is clearly seen in the LETG spectrum. This was studied in previous EUV observations (e.g. Barstow et al., 1992). We note, however, that this continuum contributes no significant flux shortward of 50Å.
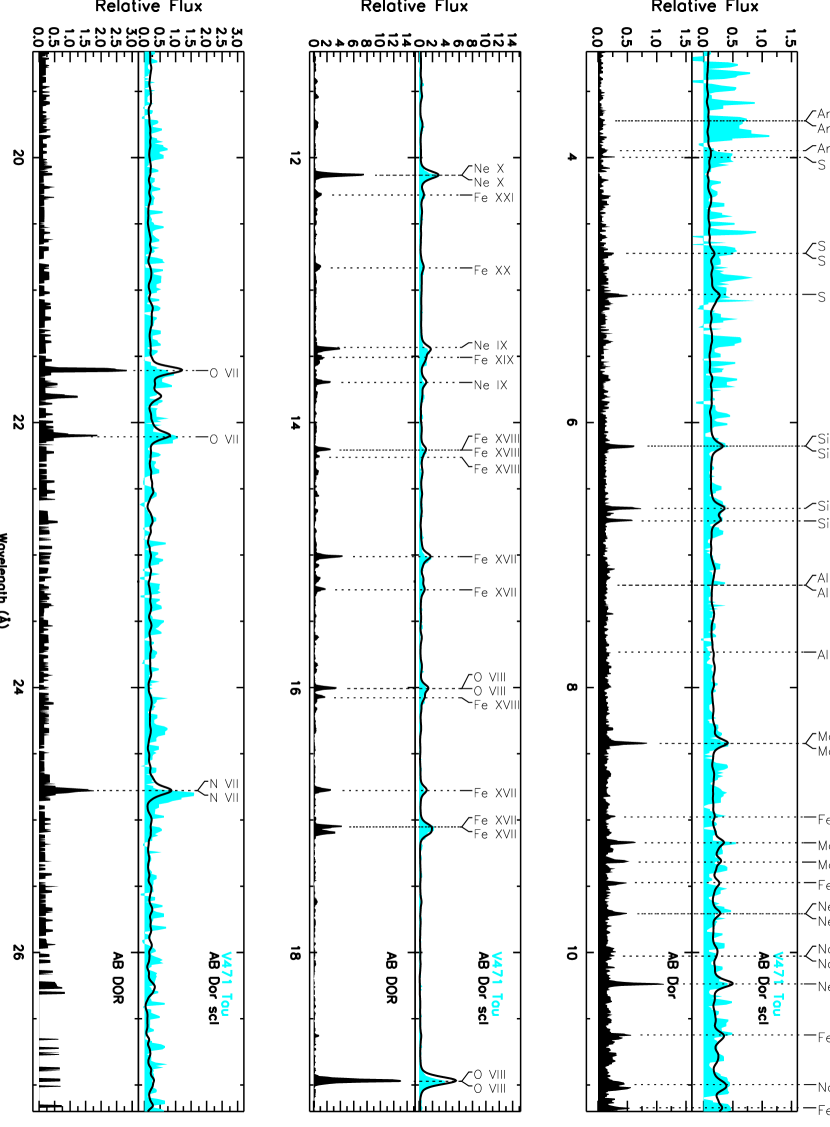
Fig. 1 shows the Chandra X-ray spectra of AB Dor (black shade; HETG+ACIS-S) and V471 Tau (grey shade; LETG+HRC-S) in the limited wavelength range 3-27 Å which contains the prominent lines of Na, N, O, Ne, Mg, Fe, S and Si. The strongest coronal lines are identified. The thick black line shows the AB Dor spectrum after smoothing in order to match the resolution of the V471 Tau spectrum. The spectra of both stars show a remarkable similarity of lines, both in terms of which lines are prominent, from H- and He-like ions and the broad range of charge states of Fe, and in their intensities. Figure 1 shows that at shorter wavelengths the spectrum is dominated by emission lines that we interpret as coronal emission from the K dwarf component.
According to the ephemeris of Guinan & Ribas (2001), the LETGS observation of V471 Tau started at phase and ended at , where when the K dwarf component is nearest the observer.
4. Analysis
4.1. Photometry
Before commencing spectral analysis, we first checked for flare activity that could affect not only the shape of the differential emission measures (DEMs) but might also be accompanied by detectable changes in the coronal abundances of the plasma that dominates disk-averaged spectra (see,e.g. Ottmann & Schmitt, 1996; Mewe et al., 1997; Ortolani et al., 1998; Favata & Schmitt, 1999; Favata et al., 2000; Maggio et al., 2000; Güdel et al., 2001). Light curves for the AB Dor and V471 Tau observations were derived using the 0th order events extracted in a circular aperture, in the case of V471 Tau, and using the dispersed photon events and excluding 0th order (to avoid photon pile-up) in the case of AB Dor. Events were then binned at 100s and 200s intervals for AB Dor and V471 Tau, respectively. Fig. 2 shows the light curves for both observations; note that both light curves are relatively flat and devoid of large flare activity.
Several authors have reported coronal rotational modulation on active stars (e.g. Drake et al., 1994; Audard et al., 2001; García-Alvarez et al., 2003), including AB Dor (Kuerster et al., 1997). However, as is shown in Fig. 2 (bottom panel), no obvious modulation of the coronal emission with orbital phase was seen on either star, though in the case of AB Dor, the observation only covers slightly more than one rotational period. In the case of V471 Tau, modulation due to modification of the underlying chromospheric structure might be expected, for example, if the part of the K dwarf corona irradiated by the white dwarf were affected by the UV radiation field of the latter. This is apparently not the case to any significant extent. A similar conclusion has also been reached by Wheatley (1998).
We conclude that both AB Dor and V471 Tau observations are representative of the stars during times of quiescence, and therefore treat the observations in their entirety for the remainder of the analysis.
4.2. Spectroscopy
Spectral line fluxes for both AB Dor and V471 Tau were measured by fitting modified Lorentzian (“-profile”) functions of the form
| (1) |
where is the amplitude and a characteristic line width. For a value of , it has been found that this function represents the Chandra transmission grating instrumental profile to within photon counting statistics for lines with a few 1000 counts or less (Drake, 2003c). Spectra line fitting was undertaken using the FITLINES utility in the PINTofALE spectral analysis package (Kashyap & Drake, 2000).222PINTofALE is freely available from http://hea-www.harvard.edu/PINTofALE/ In the case of obvious blends, as in the Ne IX-Fe XIX 13 Å region, we have performed multi-component fitting.
While strong lines can be easily identified, the sum of weak lines, each of which can be undetectable, can produce a “pseudo-continuum”. The true continuum level was set using the spectral regions 2.4-3.4, 5.3-6.3 and 19.0-20.0 Å, which we judged to be essentially “line-free”, based on both visual inspection and the examination of radiative loss models. These continuum points were then used to normalize model continua computed using a test Differential Emission Measure taken from an analysis of a typical active star (AU Mic in this case, Drake et al. (2004)). In principle, the fluxes should be re-measured once the final DEM has been determined; in practise, there was little difference in the shapes of trial and final continuum models so that this additional iterative step was not required.
The emission measure distribution and abundance analysis employed the CHIANTI database (Dere et al., 2001) and the ionization balance of Mazzotta et al. (1998), as implemented in the PINTofALE software package (Kashyap & Drake, 2000). Table 3 shows the measured fluxes of the emission lines identified and used in this analysis. We have computed correction factors (CF) for line blends by computing complimentary error functions for each contaminant (i.e. Gaussian profiles are assumed). A set of interesting lines and a set of contaminant lines, which contain necessary line information (emissivity, wvl, z, etc.), are used. The procedure identifies which lines are possible contaminants for each analysed line. The contaminants must lie within two sigma on either side of the line and be greater than a user-defined threshold. The CF are defined as follows:
| (2) |
where I() = intensity of the line being contaminated by lines . CF for line blends for the studied lines range from 0.89 to 0.99. Fig. 3 shows the comparison of our observed and blend corrected fluxes for both AB Dor and V471 Tau. Note that the fluxes are corrected for distance and exposure time.
4.3. Differential Emission Measure
We adopted the following formalism for the Differential Emission Measure. The line flux, for optically-thin plasma, for the transition of an ion between levels can be written as:
| (3) |
where A is the abundance, is a known constant which includes the frequency of the transition and the stellar distance, ne is the electron density, Gij is the contribution function and T is the electron temperature. The kernel is commonly known as the differential emission measure (DEM) and is a measure of the amount of emitting power—correlated with the amount of emitting material—as a function of temperature in the coronal plasma. It is formally defined as:
| (4) |
Two different approaches are commonly employed in the derivation of the DEM in the corona, namely, line-based methods and global fitting techniques. For the latter the parameters are determined by a minimization of the observed and trial model spectra. We prefer the former method for the greater control over the spectroscopic diagnostics entering the analysis that it allows.
A given line flux depends on both temperature and on the abundance of the element in question. For this reason, methods wishing to take advantage of bright lines from a number of different elements generally have to perform simultaneous modelling of the DEM and of abundances (see, e.g. Maggio et al., 2004; Argiroffi et al., 2004). However, the ratio of two emission lines from ions of the same element is independent of the abundance of the chosen element. We have therefore devised a method that uses line ratios instead of line fluxes directly. A similar method was developed independently by Schmitt & Ness (2004) who also discuss the benefits of such an approach. Our basic set of diagnostics comprises the H-like/He-like resonance line flux ratios for the elements O, Ne, Mg, and Si, line ratios involving Fe XVII, Fe XVIII and Fe XXI resonance lines, and measurements of the continuum flux at points in the spectrum that are essentially free of lines (the same regions noted above with regard to spectral line intensity measurement). Our method is described in more detail by (Drake et al., 2004).
The motivation underlying the development of this method lies in a desire to survey coronal abundances and trends in temperature structure independent from issues regarding atomic data. Kashyap & Drake (1998) have demonstrated that a reconstructed DEM can be quite sensitive to the lines used for the reconstruction, and also on the atomic data adopted for those lines. Our basic line set comprises the brightest lines in stellar coronal spectra and are easily measured in essentially all well-exposed Chandra grating observations of stellar coronae, such that star-to-star variations in diagnostic lines used can be avoided. The H-like and He-like ions are also likely to be represented by more accurate theoretical line intensities than lines from more complex ions. Similarly, the theoretical description of free-free and bound-free continua used in our DEM analysis is thought to be well-understood. In particular, we note that the continua in these hot coronal sources tend to be dominated by free-free emission.
4.4. Algorithm and Line Selection
In order to obtain the differential emission measure, , we have performed Markov-Chain Monte-Carlo analysis using a Metropolis algorithm (MCMC[M]) on the set of supplied line flux ratios (Kashyap & Drake, 1998). Advantages of this method include the ability to estimate uncertainties on the derived function , and the avoidance of unnecessary smoothing constraints. Eq. 4 defines the DEM as a continuous function of temperature . The MCMC[M] method yields the emission measure distribution over a pre-selected temperature grid, where the DEM is described by a simple histogram. In our case, a set of temperatures , with =0.1 and ranging from =6.1 to =8.0, define the . The derived is only reliable over a certain temperature range if we have enough lines with contribution function G() G().
The inversion problem is ill-conditioned which cannot be overcome by any fit procedure criteria applied (Craig & Brown, 1976). Nevertheless, in order to “avoid” the problem of mathematical ill-conditioning, DEM reconstruction techniques often rely on modeling the DEM as smooth splines or polynomials, and are thus artificially constrained to be smooth. We do not impose arbitrary smoothing restrictions, but instead let the algorithm find the best possible model allowed by the data (e.g.; Kashyap & Drake, 1998), while applying a variable local smoothing to the DEM. This local smoothing is based on the diagnostic information available: if there are many spectral lines in a given temperature range with different temperature sensitivities, smoothing is essentially switched off; instead, more smoothing is applied where diagnostic information is more sparse. This technique often allows solutions containing structure over small temperature ranges, whose formal significance may be judged by the sizes of the error bars that the algorithm also produces. While the reality of strongly peaked features in stellar DEMs is still in question, other techniques have found evidence for sharply peaked structures in some coronae, as illustrated, for example, by the emission measure derived for Capella using EUVE data (Dupree et al., 1993) and for the Sun using Yohkoh data (Peres et al., 2001). Although we have found a “good” solution for the DEMs, by using the local smoothing criteria, one has to keep in mind that we cannot a priori exclude other solutions in the parameter space that describe the spectra equally well.
Table 3 shows the lines used for the DEM(Tn) reconstruction. In the X-ray range analyzed, the lines with the coolest peak formation temperature are the resonance lines O VII and N VII, =6.3, while the hottest peak formation temperature is the resonance line S XVI, =7.4. Based on the lines we use in our analysis we are able to obtained a well-constrained DEM(Tn) between =6.3 and =7.4; larger uncertainties are obtained outside that range.
In order to probe the consistency of the results, depending on the line ratios used to derive the DEMs, we chose four different sets of H-like, He-like and highly ionized Fe lines. Set 1 contains H-like and He-like lines only (O, Mg, Ne, Si), Set 2 contains O, Mg, Ne, Si and S, Set 3 contains O, Si, S, Fe XVII, Fe XVIII and Fe XXI and Set 4 contains O, Ne, Mg, Si, Fe XVII, Fe XVIII and Fe XXI. Set 1 represents the basic core of H-like and He-like lines used by Drake et al. (2004) to derive DEMs. Set 2 adds sulfur to the previous set of lines, which allows us to increase the upper temperature range up to =7.4, although the significance and signal-to-noise for these lines in our spectra are low. Set 3 contains H-like and He-like lines that constrain the structure of the DEM in the upper and lower temperature range, while the iron ions give information about the structure of the DEM in the intermediate temperature range. Set 4 contains all the ions analyzed. All the sets contain O VIII, which constrains the DEM in the lower temperature range, =6.3. Note that the electron density (ne) adopted for Eq. 4 will not produce significant differences in the derived DEMs since the chosen lines are not ne-sensitive.
The MCMC[M] code returns the DEM, among any user-defined number of possible DEMs that are generated based on the MCMC method, that best reproduces the observed fluxes. As noted above, one product of our MCMC[M] method is the statistical uncertainties in evaluated at the 68% confidence level. One has to bear in mind that the error bars for consecutive bins in DEMs are not independent, owing to the inevitable cross-talk that arises as a result of the line contribution functions themselves stretching over several bins. While the DEM method imposes a degree of local smoothing, dictated by the number of diagnostic lines with significant emission in each temperature bin (see Kashyap & Drake, 1998, for details), this smoothing is not always sufficient to attenuate “high frequency oscillations” in the solution—the artifact whereby overly high values of the DEM in a given temperature bin can be compensated for by a commensurately lower value in adjacent bins.
4.5. Element Abundances
Once the DEM, , has been established, we can evaluate the abundances of any elements for which we have lines with measured fluxes. The abundance is then a simple scaling factor in the integral equation 3, and is given by the value this factor has to assume in order to match the measured flux. In this way, we derived values for the coronal abundances of the elements O, Ne, Mg, Si, S and Fe, though only upper limits were obtained for the abundances of S for V471 Tau owing to the lack of signal in both He-like and H-like features. According to previous works the photospheric abundances for AB Dor and V471 Tau are similar to the solar ones (see §2.1 and §2.2). Therefore, we will use the Grevesse & Sauval (1998) solar photospheric composition but will refer to it as stellar photospheric values. Note that we have used the new solar photospheric oxygen abundance, O/H = 8.69, derived by Allende Prieto et al. (2001).
We also used the temperature-insensitive abundance ratio diagnostics of Drake et al. (2004) as an additional check on our values obtained using the DEM. These are ratios of formed by combining two sets of lines of two different elements, constructed such that the combined emissivity curves of each set have essentially the same temperature dependence. The resulting ratio of measured line fluxes then yields directly the ratio of the abundances of the relevant elements, independent from the atmospheric temperature structure. A similar, though less sophisticated, method has been previously used in solar coronal observations (see, e.g. Feldman, 1992; Feldman & Laming, 2000) and in stellar EUVE observations (Drake et al., 1995, 1997).
5. Results and Discussion
In order to verify the propriety of our DEM and abundance techniques, we have compared observed and modelled line fluxes vs ionic species in Fig 4 (upper panel) and vs (lower panel) for the four line sets and for the final DEMs and abundances. Open symbols and filled symbols show the values for AB Dor and V471 Tau respectively. The great majority of the predicted line fluxes based on our final models are within 10 % or so of the observed values, with only four lines being discrepant by more than 20% . We address these further in §5.1 below.
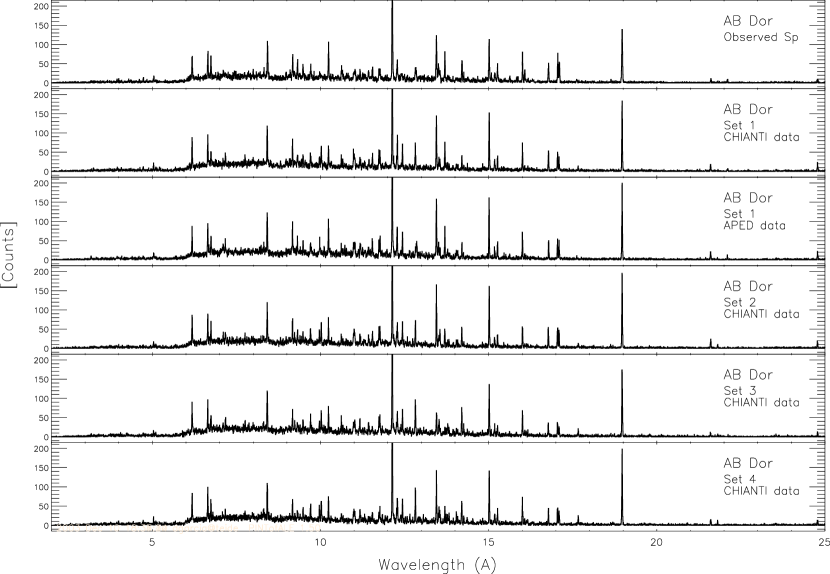
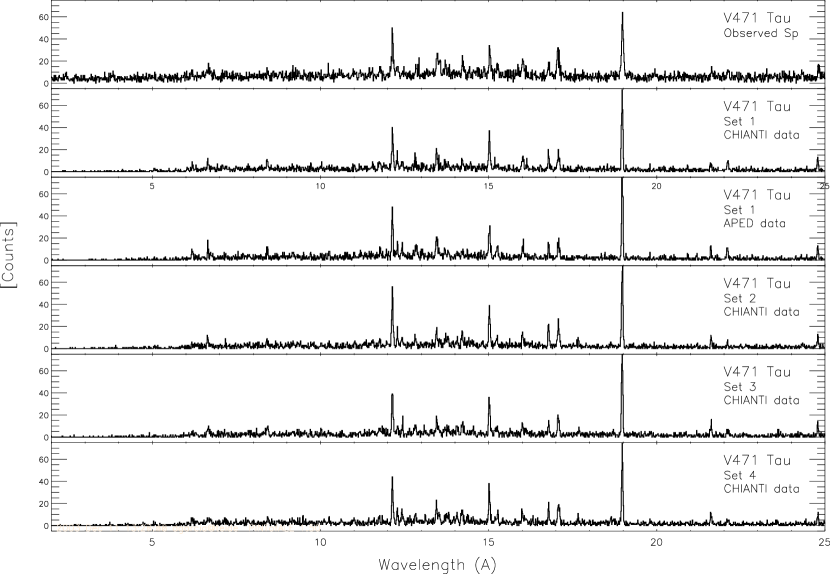
Fig 5 and Fig 6 show the observed and synthetic spectrum of AB Dor and V471 Tau. The synthetic spectra were computed using line emissivities from the CHIANTI database, and were obtained with the derived DEMs and abundances, for the four line sets. We also computed synthetic spectra using emissivities from the APED database (Smith et al., 2001), and the DEM and abundances derived from line set 1 for comparison. For these simulations, we have use an electron density of ne=5 10 for AB Dor and ne=2 10 for V471 Tau (Testa et al. 2004), with an interstellar medium column density of nH=1 10. The exact density and very low ISM column makes no practical difference to the synthetic spectra. All the spectra are remarkably similar with all the synthetic spectra showing good qualitative agreement with observations for both stars.
5.1. Temperature Structure
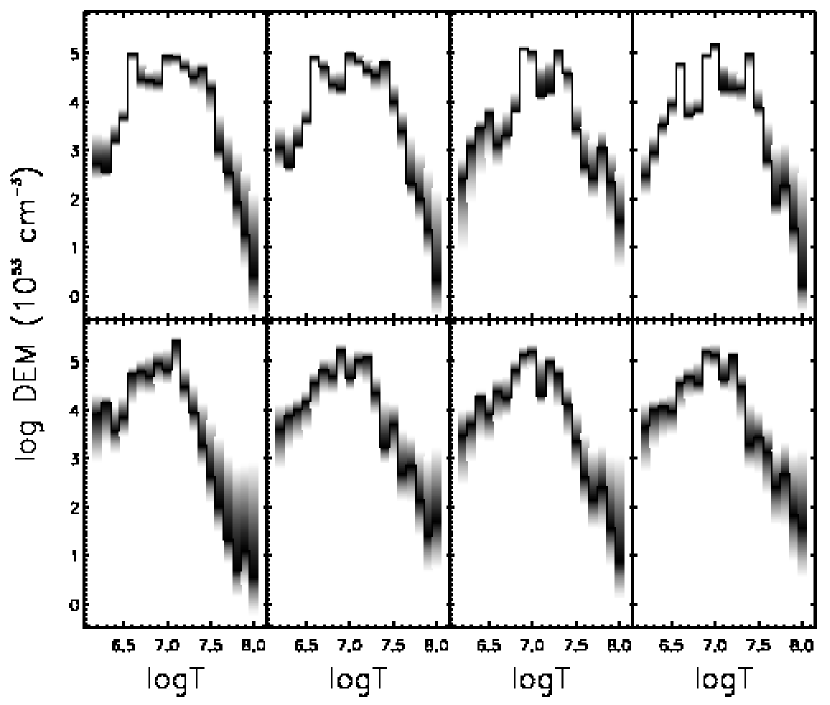
The reconstructed DEMs for AB Dor and V471 Tau, together with estimated 1 uncertainties, are shown in Fig. 7. The DEMs are all quite similar in overall shape and normalisation for the four sets of lines used. A peak at [K]7.00.1 is observed in all the reconstructions independently of the set of lines used. The DEMs for AB Dor also exhibit secondary peaks at [K] and [K]. The DEMs obtained by using the line sets with no iron ions (sets 1 and 2), show sharper increase and decrease for the lower and higher temperatures compared with ones obtained by including iron lines (sets 3 and 4), which show more prominently defined peaks. Of these, it is interesting that the DEMs for both AB Dor and V471 Tau corresponding to line set 4, containing all the ions, require the most structure.
The DEMs for both stars show little evidence for substantial amount of plasma at temperatures higher than [K]=7.4. Nevertheless, the corona of AB Dor seems to be, based on the DEMs, slightly more active than that of V471 Tau. The slopes in the derived DEMs to the low temperature side of their maxima follow very approximately the relation EMT2, which is steeper than the EMT3/2 suggested for coronal loops with constant cross-section and uniform heating (e.g.; Craig et al., 1978; Jordan, 1980; Peres et al., 2000). If the sharp peaks observed in the DEMs are real, it would imply that the corona must contain essentially isothermal structures (see also Drake et al., 2000; Scelsi et al., 2004).
Our results for AB Dor are comparable with those reported recently by Sanz-Forcada et al. (2003) based on XMM-Newton and Chandra observations. They obtained a three-peak DEM with a more smooth increase for the lower temperatures, [K]6.6, and sharp decrease for the higher temperatures, [K]7.4. The Sanz-Forcada et al. (2003) line-based DEM also shows a maximum at [K]7.00.1. To our knowledge, there exist no other DEM analysis of V471 Tau by other authors with which to compare our temperature structure results.
How reliable are the structural features observed in the DEMs? Kashyap & Drake (1998) demonstrated that solar quiet and active region DEMs are not stable to changes in the lines used in the analysis. This occurs because of a breakdown in the assumptions of optically thin plasma analysis, or (or in addition to) because of uncertainties in the underlying atomic data that are not included in the analysis. We note in passing that measurements of the O VIII and Ne X Ly/Ly ratios for AB Dor are in perfect agreement with the optically thin theoretical values (Testa et al., in preparation), so that we do not expect photon loss through, e.g., resonance scattering to be important.
The principal lines used in our analysis are simple H-like and He-like transitions for which atomic data should be reliable. The exceptions in line sets 3 and 4 are the Fe ions. Doron & Behar (2002) and Gu (2003) reported new Fe L-shell calculations indicating that rate coefficients for all n2 (3n5) transitions may differ from earlier calculations up to 50%. Moreover, these authors emphasised the importance of including in the level populations the indirect processes of radiative recombination, dielectronic recombination, and resonance excitation involving neighbouring charge states. It seems likely that problems associated either with the Fe line emissivities themselves, or with the underlying ionization balance, might be to blame for the differences in the temperature structure obtained from the different line sets. Regarding the ionization balance, we also note that dielectronic recombination (DR) tends to dominate the recombination rates for the Fe ions near their temperatures of peak population. In contrast, for H-like ions, DR is not an issue and one seems justified in having more faith in the populations of these ions. The case of He-like ions has been discussed recently by Smith et al. (2001) based on the example of O VII. Unlike the excitation of the (1s.2p) 3S1 and (1s.2p) P1,2 levels that form the upper levels of the prominent forbidden and intercombination lines, respectively, and which tend to be dominated by dielectronic recombination and cascades, the (1s.2p) 1P1 upper level of the resonance line is excited almost entirely by collisions. Thus, the He-like resonance lines should also be quite accurately represented in recent theoretical models and should provide reliable diagnostics.
As we noted earlier in §5, a small fraction of our predicted line fluxes based on final DEMs and abundances differ to those observed by % or slightly more (Fig 4). Conspicuous among these are the O VII lines in AB Dor. This small discrepancy is likely due to the lack of strong temperature constraints for the cooler temperatures—a similar, though smaller, effect is discernible at the high temperature end from S XVI. One other conspicuous point in Fig 4 belongs to Ne IX in AB Dor for line set 4 that includes Fe lines in addition to the H-like and He-like ions. Since this Ne IX predicted flux is the only discrepant point among the three line lists in which it appears, we conclude that there is no DEM solution that can accommodate both the Fe and other lines simultaneously to within their statistical uncertainties. In essence, the Fe XVII and Fe XVIII lines, that are formed at temperatures similar to those of Ne IX and Ne X, are pulling the DEM to a solution that is unfavourable to the Ne IX line.
We have argued above that atomic data uncertainties are a likely culprit for this situation. However, another possibility is that the coronal abundances are non-uniform as a function of temperature. This would also be seen in the differences between DEMs derived by using set 1 and set 2, in which we use Mg and Ne ratios for the low temperature range, and set 3 in which we swapped those ratios with Fe ones. The latter results in a much lower DEM at , near where Fe XVII ions reach maximum population. To retain a similar DEM to those obtained from line sets 1 and 2 at this temperature would require an increase in the Fe abundance at this temperature relative to the value at higher temperatures. Equally, similar agreement of the DEM’s from line sets 1, 2 and 3 might be achieved by a decrease in the Ne abundance toward higher temperatures. These arguments are qualitative and we have insufficient spectroscopic diagnostic information to investigate abundance variations with temperature in a rigorous fashion. We note, however, that such abundance variations might not be unreasonable in the light of a recent survey of coronal densities by Testa et al. (2004) that clearly demonstrates that the cooler K corona resides in quite different structures to the hotter, K plasma that appears to be universally characterised by much higher pressures. Feldman & Laming (2000) found that for the solar corona the FIP effect is larger for K than at K.
Regardless of the true cause of the differences between the DEMs obtained from different line sets, we can conclude that small-scale structure obtained in coronal DEMs is not reliable: such structure sensitive to the particular diagnostics chosen and does not necessarily reflect the true underlying temperature structure. This conclusion echoes the statements made earlier by Kashyap & Drake (1998).
The DEMs of V471 Tau are more similar among the different line sets than those of AB Dor. However, despite of their quite different evolutionary histories, we conclude that their coronae show a strong similarity in temperature structure.
5.2. Coronal Abundances
Our results for the element abundances of AB Dor and V471 Tau are summarized in Table 4. We only list statistical uncertainties here. There are of course other uncertainties in the atomic data used for the analysis, and in the calibration of the Chandra instruments. Atomic data uncertainties are probably of order 30% for Fe lines (e.g., Drake et al., 1995), but are probably slightly less than this for H-like and He-like lines. The final uncertainties in our derived abundances are difficult to assess rigorously, but are likely of order 0.1 dex.
The abundances derived are quite consistent for the different line sets considered: the abundances for each element agree even within the statistical errors except for oxygen in set 3 of AB Dor. We also notice that the abundances for oxygen and iron for both AB Dor and V471 Tau derived from set 3 are slightly higher than those derived from the other sets, an effect due to differences in the temperature structures obtained (see §5.1).
Table 5 shows the abundance ratio, from He-like and H-like ions of light elements, that are relatively insensitive to temperature (see §4.5). Those values are in agreement with the ones derived from the DEMs (Table 4), with the exception of the ratios containing iron. Atomic physics uncertainties in the iron ions might affect the values obtained for the ratios [Ne/Fe] and [Mg/Fe].
In Fig. 8 we have plotted the derived abundances, relative to the stellar photospheric values, in order of the element FIP. AB Dor and V471 Tau clearly share similarities in coronal composition: both show the same general pattern characterised by a depletion of low FIP elements by a factor of , evidence for slightly smaller depletions of intermediate FIP elements S and O, and a clear enhancement of Ne relative to elements of lower FIP. This pattern is similar to, though less extreme than, those seen in other active stars and RS CVn-type binaries(see, e.g., reviews by Drake, 2003a; Audard et al., 2003b). That the abundances found here represent real metal depletions in the coronae of both AB Dor and V471 Tau is beyond doubt. As discussed in §2, both stars have solar-like, or slightly super-solar, metal abundances and this is irreconcilable with the much lower coronal abundances of low FIP elements.
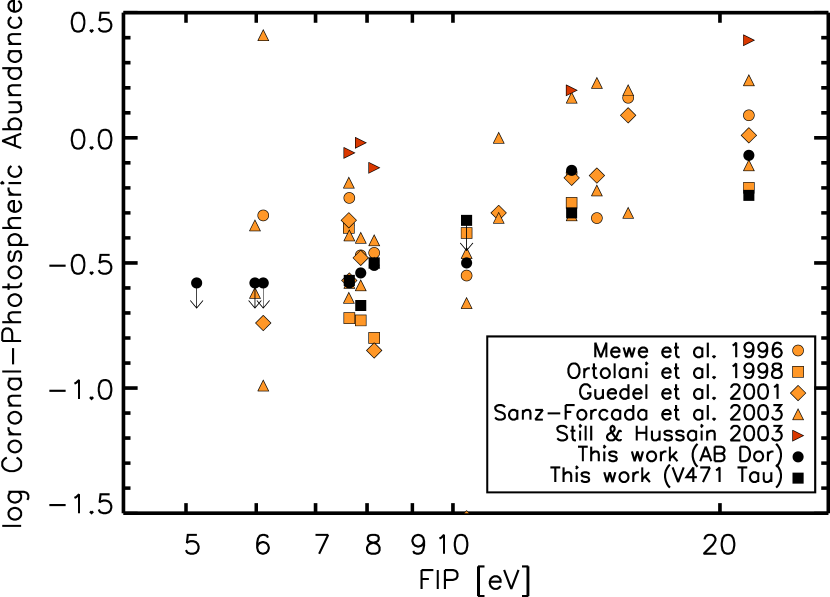
In Table 6 we list the abundance results from earlier studies of AB Dor and V471 Tau (Mewe et al., 1996; Ortolani et al., 1998; Maggio et al., 2000; Güdel et al., 2001; Sanz-Forcada et al., 2003; Still & Hussain, 2003), together with our own. The values from Güdel et al. (2001) are from the RGS results. Note that the values for S and Si are few times smaller than those obtained with EPIC from the same observations. The S value obtained with EPIC is comparable with our values and previous works on AB Dor. The results obtained from the literature are all compared in Fig. 9. It is important to remember that different authors adopt different values for “solar” photospheric abundances: for both the table and figure we have scaled the various abundance results to the photospheric scale adopted here, based on the solar mixture of Grevesse & Sauval (1998), which is similar to the stellar photospheric values derived for a few elements of the stars. Note that we have used the new solar photospheric oxygen abundance, O/H = 8.69, derived by Allende Prieto et al. (2001).
While there is good agreement in the general trend of abundances as a function of FIP, there are clearly some significant differences between the different studies. The large spread in results from the different studies appear to be a result of modelling uncertainties and possibly to improvements of the atomic database. This conclusion is reinforced by the much more favourable comparison of the results of the recent Chandra and XMM-Newton studies of AB Dor—this work compared with that of Güdel et al. (2001) and Sanz-Forcada et al. (2003).
Audard et al. (2003a), Huenemoerder et al. (2003) and Sanz-Forcada et al. (2003) have recently reported, for V824 Ara, AR LAc and AB Dor respectively, higher values for abundances of Al, Ca, and Na than for elements with slightly higher FIP suggesting a schism in the strictly inverse FIP effect scheme. In particular, Sanz-Forcada et al. (2003) obtained different values of Ca abundance for AB Dor, including a very high value of [Ca/H]=0.62 derived from the high resolution RGS spectrum. Indeed, Figure 12 of Sanz-Forcada et al. (2003) suggests that the inverse FIP effect in AB Dor undergoes a palpable reversal toward the lowest FIP elements. A similar effect was suggested by Huenemoerder et al. (2003) based on high resolution Chandra spectra of AR Lac. That there might be a difference in abundance behaviour among the low FIP elements has already been suggested on the basis of solar measurements, in which the lowest FIP elements, such as Na and Al, appear to be enhanced relative to elements such as Si and Mg (Feldman, 1992).
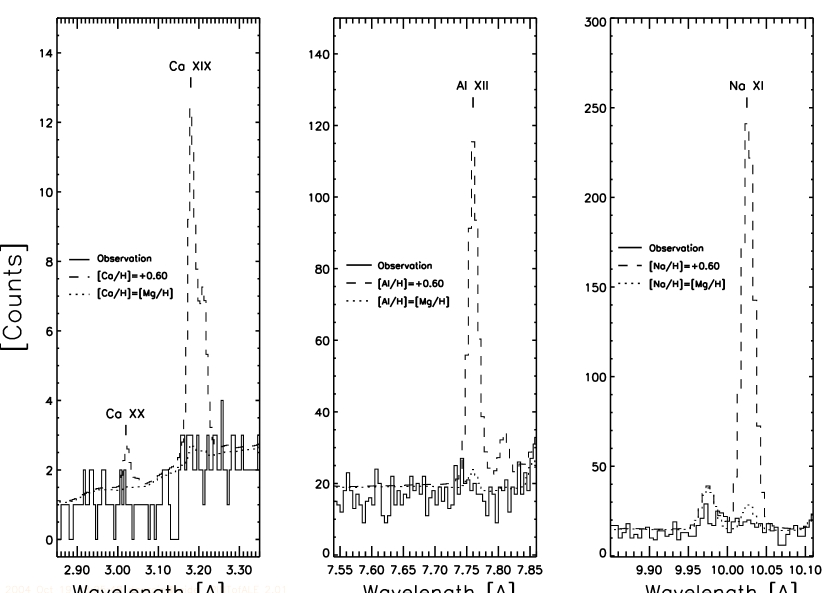
Although we have not been able to obtain definitive measurements of lines of Na, Al and Ca in our spectra of AB Dor (none were detected with any degree of significance), we have estimated approximate upper limits to the abundances of these elements through comparison of observed and synthetic spectra. Fig 10 illustrates the observed AB Dor MEG spectrum and two synthetic spectra: one computed using the abundance derived for Ca by Sanz-Forcada et al. (2003) and the other one assuming Al, Ca and Na have coronal abundances similar to Mg. The former produce extremely strong Ca XIX, Al XII and Na XI lines which are clearly not seen in the observed spectrum. The synthetic spectrum computed assuming relative coronal abundances equal to Mg for Al, Ca and Na instead provide good approximations to the observed spectrum. We conclude that the coronal abundances of Al, Ca and Na in AB Dor are similar to, or lower than, those of the other low FIP elements Mg, Si and Fe.
The coronal abundances we have derived for V471 Tau are a factor of two or less lower (factor three for Ne) than those reported by Still & Hussain (2003). This might be due to artifacts of the analysis of the low resolution ASCA pulse height spectra, though other explanations are possible. There were three modest flare events during the ASCA observation that were not filtered from the analysis of Still & Hussain (2003). It appears likely that in some flares on active stars the abundances of low FIP elements are enhanced toward their pristine photospheric values, a result tentatively interpreted as chromospheric evaporation (e.g. reviews of Audard et al., 2003b; Drake, 2003a). Flares, then, might temporarily raise the abundances of the dominant plasma at a given time, though the ASCA flares were rather small for this to present an immediately convincing explanation.
Alternatively, it is possible that the abundance patterns simply vary with time, according to the characteristics of dominant and relatively quiescent active regions, and at the time of the earlier ASCA observation the abundances were simply higher. Circumstantial evidence against such an explanation can be found in the abundance analysis of the active RS CVn-type binary HR 1099, for which independent analyses of Chandra and XMM-Newton observations obtained at different times yielded very similar values for quiescent coronal abundances (Brinkman et al., 2001; Drake et al., 2001). Moreover, Drake (2003b) has found similar abundances in the coronae of HR 1099 and its “coronal twin” the active late-type component of the Algol binary.
That our results for AB Dor and V471 Tau—coronal twins in many respects—are so similar reinforces the conclusion that coronal abundances are dependent largely on stellar parameters and do not vary substantially during times of relative coronal quiescence. It also points out that tidal interactions, which may have an influence on differential rotation and possibly on dynamo action, are not important for determinnig coronal structure (the magnetic interactions between the white dwarf and the K star components of V471 Tau does not seem to play an important role at least in the X-ray domain). However, despite the very similar coronal temperature structure and abundance patterns, the LX of V471 Tau is about twice higher than that for AB Dor (see Table 1). This difference in brightness might be within the stochastic variation range for active stars, but might also be hinting that tidal interaction could be contributing to the stellar coronae somehow.
6. Conclusions
AB Dor and V471 Tau represent a rare pair stars that have the same rotational period (P) and spectral type but quite different evolutionary histories and ages(70 Myr vs 600 Myr). As such, a comparison between their coronal properties could provide an illuminating glimpse of any fundamental underlying differences in their magnetic dynamos and activity. Based on an analysis of high resolution Chandra X-ray spectra of these stars we draw the following conclusions.
-
1.
Both the coronal temperature structure and element abundances are remarkably similar. Element abundances are characterized by an inverse-FIP type effect in which the abundances of high FIP elements are enhanced relative to those of low FIP elements. Both coronae are depleted in low FIP elements relative to their photospheres by a factor of .
- 2.
-
3.
There is no evidence for any difference in the abundances of the very low FIP (-6 eV) elements Na, Al and Ca as compared to the low FIP (-8 eV) elements Si, Mg and Fe, as some earlier work has suggested.
-
4.
Abundances derived using our method in which the DEM is obtained from a combination of the ratios of a few well-selected prominent spectral lines and continuum measurements are robust and independent of both the exact set of lines used to define the DEM and of the details of its temperature structure.
-
5.
Small-scale structure is found in the DEMs obtained based on different sets of spectral lines. Such structural details are most likely spurious artifacts arising from either errors in assumed ion populations or spectral line excitation rates, or non-uniform abundances in different coronal structures that contribute significantly to the observed X-ray emission. Coronal DEMs are strongly dependent on the input data used to derive them, as was emphasised earlier in the solar study of Kashyap & Drake (2000).
-
6.
Based on the very similar coronal characteristics of AB Dor and V471 Tau we conclude that there is no observable difference between the coronal activity of youth and high primordial angular momentum and that of tidal spin-up of an older star. In other words, the exact evolutionary state has little effect on the corona, and the parameters that dominate coronal structure and composition are rotation rate and spectral type. The latter determines of course the parameters of the convection zone, where the magnetic fields sustaining coronal activity are believed to originate, while rotation rate appears to be the dominant parameter in the amplification of these magnetic fields.
-
7.
We also note that despite the binarity of V471 Tau it does not show any significant difference in thermal structure and composition with respect to AB Dor. This would mean that tidal interactions, which may have an influence on differential rotation and possibly on dynamo action, are not important for determining coronal structure. The magnetic interactions between the white dwarf and the K star components of V471 Tau does not seem to play an important role at least in the X-ray domain. The latter conclusion was previously suggested in an analysis based on radio observations (Lim et al., 1996). Nevertheless, the observed difference in brightness between AB Dor and V471 Tau (twice higher) might be hinting that tidal interaction could be contributing to the stellar coronae somehow.
References
- Allende Prieto et al. (2001) Allende Prieto, C., Lambert, D. L.& Asplund, M. 2001, ApJ, 556, L63
- Amado et al. (2001) Amado, P. J., Cutispoto, G., Lanza, A. F., & Rodonò, M. 2001, in ASP Conf. Ser. 223: 11th Cambridge Workshop on Cool Stars, Stellar Systems and the Sun, 895
- Argiroffi et al. (2004) Argiroffi, C., Drake, J., J., Maggio, A., G., P., Sciortino, S., & Harnden, F., R. 2004, AJ
- Audard et al. (2003a) Audard, M., Drake, S. A., White, N. E., Simon, T., Singh, K. P., & Guedel, M. 2003a, in IAU Symposium
- Audard et al. (2001) Audard, M., Güdel, M., & Mewe, R. 2001, A&A, 365, L318
- Audard et al. (2003b) Audard, M., Güdel, M., Sres, A., Raassen, A. J. J., & Mewe, R. 2003b, A&A, 398, 1137
- Barstow et al. (1993) Barstow, M. A., Fleming, T. A., Diamond, C. J., Finley, D. S., Sansom, A. E., Rosen, S. R., Koester, D., Holberg, M. C., Marsh, J. B., & Kidder, K. 1993, MNRAS, 264, 16
- Barstow et al. (1992) Barstow, M. A., et al. 1992, MNRAS, 255, 369
- Boesgaard (1989) Boesgaard, A. M. 1989, ApJ, 336, 798
- Boesgaard & Budge (1989) Boesgaard, A. M. & Budge, K. G. 1989, ApJ, 338, 875
- Bond (1985) Bond, H. E. 1985, in ASSL Vol. 113: Cataclysmic Variables and Low-Mass X-ray Binaries, 15–27
- Brinkman et al. (2001) Brinkman, A. C., et al. 2001, A&A, 365, L324
- Cayrel et al. (1985) Cayrel, R., Cayrel de Strobel, G., & Campbell, B. 1985, A&A, 146, 249
- Clemens et al. (1992) Clemens, J. C., et al.1992, ApJ, 391, 773
- Collier Cameron et al. (1986) Collier Cameron, A., Bedford, D. K., Evans, T. L., Rucinski, S. M., Vilhu, O., & White, N. E. 1986, in LNP Vol. 254: Cool Stars, Stellar Systems and the Sun, 313
- Collier Cameron et al. (1988) Collier Cameron, A., Bedford, D. K., Rucinski, S. M., Vilhu, O., & White, N. E. 1988, MNRAS, 231, 131
- Collier-Cameron & Foing (1997) Collier-Cameron, A. & Foing, B. H. 1997, The Observatory, 117, 218
- Collier Cameron & Robinson (1989) Collier Cameron, A. & Robinson, R. D. 1989, MNRAS, 238, 657
- Collier-Cameron & Unruh (1994) Collier-Cameron, A. & Unruh, Y. C. 1994, MNRAS, 269, 814
- Craig & Brown (1976) Craig, I. J. D. & Brown, J. C. 1976, A&A, 49, 239
- Craig et al. (1978) Craig, I. J. D., McClymont, A. N., & Underwood, J. H. 1978, A&A, 70, 1
- de Bruijne et al. (2001) de Bruijne, J. H. J., Hoogerwerf, R., & de Zeeuw, P. T. 2001, A&A, 367, 111
- Dere et al. (2001) Dere, K. P., Landi, E., Young, P. R., & Del Zanna, G. 2001, ApJS, 134, 331
- Donati & Collier Cameron (1997) Donati, J.-F. & Collier Cameron, A. 1997, MNRAS, 291, 1
- Donati et al. (1999) Donati, J.-F., Collier Cameron, A., Hussain, G. A. J., & Semel, M. 1999, MNRAS, 302, 437
- Doron & Behar (2002) Doron, R. & Behar, E. 2002, ApJ, 574, 518
- J. Drake (1996) Drake, J. J. 1996, IAU Colloq. 152: Astrophysics in the Extreme Ultraviolet, 97
- Drake (2003a) —. 2003a, Advances in Space Research, 32, 945
- Drake (2003b) —. 2003b, ApJ, 594, 496
- Drake (2003c) —. 2003c, Chandra News, vol 9, pp. 14-17
- Drake et al. (2001) Drake, J. J., Brickhouse, N. S., Kashyap, V., Laming, J. M., Huenemoerder, D. P., Smith, R., & Wargelin, B. J. 2001, ApJ, 548, L81
- Drake et al. (1994) Drake, J. J., Brown, A., Patterer, R. J., Vedder, P. W., Bowyer, S., & Guinan, E. F. 1994, ApJ, 421, L43
- Drake et al. (2004) Drake, J. J., Laming, J. M., Lin, L., & Kashyap. 2004, ApJ
- Drake et al. (1995) Drake, J. J., Laming, J. M., & Widing, K. G. 1995, ApJ, 443, 393
- Drake et al. (1997) —. 1997, ApJ, 478, 403
- Drake et al. (2000) Drake, J. J., Peres, G., Orlando, S., Laming, J. M., & Maggio, A. 2000, ApJ, 545, 1074
- Drake & Sarna (2003) Drake, J. J. & Sarna, M. J. 2003, ApJ, 594, L55
- S. Drake (1996) Drake, S. A. 1996, ASP Conf. Ser. 99: Cosmic Abundances 215
- Dupree et al. (1993) Dupree, A. K., Brickhouse, N. S., Doschek, G. A., Green, J. C., & Raymond, J. C. 1993, ApJ, 418, L41
- Favata et al. (2000) Favata, F., Reale, F., Micela, G., Sciortino, S., Maggio, A., & Matsumoto, H. 2000, A&A, 353, 987
- Favata & Schmitt (1999) Favata, F. & Schmitt, J. H. M. M. 1999, A&A, 350, 900
- Feldman (1992) Feldman, U. 1992, Physica Scripta Volume T, 46, 202
- Feldman & Laming (2000) Feldman, U. & Laming, J. M. 2000, Phys. Scr, 61, 222
- Güdel et al. (2001) Güdel, M., et al. 2001, A&A, 365, L336
- Güdel et al. (2002) Güdel, M., Audard, M., Sres, A., Wehrli, R., Behar, E., Mewe, R., Raassen, A. J. J., & Magee, H. R. M. 2002, in ASP Conf. Ser. 277: Stellar Coronae in the Chandra and XMM-NEWTON Era, 497
- García-Alvarez et al. (2003) García-Alvarez, D., et al. 2003, A&A, 397, 285
- Grevesse & Sauval (1998) Grevesse, N. & Sauval, A. J. 1998, Space Science Reviews, 85, 161
- Gu (2003) Gu, M. F. 2003, ApJ, 593, 1249
- Guinan & Ribas (2001) Guinan, E. F. & Ribas, I. 2001, ApJ, 546, L43
- Guinan & Sion (1984) Guinan, E. F. & Sion, E. M. 1984, AJ, 89, 1252
- Guinan et al. (1986) Guinan, E. F., Wacker, S. W., Baliunas, S. L., Loesser, J. G., & Raymond, J. C. 1986, in New Insights in Astrophysics. Eight Years of UV Astronomy with IUE, 197–200
- Guirado et al. (1997) Guirado, J. C., et al. 1997, ApJ, 490, 835
- Huenemoerder et al. (2003) Huenemoerder, D. P., Canizares, C. R., Drake, J. J., & Sanz-Forcada, J. 2003, ApJ, 595, 1131
- Innis et al. (1986) Innis, J. L., Thompson, K., & Coates, D. W. 1986, MNRAS, 223, 183
- Jardine (2004) Jardine, M. 2004, A&A, 414, L5
- Jensen et al. (1986) Jensen, K. A., Swank, J. H., Petre, R., Guinan, E. F., Sion, E. M., & Shipman, H. L. 1986, ApJ, 309, L27
- Johnson (1966) Johnson, H. L. 1966, ARA&A, 4, 193
- Jordan (1980) Jordan, C. 1980, A&A, 86, 355
- Kashyap & Drake (1998) Kashyap, V. & Drake, J. J. 1998, ApJ, 503, 450
- Kashyap & Drake (2000) —. 2000, Bulletin of the Astronomical Society of India, 28, 475
- King et al. (2000) King, J. R., Soderblom, D. R., Fischer, D., & Jones, B. F. 2000, ApJ, 533, 944
- Kuerster et al. (1994) Kuerster, M., Schmitt, J. H. M. M., & Cutispoto, G. 1994, A&A, 289, 899
- Kuerster et al. (1997) Kuerster, M., Schmitt, J. H. M. M., Cutispoto, G., & Dennerl, K. 1997, A&A, 320, 831
- Lenz (1999) Lenz, D. D. 1999, ApJ, 517, 497
- Lim et al. (1996) Lim, J., White, S. M., & Cully, S. L. 1996, ApJ, 461, 1009
- Lim et al. (1994) Lim, J., White, S. M., Nelson, G. J., & Benz, A. O. 1994, ApJ, 430, 332
- Maggio et al. (2004) Maggio, A., Drake, J. J., Kashyap, V., Harnden, F. R., Micela, G., Peres, G., & Sciortino, S. 2004, ApJ
- Maggio et al. (2000) Maggio, A., Pallavicini, R., Reale, F., & Tagliaferri, G. 2000, A&A, 356, 627
- Martin et al. (1997) Martin, E. L., Pavlenko, Y., & Rebolo, R. 1997, A&A, 326, 731
- Mazzotta et al. (1998) Mazzotta, P., Mazzitelli, G., Colafrancesco, S., & Vittorio, N. 1998, A&AS, 133, 403
- Mewe et al. (1997) Mewe, R., Kaastra, J. S., van den Oord, G. H. J., Vink, J., & Tawara, Y. 1997, A&A, 320, 147
- Mewe et al. (1996) Mewe, R., Kaastra, J. S., White, S. M., & Pallavicini, R. 1996, A&A, 315, 170
- Moos et al. (2000) Moos, H. W., et al. 2000, ApJ, 538, L1
- Nelson & Young (1970) Nelson, B. & Young, A. 1970, PASP, 82, 699
- Nicholls & Storey (1999) Nicholls, J. & Storey, M. C. 1999, ApJ, 519, 850
- O’Brien et al. (2001) O’Brien, M. S., Bond, H. E., & Sion, E. M. 2001, ApJ, 563, 971
- Ortolani et al. (1998) Ortolani, A., Pallavicini, R., Maggio, A., Reale, F., & White, S. M. 1998, in ASP Conf. Ser. 154: Cool Stars, Stellar Systems, and the Sun, 1532
- Ottmann & Schmitt (1996) Ottmann, R. & Schmitt, J. H. M. M. 1996, A&A, 307, 813
- Paczynski (1976) Paczynski, B. 1976, in IAU Symp. 73: Structure and Evolution of Close Binary Systems, 75
- Pakull (1981) Pakull, M. W. 1981, A&A, 104, 33
- Patterson et al. (1993) Patterson, J., Caillault, J., & Skillman, D. R. 1993, PASP, 105, 848
- Peres et al. (2001) Peres, G., Orlando, S., Reale, F., & Rosner, R. 2001, ApJ, 563, 1045
- Peres et al. (2000) Peres, G., Orlando, S., Reale, F., Rosner, R., & Hudson, H. 2000, ApJ, 528, 537
- Pizzolato et al. (2003) Pizzolato, N., Maggio, A., Micela, G., Sciortino, S., & Ventura, P. 2003, A&A, 397, 147
- Predehl et al. (1997) Predehl, P., et al. 1997, in Proc. SPIE Vol. 3113, p. 172-180, Grazing Incidence and Multilayer X-Ray Optical Systems, Richard B. Hoover; Arthur B. Walker; Eds., 172–180
- Provencal et al. (1996) Provencal, J., Shipman, H., Hoeg, E., & Thejll, P. 1996, Bulletin of the American Astronomical Society, 28, 1380
- Raassen et al. (2002) Raassen, A. J. J., et al. 2002, A&A, 389, 228
- Ramseyer et al. (1995) Ramseyer, T. F., Hatzes, A. P., & Jablonski, F. 1995, AJ, 110, 1364
- Robinson et al. (1988) Robinson, E. L., Clemens, J. C., & Hine, B. P. 1988, ApJ, 331, L29
- Rosner et al. (1978) Rosner, R., Tucker, W. H., & Vaiana, G. S. 1978, ApJ, 220, 643
- Rucinski (1981) Rucinski, S. M. 1981, Acta Astronomica, 31, 37
- Rucinski et al. (1995) Rucinski, S. M., Mewe, R., Kaastra, J. S., Vilhu, O., & White, S. M. 1995, ApJ, 449, 900
- Sanz-Forcada et al. (2003) Sanz-Forcada, J., Maggio, A., & Micela, G. 2003, A&A, 408, 1087
- Scelsi et al. (2004) Scelsi, L., Maggio, A., Peres, G., & Gondoin, P. 2004, A&A, 413, 643
- Schmitt et al. (1998) Schmitt, J. H. M. M., Cutispoto, G., & Krautter, J. 1998, ApJ, 500, L25
- Schmitt & Ness (2004) Schmitt, J. H. M. M. & Ness, J.-U. 2002, A&A, 415, 1099
- Schuler et al. (2004) Schuler, S. C., King, J. R., Hobbs, L. M., & Pinsonneault, M. H. 2004, ApJ, 602, L117
- Singh et al. (1995) Singh, K. P., Drake, S. A., & White, N. E. 1995, ApJ, 445, 840
- Sion et al. (1998) Sion, E. M., Schaefer, K. G., Bond, H. E., Saffer, R. A., & Cheng, F. H. 1998, ApJ, 496, L29
- Skillman & Patterson (1988) Skillman, D. R. & Patterson, J. 1988, AJ, 96, 976
- Smith (1999) Smith, G. 1999, A&A, 350, 859
- Smith & Ruck (1997) Smith, G. & Ruck, M. J. 1997, A&A, 324, 1091
- Smith et al. (2001) Smith, R. K., Brickhouse, N. S., Liedahl, D. A., & Raymond, J. C. 2001, ApJ, 556, L91
- Still & Hussain (2003) Still, M. & Hussain, G. 2003, ApJ
- Testa et al. (2004) Testa, P., Drake, J. J., & Peres, G. 2004, ApJ, submitted
- Varenne & Monier (1999) Varenne, O. & Monier, R. 1999, A&A, 351, 247
- Vilhu et al. (1987) Vilhu, O., Gustafsson, B., & Edvardsson, B. 1987, ApJ, 320, 850
- Vilhu et al. (2001) Vilhu, O., Muhli, P., Mewe, R., & Hakala, P. 2001, A&A, 375, 492
- Weisskopf et al. (2002) Weisskopf, M. C., Brinkman, B., Canizares, C., Garmire, G., Murray, S., & Van Speybroeck, L. P. 2002, PASP, 114, 1
- Wheatley (1998) Wheatley, P. J. 1998, MNRAS, 297, 1145
- Young et al. (1983) Young, A., Klimke, A., Africano, J. L., Quigley, R., Radick, R. R., & van Buren, D. 1983, ApJ, 267, 655
- Young et al. (1991) Young, A., Rottler, L., & Skumanich, A. 1991, ApJ, 378, L25
- Young et al. (1988) Young, A., Skumanich, A., & Paylor, V. 1988, ApJ, 334, 397
Tables
| Spectral | Period | Distance | Active Component | i | sin | Lx | |||
|---|---|---|---|---|---|---|---|---|---|
| Star | Type | [d] | [pc] | Teff[K] | [deg] | [km s-1] | [1030 erg s-1] | ||
| AB Dor | K0-2 VaaParameters of the component that dominates X-ray activity: AB Dor and the K2 V component of V471 Tau. | 0.51bbPakull (1981) | 14.9ccGuirado et al. (1997) | ddJohnson (1966) | 0.86eeMaggio et al. (2000) | 0.76ccGuirado et al. (1997) | 60ffKuerster et al. (1994) | 93eeMaggio et al. (2000) | 0.70llDerived from our Chandra observations. |
| V471 Tau | K2 V + WDggRucinski (1981) | 0.52hhGuinan & Ribas (2001) | 48iide Bruijne et al. (2001) | jjO’Brien et al. (2001), who notes that these values are for and are somewhat sensitive to the inclination adopted; in particular the mass and radius are larger for smaller inclinations. | 0.96jjO’Brien et al. (2001), who notes that these values are for and are somewhat sensitive to the inclination adopted; in particular the mass and radius are larger for smaller inclinations. | 0.93jjO’Brien et al. (2001), who notes that these values are for and are somewhat sensitive to the inclination adopted; in particular the mass and radius are larger for smaller inclinations. | 77jjO’Brien et al. (2001), who notes that these values are for and are somewhat sensitive to the inclination adopted; in particular the mass and radius are larger for smaller inclinations. | 91kkRamseyer et al. (1995) | 1.58llDerived from our Chandra observations. |
| ObsID | Instrument | Start | Exp | |
|---|---|---|---|---|
| Star | [UT] | [ks] | ||
| AB Dor | 0016 | HETGaaCollier Cameron & Robinson (1989)+ACIS-S | 1999-10-09T11:21:09 | 52.3 |
| V471 Tau | 2523 | LETGbbPredehl et al. (1997)+HRC-S | 2002-01-24T22:30:03 | 87.5 |
| Ion | aaWeisskopf et al. (2002) | AB Dor | V471 Tau | Transition | ||
|---|---|---|---|---|---|---|
| (Å) | (Å) | (K) | (10-5 ph/cm2/s) | (10-5 ph/cm2/s) | upper lower | |
| 4.722 | 4.727 | S XVI | 7.40 | (2p) 2P3/2 (1s) 2S1/2 | ||
| 4.733 | S XVI | 7.40 | (2p) 2P1/2 (1s) 2S1/2 | |||
| 5.032 | 5.039 | S XV | 7.20 | (1s.2p) 1P1 (1s2) 1S0 | ||
| 6.177 | 6.180 | Si XIV | 7.20 | (2p) 2P3/2 (1s) 2S1/2 | ||
| 6.186 | Si XIV | 7.20 | (2p) 2P1/2 (1s) 2S1/2 | |||
| 6.647 | 6.648 | Si XIII | 7.00 | (1s.2p) 1P1 (1s2) 1S0 | ||
| 8.422 | 8.425 | Mg XII | 7.00 | (2p) 2P1/2 (1s) 2S1/2 | ||
| 8.419 | Mg XII | 7.00 | (2p) 2P3/2 (1s) 2S1/2 | |||
| 9.173 | 9.169 | Mg XI | 6.80 | (1s.2p) 1P1 (1s2) 1S0 | ||
| 10.028 | 10.029 | Na XI | 6.90 | (2p) 2P1/2 (1s) 2S1/2 | ||
| 10.023 | Na XI | 6.90 | (2p) 2P3/2 (1s) 2S1/2 | |||
| 10.998 | 11.003 | Na X | 6.70 | (1s.2p) 1P1 (1s2) 1S0 | ||
| 12.133 | 12.132 | Ne X | 6.80 | (2p) 2P3/2 (1s) 2S1/2 | ||
| 12.137 | Ne X | 6.80 | (2p) 2P1/2 (1s) 2S1/2 | |||
| 12.283 | 12.285 | Fe XXI | 7.00 | (2s2.2p3d) 3D1 (2s2.2p2) 3P0 | ||
| 13.433 | 13.447 | Ne IX | 6.60 | (1s.2p) 1P1 (1s2) 1S0 | ||
| 13.508 | 13.504 | Fe XIX | 6.90 | (2p3(2P).3d) 1D2 (2s2.2p4) 3P2 | ||
| 14.208 | 14.208 | Fe XVIII | 6.90 | (2p4(1D).3d) 2P3/2 (2s2.2p5) 2P3/2 | ||
| 14.203 | Fe XVIII | 6.90 | (2p4(1D).3d) 2D5/2 (2s2.2p5) 2P3/2 | |||
| 14.263 | 14.267 | Fe XVIII | 6.90 | (2p4(1D).3d) 2F5/2 (2s2.2p5) 2P3/2 | ||
| 15.013 | 15.015 | Fe XVII | 6.75 | (2p5.3d) 1P1 (2p6) 1S0 | ||
| 16.008 | 16.007 | O VIII | 6.50 | (3p) 2P1/2 (1s) 2S1/2 | ||
| 16.006 | O VIII | 6.50 | (3p) 2P3/2 (1s) 2S1/2 | |||
| 18.973 | 18.973 | O VIII | 6.50 | (2p) 2P1/2 (1s) 2S1/2 | ||
| 18.967 | O VIII | 6.50 | (2p) 2P3/2 (1s) 2S1/2 | |||
| 21.607 | 21.602 | O VII | 6.30 | (1s.2p) 1P1 (1s2) 1S0 | ||
| 24.777 | 24.779 | N VII | 6.30 | (2p) 2P3/2 (1s) 2S1/2 | ||
| 24.785 | N VII | 6.30 | (2p) 2P1/2 (1s) 2S1/2 |
| ElementaaThe temperature at which the function peaks. | FIPbbfootnotemark: | X/Hccfootnotemark: | AB Dorddfootnotemark: | AB Doreefootnotemark: | AB Dorfffootnotemark: | AB Dorggfootnotemark: |
|---|---|---|---|---|---|---|
| Na/H | 5.14 | 6.33 | 0.54hhfootnotemark: | 0.54hhfootnotemark: | 0.54hhfootnotemark: | 0.51hhfootnotemark: |
| Al/H | 5.98 | 6.47 | 0.54hhfootnotemark: | 0.54hhfootnotemark: | 0.54hhfootnotemark: | 0.51hhfootnotemark: |
| Ca/H | 6.11 | 6.36 | 0.54hhfootnotemark: | 0.54hhfootnotemark: | 0.54hhfootnotemark: | 0.51hhfootnotemark: |
| Mg/H | 7.65 | 7.58 | -0.56 0.03 | -0.56 0.03 | -0.61 0.03 | -0.60 0.03 |
| Fe/H | 7.87 | 7.50 | -0.57 0.04 | -0.56 0.04 | -0.47 0.03 | -0.54 0.03 |
| Si/H | 8.15 | 7.55 | -0.50 0.03 | -0.49 0.04 | -0.53 0.03 | -0.50 0.03 |
| S/H | 10.36 | 7.33 | -0.51 0.11 | -0.49 0.11 | -0.54 0.11 | -0.47 0.11 |
| O/H | 13.62 | 8.69 | -0.22 0.04 | -0.21 0.04 | +0.07 0.04 | -0.14 0.04 |
| Ne/H | 21.56 | 8.08 | -0.10 0.03 | -0.09 0.03 | -0.03 0.03 | -0.06 0.03 |
| Elementaafootnotemark: | FIPbbfootnotemark: | X/Hccfootnotemark: | V471 Tauddfootnotemark: | V471 Taueefootnotemark: | V471 Taufffootnotemark: | V471 Tauggfootnotemark: |
| Na/H | 5.14 | 6.33 | ||||
| Al/H | 5.98 | 6.47 | ||||
| Ca/H | 6.11 | 6.36 | ||||
| Mg/H | 7.65 | 7.58 | -0.58 0.17 | -0.56 0.17 | -0.57 0.16 | -0.58 0.16 |
| Fe/H | 7.87 | 7.50 | -0.70 0.12 | -0.66 0.11 | -0.64 0.09 | -0.66 0.09 |
| Si/H | 8.15 | 7.55 | -0.53 0.15 | -0.48 0.15 | -0.48 0.15 | -0.50 0.15 |
| S/H | 10.36 | 7.33 | -0.37 0.46 | -0.31 0.45 | -0.30 0.45 | -0.33 0.45 |
| O/H | 13.62 | 8.69 | -0.32 0.10 | -0.32 0.10 | -0.25 0.10 | -0.29 0.09 |
| Ne/H | 21.56 | 8.08 | -0.24 0.09 | -0.24 0.09 | -0.21 0.09 | -0.23 0.08 |
aAbundances relative to stellar photospheric values.
bFirst Ionization Potential in eV.
cAssumed photospheric abundances expressed relative to H by number on a logarithm scale where H/H=12.
dAbundances based on DEMs from O, Ne, Mg and Si.
eDitto from O, Ne, Mg, Si and S.
fDitto from O, Si, S, FeXVII, FeXVIII and FeXXI.
gDitto from O, Ne, Mg, Si, FeXVII, FeXVIII and FeXXI.
hUpper limits based on synthetic spectra estimation.
| Abundance Ratio | AB Dor | V471 Tau |
|---|---|---|
| N/O | 0.25 0.09 | 0.53 0.11 |
| O/Ne | -0.23 0.11 | -0.19 0.15 |
| Ne/Mg | 0.47 0.04 | 0.32 0.24 |
| Ne/Fe | 0.71 0.03 | 0.57 0.07 |
| Mg/Si | -0.09 0.04 | -0.09 0.22 |
| Mg/Fe | -0.18 0.05 | 0.03 0.31 |
| Si/S | 0.01 0.12 | -0.18 0.47 |
| Elementaafootnotemark: | FIPbbfootnotemark: | X/Hccfootnotemark: | AB Dorddfootnotemark: | AB Doreefootnotemark: | AB Dorfffootnotemark: | AB Dorggfootnotemark: | AB Dorhhfootnotemark: | AB Doriifootnotemark: | V471 Taujjfootnotemark: | V471 Tauiifootnotemark: |
|---|---|---|---|---|---|---|---|---|---|---|
| Na/H | 5.14 | 6.33 | -0.58kkfootnotemark: | |||||||
| Al/H | 5.98 | 6.47 | -0.62 | -0.35 | -0.58kkfootnotemark: | |||||
| Ca/H | 6.11 | 6.36 | -0.31 | -0.74 | -0.99 | 0.41 | -0.58kkfootnotemark: | |||
| Ni/H | 7.63 | 6.25 | -0.35 | -0.36 | -0.33 | -0.64 | -0.18 | |||
| Mg/H | 7.64 | 7.58 | -0.24 | -0.72 | -0.57 | -0.58 | -0.39 | -0.58 | -0.06 | -0.57 |
| Fe/H | 7.87 | 7.50 | -0.47 | -0.73 | -0.48 | -0.59 | -0.40 | -0.54 | -0.02 | -0.67 |
| Si/H | 8.15 | 7.55 | -0.46 | -0.80 | -0.85 | -0.50 | -0.41 | -0.51 | -0.12 | -0.50 |
| S/H | 10.36 | 7.33 | -0.55 | -0.38 | -1.52 | -0.66 | -0.46 | -0.50 | -0.33 | |
| C/H | 11.26 | 8.52 | -0.30 | -0.32 | +0.00 | |||||
| O/H | 13.62 | 8.69 | -0.14 | -0.26 | -0.16 | -0.31 | +0.16 | -0.13 | +0.19 | -0.30 |
| N/H | 14.53 | 7.92 | -0.32 | -0.15 | -0.21 | +0.22 | ||||
| Ar/H | 15.76 | 6.40 | +0.16 | +0.09 | -0.30 | +0.19 | ||||
| Ne/H | 21.56 | 8.08 | +0.09 | -0.20 | +0.01 | -0.11 | +0.23 | -0.07 | 0.39 | -0.23 |
aAbundances relative to stellar photospheric values.
bFirst Ionization Potential in eV.
cAssumed photospheric abundances expressed relative to H by number on a logarithm scale where H/H=12.
dMewe et al. (1996)
eOrtolani et al. (1998)
fGüdel et al. (2001) based on RGS results
gSanz-Forcada et al. (2003) based on 3-T analysis.
hSanz-Forcada et al. (2003) based on DEM analysis.
iThis work
jStill & Hussain (2003)
kUpper limits based on synthetic spectra estimation.