11email: lebzelter@astro.univie.ac.at 22institutetext: National Optical Astronomy Observatory, P.O. Box 26732, Tucson, AZ 85726, USA 33institutetext: Research School for Astronomy and Astrophysics, Australian National University, Cotter Road, Weston ACT 2611, Australia 44institutetext: Center for Excellence in Information Systems, Tennessee State University, 330 10th Avenue North, Nashville, TN 37203, USA
A study of bright Southern Long Period Variables
In this paper we present radial velocity curves of AGB variables that exhibit
various kinds of anomalies: Semiregular variables
(SRVs) with typical mira periods, SRVs exceeding the mira 2.5 mag
amplitude limit, miras with secondary maxima in their light curves, and a SRV with
a long secondary period. The stars with reliable Hipparcos parallaxes
from this and from previous studies are plotted in a logP--diagram.
Our objects nicely follow the logP--relations determined
for the LMC. This allows the pulsation mode to be identified.
While all miras fall on the fundamental mode sequence, the
SRVs fall on both the first overtone and fundamental mode sequences.
The SRVs on the fundamental mode sequence occur at both high and low
luminosities, some of them being more luminous than larger amplitude
miras. This demonstrates observationally that some parameter other than luminosity
affects the stability of long period variables, probably mass.
First overtone pulsators all show velocity amplitudes around
4 kms-1. For the fundamental mode pulsators, the velocity amplitude shows
a correlation with light amplitude. The two miras R Cen and R Nor,
known for their double-peaked light curves, have velocity curves that are
quite different. The R Nor velocity curve shows no evidence of the
double peaks, meaning that the true pulsation period is the time between
alternate minima or maxima. There is slight evidence for a double bump in the R Cen
velocity curve. It is suggested that these stars are relatively massive (3–5 M⊙).
Key Words.:
stars: late-type – stars: AGB and post-AGB – stars: evolution1 Introduction
Variability due to radial pulsation is a key feature of stars on the Asymptotic Giant Branch (AGB). These variable stars, collectively know as long-period variables (LPVs), have generally been put into main groups: miras, semiregular (SRV) and irregular variables. The General Catalogue of Variable Stars (GCVS, Kholopov et al. 1985– (88)) adopts a visual light amplitude of 2.5 mag to separate miras and semiregular variables. However, the transition between miras and SRVs is somewhat uncertain and some stars are found under both classifications in the literature.
The pulsation velocities of LPVs are best studied in the near-infrared (Hinkle et al. HHR82 (1982), Wallerstein Wallerstein85 (1985)) as the optical spectrum gives an inconclusive picture of the stellar pulsation (e.g. Wallerstein Wallerstein77 (1977)). We have successfully used the near-infrared lines to study pulsation of LPVs several times in the past (e.g. Hinkle Hinkle78 (1978), Hinkle et al. HLS97 (1997), HLJF02 (2002), Lebzelter L99 (1999), Lebzelter et al. LHH99 (1999)). Near infrared velocity data have been obtained for 18 miras and almost 30 SRVs in the Galactic field and halo. All miras show similar, sawtooth-shaped velocity curves with amplitudes between 20 and 30 kms-1 and line doubling around maximum light. SRVs have smaller velocity amplitudes and continuous, roughly sinusoidal, velocity curves. A recent summary was given by Lebzelter & Hinkle (LH02 (2002)). Most recently, we have studied the velocity variations in 12 LPVs in the globular cluster 47 Tuc (Lebzelter et al. LWHJF04 (2004)).
The aim of this paper is to contribute to our understanding of the pulsation of LPVs by studying the near-infrared velocity curves of some stars with unusual properties. For our study we selected targets showing one or several of the following outstanding behaviors:
-
•
SRVs with long periods falling into the domain of the miras (300 days). Most SRVs are found in the period range from 30 to about 150 days. However, there are a few exceptions that pulsate with, in most cases, a rather low light amplitude (i.e. below the 2.5 mag limit) but untypically long periods of 300 to 400 days. This group must be clearly distinguished from SRVs with long secondary periods (see below).
-
•
SRVs with amplitudes exceeding the 2.5 mag limit in their visual light change.
According to the GCVS definition, these stars should be miras, not SRVs. However, the GCVS includes 57 SRVs with a listed amplitude exceeding 2.5 mag (in the blue or visual range). We note that the GCVS lists the maximum amplitude found in the literature and this is not necessarily the typical amplitude. It is possible that these stars have variable amplitudes.
-
•
Miras with variable periods. There are some miras that systematically change their period, either towards shorter or longer periods. This is normally interpreted as an indication of a recent He-shell flash (e.g. Wood & Zarro WZ81 (1981)). AAVSO light curves spanning several decades have helped to identify a few miras probably falling into this group (e.g. Hawkins et al. HMF01 (2001)).
-
•
Miras with secondary maxima. A small number of miras show a secondary maximum as a regular part of their light curves. Keenan et al. (KGD74 (1974)) argued that the pulsation period which would put these stars on the normal spectral type vs. period relation for miras is actually half the period between the deep minima i.e. they there is only one maximum per normal period. A similar result was found by Feast et al. (FRC82 (1982)) from the infrared color-period relation.
We note that a common feature of the light curves of many mira variables is a small and irregular bump on the rising part of the light curve (e.g. Lockwood & Wing lw (1971)). We do not include the miras with small bumps in the present category.
-
•
SRVs with long secondary periods. About 25% of SRVs exhibit a long secondary period in their light curves, the secondary period being typically a factor 10 longer than the primary period (Wood et al. WOK04 (2004)). A catalogue of solar vicinity SRVs with large amplitude secondary periods was presented by Houk (Houk63 (1963)). The MACHO survey of the Large Magellanic Clouds (LMC) and similar programs recently brought this group into focus, when it was discovered that the secondary periods follow a period-luminosity relation (sequence D of Wood et al. Wood99 (1999)). These stars have been recently discussed in detail by Wood et al. (WOK04 (2004)), but the origin of the secondary period remains a mystery.
| Name | anomaly | Classif. | Period [d] | Sp. Type |
|---|---|---|---|---|
| R Dor | LP SRV | SRb | 338,175 | M8IIIe |
| VZ Vel | LP SRV | SRa | 317 | M6e |
| WW Cen | LP SRV | SRb | 304,150 | M5-M7 |
| W Hya | LP SRV | SRa | 361 | M7.5e-M9ep |
| ” | LA SRV | |||
| T Cen | LA SRV | SRa | 90 | K0:e-M4IIe |
| L2 Pup | LA SRV | SRb | 141 | M5IIIe-M6IIIe |
| R Cen | var. period | M | 546 | M4e-M8IIe |
| ” | s max | |||
| R Nor | s max | M | 507 | M3e-M6II |
| W Nor | LSP | SRb | 135,13001 | M4/5(III) |
| R Car | – | M | 309 | M4e-M8e |
| S Car | – | M | 149 | K5e-M6e |
| RR Sco | – | M | 281 | M6II/IIIe-M9 |
| R Hor | – | M | 408 | M5e-M8eII/III |
1 Periods from Olivier & Wood (OW03 (2003)).
In this paper, we investigate 9 LPVs that show – according to the literature – one of the behaviors listed above in their light variations. Their ’anomalies’ together with some basic stellar data are listed in Table 1. Additionally, we present results on four rather typical, bright, southern miras observed in the course of this project. The stars selected also allow us to extend beyond 500 days the period range of miras whose velocity variations have been investigated. A detailed description of each star’s behavior, as found in the literature, will be given in Section 3.
2 Observations and Data Reduction
Time series of infrared spectra in the H band were obtained in 2001 and 2002 with the 74inch telescope at Mount Stromlo Observatory, Australia. The NICMASS detector, successfully used for a preceding program at Kitt Peak National Observatory (Joyce et al. Joyce98 (1998)), was used at the coudé focus of the telescope. The resolution was set to 37000. The standard infrared observation technique was used. Spectra of each star were obtained at two different slit positions to allow sky subtraction. The spectra covered the range between 16280 and 16330 Å, including a number of second overtone CO lines, some OH lines, and a few metallic lines. This program used exactly the same instrumental setup as our monitoring program on 47 Tuc variables (Lebzelter et al. LWHJF04 (2004)). We refer to that paper for a further description of the observations and sample spectra. Our monitoring program came to an unexpected early end when Mount Stromlo Observatory was destroyed by a bushfire in early 2003. One additional spectrum for R Hor was observed later in 2003 with the Phoenix spectrograph on Gemini South using a similar wavelength range and a slightly higher resolution.
The bright stars Cet and Oph have been used as primary velocity standards (Udry et al. Udry99 (1999)). Velocities of the variables were determined by a cross correlation technique, using the IRAF task fxcor. Typical velocity uncertainties, determined from multiple observations of some stars in the same or consecutive nights, were found to be 0.4 kms-1.
Light curve data have been taken from the data bases of the AAVSO (http://www.aavso.org), the AFOEV (http://cdsweb.u-strasbg.fr/afoev) and the ASAS project (http://www.astrouw.edu.pl/gp/asas/asas.html). Phases were calculated with the periods listed in Table 1, mostly from the GCVS.
3 Velocity and light curves
Velocity curves of all 13 sample stars can been seen in Figs. 1 to 13. For each star, we briefly review the properties that are relevant to the light and velocity change, as found in the literature. We discuss the velocity curve of each object. We searched for line doubling, detected in several miras before (e.g. Hinkle et al. HHR82 (1982)), and detected it in a few stars of our sample. However, we note that the velocity resolution plus the crowding and rather small wavelength range used in our observing program would not have allowed us to detect line doubling in every case.
3.1 R Dor
At a first glance, the largest star in the sky (Bedding et al. Bedding97 (1997)) seems to be much more like a mira than a SRV. Its period of 338 d falls within the mira regime, and its late spectral type is also more typical of miras than SRVs (Feast Feast96 (1996)). The star’s spectrum sometimes shows emission lines. The GCVS lists a spectral type of M8IIIe, while Crowe & Garrison (CG88 (1988)) report a spectral class of M8 but no emission lines. Blum et al. (Blum03 (2003)) noted that this object, although one of the coolest AGB stars not classified as a mira, shows no evidence of H2O absorption in its spectrum.
R Dor’s light amplitude is smaller than that of typical miras, and its light curve shows phases of significant irregularity. Bedding et al. (Bedding97 (1997)) suggested that R Dor is actually near the edge of the Mira instability strip. The star seems to switch its dominant pulsation mode within a few cycles, showing periods of 332 and 175 d (Bedding et al. Bedding98 (1998)), which were attributed by Bedding et al. to the first and third overtones. However, with its 332 d period the star nicely falls onto the PL-relation for miras in the LMC (Wood Wood00 (2000)), which is interpreted as fundamental mode pulsation (see Section 4).
Olofsson et al. (Olof02 (2002)) analyzed the CO radio line profiles of various transitions. They found it very difficult to fit the profile of this star with their standard model. One of the explanations they suggested was that the star has highly variable mass loss.
Similarly, the light variability seen at the time of our velocity monitoring does not have a single period (Mattei Mattei04 (2004), see Fig. 1, upper panel). The velocity change appears to reflect the light change after JD2452300, a behavior typically observed in semiregular variables (Lebzelter et al. LKH00 (2000)). Interestingly, the deep minimum in the light change around JD 2452200 is not that obvious in the velocity change. This feature has also been found in a few SRVs before (Lebzelter et al. LKH00 (2000)).

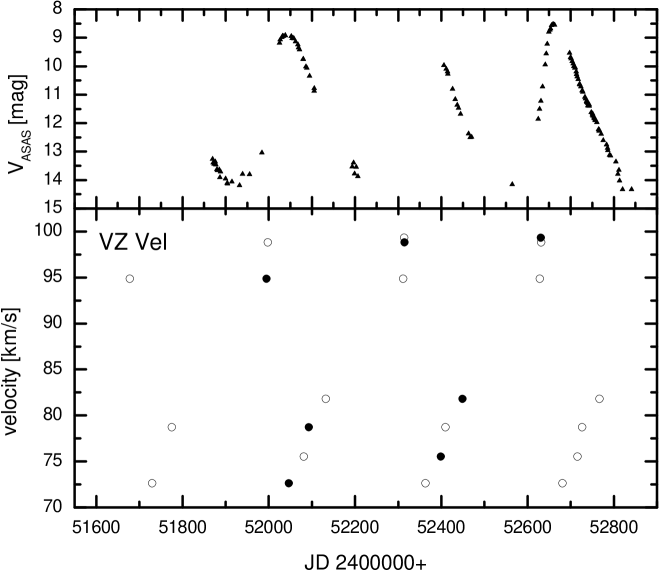
3.2 VZ Vel
VZ Vel is classified as a SRV. However, like R Dor, the long 317 d period of VZ Vel, its emission line spectrum, and its IRAS LRS class make it look more like a mira than a SRV (Kerschbaum & Hron KH96 (1996)). We assume that the classification as SRV in the GCVS is based on an early measurement of its light amplitude, which is below 2.5 mag (Payne Payne28 (1928)). Opposite to this, more recent observations from the ASAS project (Pojmanski Pojmanski02 (2002)) show a much larger light amplitude and a light change similar to a mira (see Fig. 2, upper panel).
The velocity curve of VZ Vel, which covers two cycles, is shown in Fig. 2, lower panel. The shape and amplitude of the velocity curve clearly favour the star’s classification as a mira. Line doubling was not detected. Based on the ASAS light curve and our velocity curve it is very obvious that VZ Vel has to be classified as a mira today. It is not clear why the star showed such a small amplitude in the observations made by Payne (Payne28 (1928)).
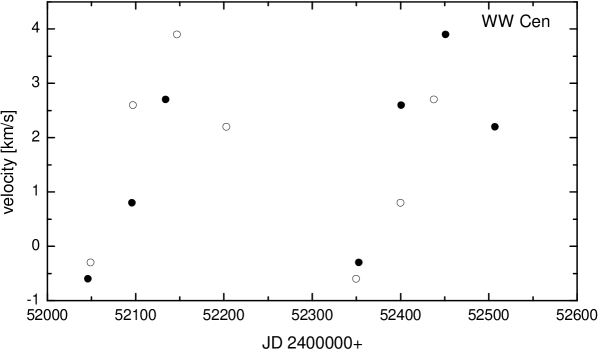
3.3 WW Cen
The GCVS lists a single 304 d period for WW Cen. However, Gaposchkin (Gapo52 (1952)) detected secondary maxima in the light curve and suggested that the star had a secondary period of about 150 days. Although AAVSO measurements do not provide any definite conclusions about the star’s period, recent measurements may support the idea of a second period. While the spectral class in the GCVS mentions no emission, Bidelman & MacConnell (BM82 (1982)) detected emission lines in the spectrum of this star.
The velocity curve for WW Cen (Fig. 3) clearly shows a period close to 304 days, although a period of 150 days can not be entirely ruled out because of the incomplete phase coverage. The velocity amplitude is about 5 kms-1 and the curve is most probably sinusoidal, both these features being typical of semiregular variables.
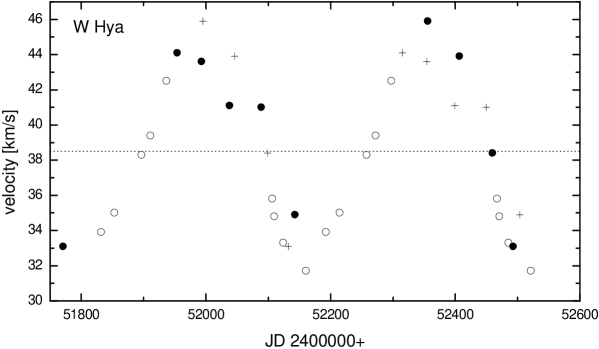
3.4 W Hya
When compared to other SRVs, both the period (361 d) and amplitude (3.9 mag in according to GCVS) of W Hya, make this star outstanding. The pulsational behavior of W Hya has been studied by Hinkle et al. (HLS97 (1997)), and we refer to that paper for a detailed description of W Hya’s stellar parameters. We acquired a second velocity time series of this star since the one obtained in the mid-80s sampled only a limited portion of the velocity cycle. A complete velocity curve obtained by combining the data sets is shown in Fig. 4 and the 361 day period is clearly evident.
The velocity curve of W Hya is rather sinusoidal with an amplitude of about 15 kms-1. The two parts of the curve, obtained 17 years apart, fit well together, showing a high degree of periodicity in the variation of this star. Scatter along the velocity curve reflects small irregularities in the light curve. The light curve parameters of this star (long period, large amplitude, periodic variations) closely resemble those of a mira. However, the semiregular classification seems more appropriate because the amplitude and sinusoidal shape of the velocity curve are clearly distinct from those of a mira.
3.5 T Cen
In addition to the large amplitude of 3.5 mag, the semiregular variable T Cen has a remarkable early spectral type during maximum (K0). From near-infrared colors, Lancon & Mouhacine (LM02 (2002)) derived effective temperatures ranging between 3600 and 4000 K. The star has sometimes been classified as a mira (e.g. Bidelman & Ratcliffe BR54 (1954)). As in most miras, emission lines of hydrogen appear regularly in the star’s spectrum (e.g. Keenan & Landi Dessy KD66 (1966)). The 90 d period seems to be very stable (Lacy Lacy73 (1973), Kiss et al. KSCM99 (1999)).
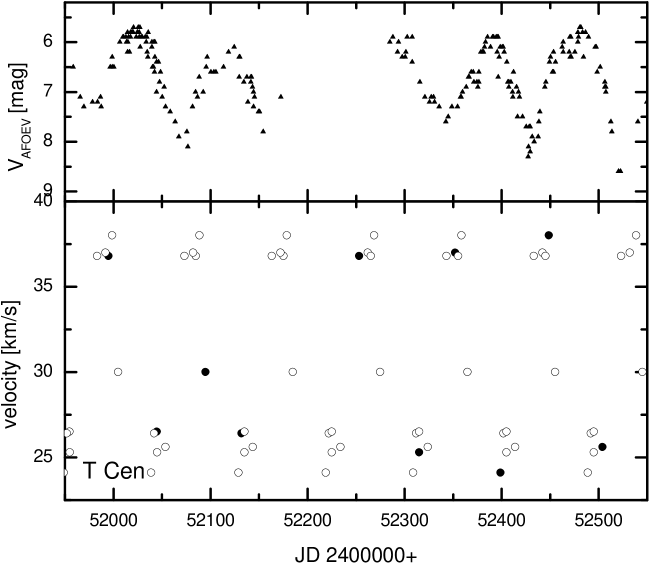
Because of the 90 d period of the star, our velocity curve of T Cen (Fig. 5) consists of data from six cycles. Obviously the repeatability of the variation is very high. Unfortunately, the data are concentrated near maximum and minimum velocity so that a definite conclusion about the shape of the velocity curve cannot be drawn. The amplitude is about 14–16 kms-1. No indication of line doubling was found.
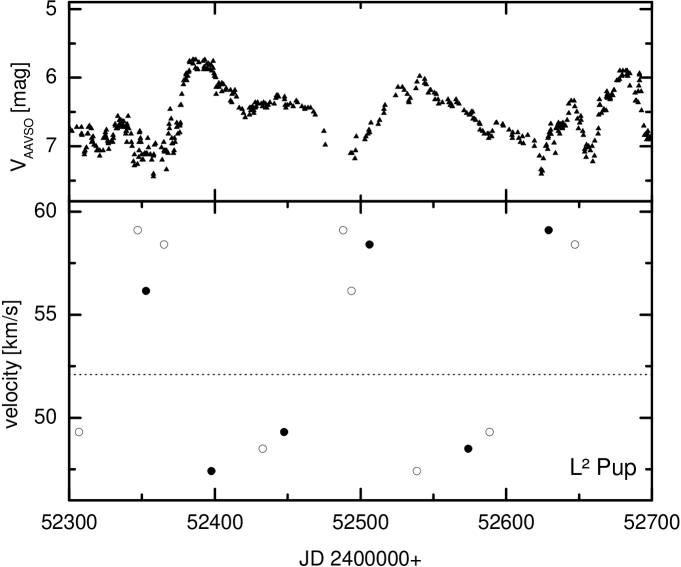
3.6 L2 Pup
This star is the third SRV in our sample with an amplitude exceeding the 2.5 mag mira limit. The GCVS gives a amplitude of 3.6 mag and a period of 141 d. From the recently obtained AAVSO light curve (Mattei Mattei04 (2004)), presented in the upper panel of Fig. 6, one would estimate a somewhat smaller light amplitude of about 2.5 mag. A light curve presented by Bedding et al. (Bedding02 (2002)) shows that over more than 104 days the amplitude never exceeded 2.5 mag. However, Bedding et al. (Bedding02 (2002)) also note that the mean visual brightness of this star has faded significantly since about 1994. As the period of L2 Pup remained rather constant over that time (and probably even since its discovery in 1872), Bedding et al. conclude that the dimming is due to obscuration by dust. Obviously, the star has still not recovered from this dimming.
Jura et al. (JCP02 (2002)) obtained mid infrared images of this star and detected an extended, asymmetric morphology. To explain mass loss, time variations of the infrared flux, and time variations of the position angle of the optical polarization, Jura et al. proposed that L2 Pup is also pulsating in a nonradial mode.
Only six velocity measurements were obtained for this star. The data mostly sample phases of maximum and minimum as shown in Fig. 6. Our radial velocity data are consistent with a 141 d period and a velocity amplitude of 12 kms-1, the latter being more typical for a semiregular variable than for a mira.
3.7 R Cen
The light variations of this mira are very remarkable. Its light curve is double peaked with a main period of 546 d and a secondary period of 274 d (e.g. Feast et al. FRC82 (1982)). In the past 50 years the long period has been steadily getting shorter and is now around 505-510 days (Hawkins et al. HMF01 (2001)). This period change of about 1 day yr-1 has been interpreted as the result of a recent He shell flash (see Wood & Zarro WZ81 (1981)). Not only the period but also the amplitude of the 500 d variation decreased in recent decades from more than 5 mag to currently about 2.5 mag (Hawkins et al., HMF01 (2001)).
This drastic change is also reflected in the velocity variations of the star. Untypically for a mira, the velocity amplitude is only about 8 kms-1 i.e. the velocity curve of R Cen is more typical of a semiregular variable rather than a mira. The velocity variations mirror the light curve as shown in Fig. 7. The long interval of almost no velocity variation, with a velocity spike just before rising light, is very unusual. Note that this velocity spike corresponds to sudden infall to the star and is in the opposite sense to the discontinuities in mira velocity curves which are caused by a shock wave pushing matter outward. We found no evidence for a shock wave in the form of line doubling in R Cen. There is clearly an unusual dynamical variation associated with pulsation of this star, and there is some slight evidence for a hump in the velocity curve as well as in the light curve.
While Keenan & Landi Dessy (KD66 (1966)) report emission lines during all maxima, data obtained later by Crowe (Crowe82 (1982)) show that H emission only occurs during the maxima corresponding to rising light i.e. at intervals of 546 d. This is consistent with the fact that the velocity curves show emergence of a velocity pulse at this time.

3.8 R Nor
Among the stars in our sample, R Nor shows the most remarkable light curve humps. Unfortunately, there is no complete light curve coverage during the time of our observations. In the uppermost panel of Fig. 8 we thus combine parallel photometric observations from the ASAS database with a representative part of the AAVSO light curve of R Nor to illustrate its outstanding variability. Secondary maxima are clearly visible during most cycles. The current data fit well with the average light curve except for somewhat less expressed minima in the ASAS data. This may result from combining CCD (ASAS) and visual (AAVSO) brightness measurements.
The star is a visual binary (GCVS, Proust et al. proust81 (1981)), a fact recently confirmed by an improved analysis of the Hipparcos data (Pourbaix et al. pourbaix (2003)). The companion has a magnitude of 13.8. The brightness of the mira varies between 7.7 and 11.55 mag, the secondary minimum is 9.5 mag (Celis celis77 (1977)). Some period variability was noted by Templeton & Mattei (TM02 (2002)).
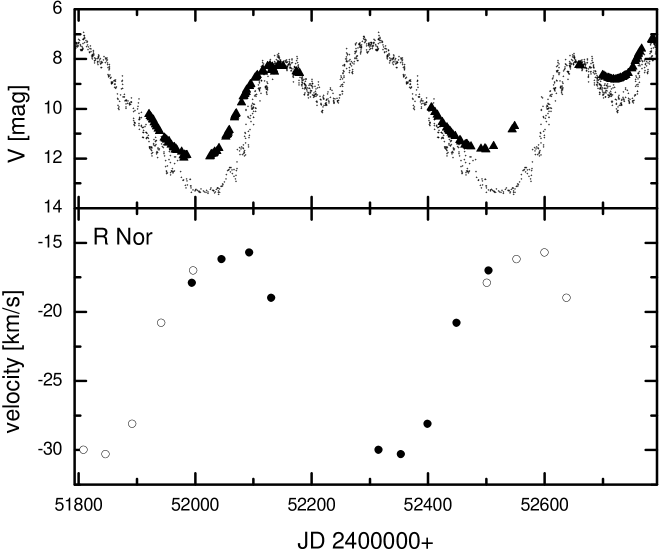
The velocity curve of R Nor is shown in Fig. 8. Although it has been suggested that the “normal” period for miras like R Nor and R Cen is the semi-period (i.e. 253.5 d for R Nor - see Sect. 1 and Jura jura94 (1994)), it is clear from the velocity curve of R Nor (and R Cen) that the true pulsation period of these stars is the full period i.e. the interval between alternate maxima or minima (507 d for R Nor).
No clear case of line doubling was detected in the spectra or in the cross-correlation profiles of R Nor. However, for spectra between JD2452040 and JD2452130, the cross correlation profile is clearly broader than at the phases before. The velocity is beginning to change rapidly at these phases as the velocity infall is reversed (possibly due to an emerging shock front) and the broad lines suggest that there is a velocity gradient through the line-forming region of the atmosphere.
3.9 W Nor
The variability of W Nor was discovered about a century ago (Pickering et al.picke01 (1901)), but only a few investigations of this star are found in the literature. Most remarkable is the star’s long secondary period of about 1300 days, approximately ten times its primary period of 135 d (Houk Houk63 (1963); Olivier & Wood OW03 (2003)). Accordingly, we have observed this star as a representative of SRVs with long secondary periods. Circumstellar material is obviously present, since silicate emission was reported by Sloan & Price (sp98 (1998)).

The velocity curve of W Nor (Fig. 9) is clearly dominated by a variation on a time scale longer than the 135 d primary period, but our monitoring covers only about one-third of the secondary 1300 d light-variation period. Variations on the shorter time scale are perhaps seen on top of the long-term changes. The velocity amplitude shown in Fig. 9 is at least 7 kms-1, and that variation seems to arise mostly from the 1300 d period.
Although the plotted light change does not indicate any long period variation it can be seen very well on the whole ASAS dataset. Our measurements seem to be close to the light maximum of the longer period, the next minimum is reached around 2452800 (compare ASAS database: http://www.astrouw.edu.pl/ gp/asas/asas.html).
3.10 R Car
R Car is a typical mira with a slight bump on the rising part of the light curve, typical of many miras. The bump is more distinct at 4.9 m than in the visual (Smith et al. SLCL02 (2002)). In current AAVSO data (Mattei Mattei04 (2004)) the hump is barely visible. The period seems to be well determined and stable (Mennessier et al. MBM97 (1997); Mattei Mattei04 (2004)). The star is a visual binary (Proust et al. proust81 (1981)).
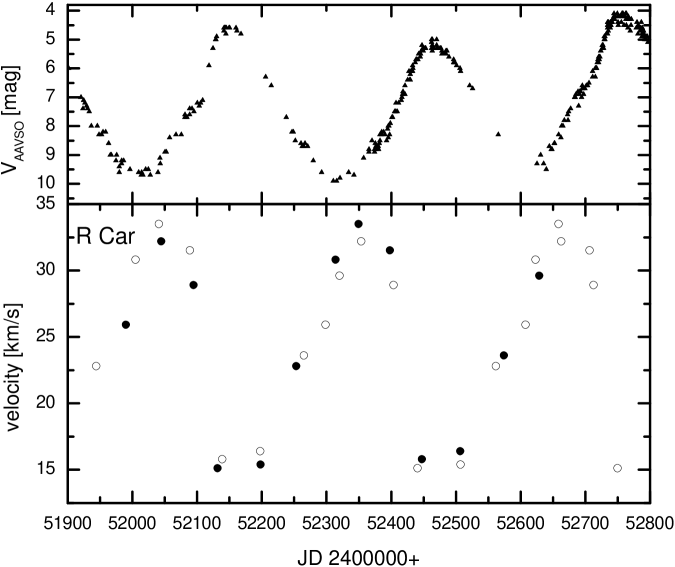
Fig. 10 shows the velocity variations of this star. The shape and amplitude are mira-like although a final decision between a continuous and a discontinuous velocity curve cannot be made with our data. The velocity curve seems to show a scatter exceeding the typical uncertainty of our measurements of 0.4 kms-1. Examination of the velocity curve shows that the scatter is due mostly to cycle-to-cycle variations. Similar scatter has been noticed previously in the velocity curves of several miras (e.g. Hinkle et al. HLS97 (1997)). We found no indication of line doubling in our spectra.
3.11 S Car
S Car belongs to the group of short period miras with intermediate metallicity (Hron hron91 (1991)). In agreement with the star’s metal-poor nature, its space velocity is very large, namely about 288 kms-1 (e.g. Wallerstein & Dominy wd88 (1988)).
Shinkawa (shinkawa73 (1973)) obtained a complete velocity curve for S Car from atomic lines around 8000 Å. The early spectral type of this star and its reduced metallicity relative to the solar value allowed her to investigate a number of almost unblended lines in that spectral region. For a few lines, two components could be resolved. Doubling of these lines in S Car was also found by Gillet et al. (gillet85 (1985)), but was interpreted by these authors as a single absorption line with an emission on top of it.
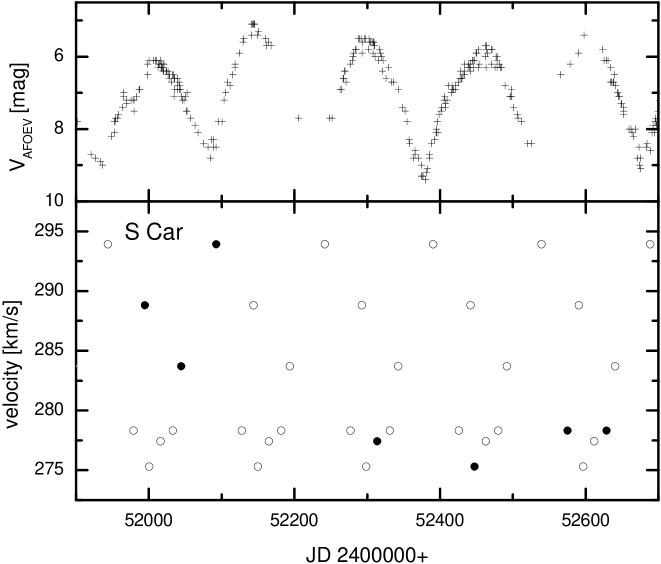
Our velocity curve of this star is presented in Fig. 11. Velocity amplitude is about 20 kms-1, with a clear line doubling observed in at least one spectrum. The curve presented by Shinkawa (shinkawa73 (1973)) has the same shape and also a similar amplitude, but significantly larger error bars, so that a more detailed comparison of the velocity data, e.g. concerning a possible phase shift, is not possible.
Velocities of Fe ii lines in the ultraviolet were measured by Wood & Karovska (wk (2000)). Between phase 0 and 0.4 the centroid velocity of the line at 2625.7 Å varied by about 20 to 25 kms-1, an amplitude similar to the near-infrared CO lines, but no clear shape of the velocity curve is visible in their data.
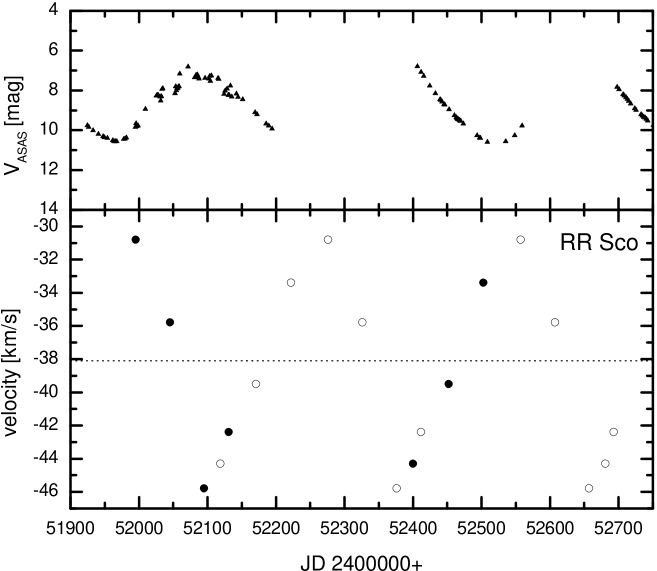
3.12 RR Sco
RR Sco is a typical mira with no obvious anomalies. The light curve, with a period of 281 d, is symmetric (Vardya vardya88 (1988)). From its velocity curve (Fig. 12) RR Sco looks like a typical mira except for its relatively small amplitude of 15.5 kms-1. However, the amplitude may be slightly larger because a data point at maximum light is missing. The correlation peak for the spectrum near JD2452000 (just before velocity velocity turnaround) is asymmetric which may suggest line doubling that was unresolved. This again would favour a slightly larger amplitude for the velocity curve. As for most miras (e.g. Lebzelter & Hinkle LH02 (2002)), the velocity curve crosses the center of mass velocity (taken from Young young95 (1995)) around phase 0.4.
3.13 R Hor
R Hor is one of the brightest southern miras. Percy & Colivas (PC99 (1999)) searched for period changes in this star, but found only a rather large point-to-point scatter in the O-C diagram.
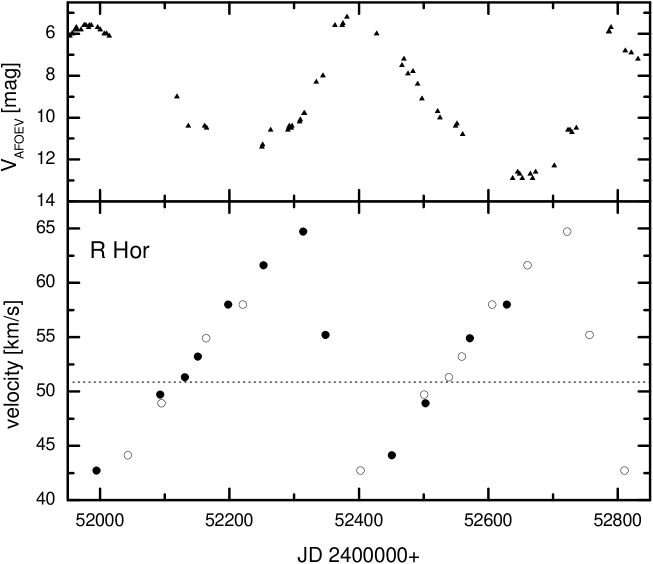
The velocity curve in Fig. 13 indicates that this star is a typical mira. Although no clear case of line doubling was detected, the cross-correlation peak for the velocity near JD2452340 is asymmetric and likely indicates unresolved line doubling. The velocity amplitude of 23 kms-1 is comparable to most miras. A center of mass velocity was taken from radio CO(3-2) observations presented by Young (young95 (1995)).
To finish this section, we show in Table 2 a summary of the results from the velocity curves.
| Name | Classif. | velocity | line | Shape |
|---|---|---|---|---|
| GCVS | amplitude | doubling | vel.-curve | |
| R Dor | SRb | 4 | no | continuous |
| VZ Vel | SRa1 | 22 | no | prob. discont. |
| WW Cen | SRb | 5 | no | prob. cont. |
| W Hya | SRa | 14.5 | no | continuous |
| T Cen | SRa | 14 | not observed | prob. cont. |
| L2 Pup | SRb | 12 | no | continuous |
| R Cen | M | 8 | no | continuous |
| R Car | M | 18.5 | not observed | prob. discont. |
| R Nor | M | 15 | likely | prob. discont. |
| W Nor | SRb | 7 | not observed | ? |
| S Car | M | 19 | yes | discontinuous |
| RR Sco | M | 15.5 | likely | discontinuous |
| R Hor | M | 23 | likely | discontinuous |
1 This star seems to be a mira (see text).
4 The logP-MK-diagram
To have an additional tool for the analysis of our results we determined absolute magnitudes for all stars with good Hipparcos parallax measurements and plotted them in a logP--diagram (left panel of Fig. 14). magnitudes were taken from Bagnulo (Bagnulo96 (1996)), Fouque et al. (Fouque92 (1992)), Kerschbaum et al. (Kerschbaum01 (2001) and references therein) and Whitelock et al. (Whitelock00 (2000)). Absolute magnitudes were then calculated using Hipparcos parallaxes (Pourbaix et al. pourbaix (2003)). The selection criterion was that the parallax of the star must be larger than two times the parallax error. Furthermore, we added all stars from our previous studies that fulfill this criterion. Finally, AGB variables from the globular cluster 47 Tuc (Lebzelter et al. LWHJF04 (2004)) also are plotted. In that paper, we presented for the first time the velocity amplitude as a function of the star’s location in the logP--diagram, which, in the case of a globular cluster, is a function of the evolutionary path of an AGB star.
The same was done in the right panel of Fig. 14, where the numbers in the figure correspond to the velocity amplitude of each star. All stars plotted in Fig. 14 are listed in Tab. 3. Solid lines indicate the approximate location of the logP--sequences B and C found for LMC stars by Wood et al. (Wood99 (1999), Wood00 (2000); see also Lebzelter et al. LWHJF04 (2004)). These two sequences likely represent fundamental and first overtone mode pulsation. Sequence C is in good agreement with the mira logP-K-relation derived by Whitelock & Feast (WF00 (2000)), combining the P-L-relation from the LMC with a zero point from the Hipparcos data (dash-dotted line). We show in our paper on the 47 Tuc variables (Lebzelter et al. LWHJF04 (2004)) that the velocity amplitude increases along sequence C, while stars on sequence B all have smaller amplitudes.
| Name | log P | vel. ampl. | ref. | |
|---|---|---|---|---|
| [kms-1] | ||||
| R Aql | 2.454 | 7.68 | 18 | 2 |
| RV Boo | 2.137 | 8.00 | 2 | 4 |
| BC CMi | 1.544 | 4.73 | 1 | 4 |
| S Car | 2.174 | 6.36 | 19 | 7 |
| R Cas | 2.634 | 7.09 | 28 | 2 |
| o Cet | 2.521 | 7.70 | 24 | 2 |
| RS CrB | 2.520 | 6.43 | 6 | 5 |
| W Cyg | 2.118 | 7.77 | 4 | 3 |
| AF Cyg | 1.966 | 7.22 | 5 | 5 |
| R Dor | 1.740 / 2.529 | 7.87 | 4 | 7 |
| TX Dra | 1.892 | 5.90 | 4 | 4 |
| g Her | 1.950 | 7.24 | 4 | 4 |
| ST Her | 2.170 | 8.11 | 3 | 4 |
| X Her | 1.978 | 7.17 | 4 | 4 |
| R Hor | 2.610 | 8.21 | 23 | 7 |
| W Hya | 2.558 | 7.69 | 15 | 7 |
| R Leo | 2.491 | 7.14 | 27 | 1 |
| SV Peg | 2.160 | 8.52 | 4 | 3 |
| L2 Pup | 2.148 | 6.18 | 12 | 7 |
| RR Sco | 2.449 | 7.78 | 16 | 7 |
| ER Vir | 1.740 | 4.95 | 2 | 4 |
| 47 Tuc V1 | 2.344 | 7.29 | 20 | 6 |
| 47 Tuc V2 | 2.308 | 7.21 | 23 | 6 |
| 47 Tuc V3 | 2.283 | 7.23 | 22 | 6 |
| 47 Tuc V4 | 2.219 | 6.81 | 18 | 6 |
| 47 Tuc V5 | 1.699 | 6.03 | 8 | 6 |
| 47 Tuc V6 | 1.681 | 6.07 | 7 | 6 |
| 47 Tuc V7 | 1.839 | 6.53 | 4 | 6 |
| 47 Tuc V8 | 2.190 | 6.80 | 16 | 6 |
| 47 Tuc V11 | 1.716 | 6.79 | 4 | 6 |
| 47 Tuc V13 | 2.643 | 5.80 | 12 | 6 |
| 47 Tuc V18 | 1.919 | 6.03 | 5 | 6 |
| 47 Tuc V21 | 1.881 | 6.72 | 7 | 6 |
We see that, with a few exceptions, our stars lie close to the two logP--relations. The two sequences can also be nicely divided by the velocity amplitude found there: stars on sequence B (first overtone) show only small velocity amplitudes, in most cases around 4 kms-1. Results from field stars and variables in 47 Tuc are in general agreement.
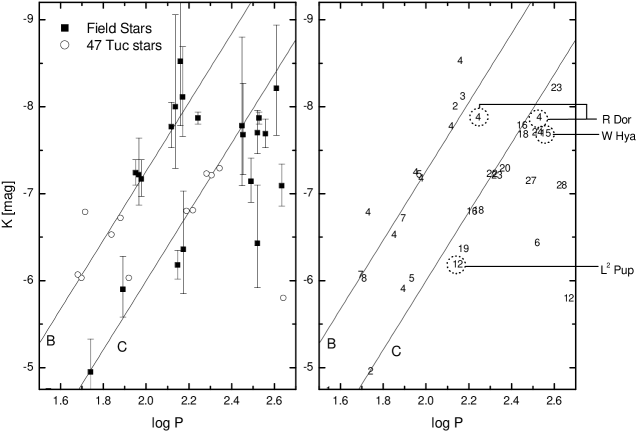
On the other hand almost all stars on sequence C (fundamental mode) show velocity amplitudes greater than 10 kms-1. An exception is R Dor (4 kms-1). Most of the field stars fall slightly below sequence C, with R Cas and R Leo being the most extreme cases. There are two likely reasons for this difference. Firstly, the parallaxes have relatively large uncertainties, as can be seen from the error bars in Fig. 14 (left panel). Note that the accuracy of Hipparcos parallaxes for AGB variables may suffer because in some cases the angular diameter is larger than their parallax (see a discussion in Whitelock & Feast WF00 (2000)). Secondly, in these cool stars the K band can be heavily affected by H2O absorption and/or circumstellar dust absorption. Since the field stars on sequence B show no obvious offset, the last possibility could explain the offset from of stars from sequence C because they typically have cooler temperatures, more extended atmospheres, more mass loss and more circumstellar absorption. This may be particularly relevant for R Cas, which has a very late spectral type (M10) at minimum and strong water absorption (Aringer et al. AKJ02 (2002)). In the following discussion, we assume that the stars with large velocity amplitudes belong to sequence C even if they fall below this sequence in Fig. 14.
5 Discussion
5.1 Long period SRVs
This group of stars (R Dor, WW Cen and W Hya) all have periods slightly longer than 300 days. Only R Dor and W Hya have parallaxes that allow them to be plotted in Fig. 14. Both these stars fall on the fundamental mode sequence, C. Thus, we have here examples of fundamental mode pulsators with smaller amplitudes of light and pulsation velocity than miras with shorter periods lower down sequence C. The reason for the small amplitude at relatively high luminosities is unclear, but it may be that these stars are more massive than the typical mira since a general feature of pulsation models for LPVs is that increasing the mass tends to decrease the instability (Fox & Wood FW82 (1982)). Although these stars have smaller amplitudes than those of miras, all four show, or have shown at some time, emission lines in their spectra, implying the presence of a shock in the stellar atmosphere. Their amplitudes are therefore still quite large at times, indicating that the modes involved are intrinsically unstable. It is very unlikely that a stochastic excitation mechanism (e.g. Dziembowski et al. Dziem01 (2001)) could produce such large amplitudes in the fundamental mode.
R Dor has a second period which lies on sequence B. Its current small velocity amplitude of only about 4 kms-1 is in good agreement with amplitudes typically found in sequence B. The relative amplitude of the two modes has varied with time (Bedding et al.Bedding98 (1998)). WW Cen also has a secondary period which, like that of R Dor, is approximately half the length of the primary period.
VZ Vel currently has a velocity curve with a shape and amplitude that identifies it as a Mira. Its original classification as a SRV suggests that the amplitude was much smaller in the past (with the same period as at present). Currently one would classify this star as a mira, but it may be related in some way to this group of objects.
It appears that a characteristic of these stars is that they have multiple modes (fundamental and first overtone, sequences C and B, respectively, being dominant), as well as time-variable amplitudes in a given mode. These stars may be in the evolutionary stage of switching from first overtone to fundamental mode. We note that the distribution of the 47 Tuc variables along the two pulsation sequences would suggest that mode switching occurs only from first overtone to fundamental mode, and not the other way, because the most luminous stars in 47 Tuc are all found on sequence C. The period and luminosity at which mode switching occurs will increase with the mass of the star.
However, for a number of stars mode switches in the opposite direction, i.e. from fundamental to first overtone, are reported in the literature (e.g. Kiss et al. Kiss00 (2000)). This may indicate that mode switches may be not be driven by evolution alone.
5.2 Large amplitude SRVs
We have analyzed three stars from this group: L2 Pup, T Cen and W Hya (which was also discussed in the last section). According to the GCVS, these objects all have light amplitudes between 3.5 and 3.9 mag. However, L2 Pup, at least in recent times, has had a significantly smaller light amplitude. AAVSO data of W Hya and T Cen show that these two stars currently have light amplitudes that clearly exceed 3 mag. All three stars show similar velocity amplitudes of 14, 12 and 14 kms-1, respectively, and clearly continuous, approximately sinusoidal velocity curves. Velocity curves of two additional large amplitude SRVs were presented in previous papers: X Oph (Hinkle et al. HSH84 (1984)) and SV Cas (Lebzelter et al. LKH00 (2000)). Both objects have velocity amplitudes in the range 1214 kms-1, and continuous rather than saw-tooth shape velocity curves.
Two of the large amplitude SRVs in this study, L2 Pup and W Hya, are plotted in Fig. 14. Both stars are found close to sequence C, although their luminosities are quite different. These large amplitude SRVs thus seem to be fundamental mode pulsators, but their pulsation is not as powerful as in the miras so that the velocity curves do not show the discontinuity associated with the emergence of a powerful shock wave through the photosphere.
In Fig. 15 we show the distribution of near infrared velocity amplitudes for all the LPVs we could find with measurements in the literature. The ordinary SRVs, which have amplitudes below 2.5 magnitudes and which make up all the first overtone pulsators on sequence B and a few of the fundamental mode pulsators at the bottom of sequence C, mostly have velocity amplitude below 10 kms-1. The miras lie in the peak with amplitudes around 23 kms-1, and at higher amplitudes. The large amplitude SRVs lie at the lower limit of the mira range.
As with the long period SRVs discussed in the last section, there must be some stellar parameter of these fundamental mode pulsators that causes them to have smaller amplitudes than the fundamental mode miras. We suggest that the reason for the lower amplitude is a slightly higher mass for the fundamental mode SRVs compared to the miras at a similar period or luminosity (see also the last subsection). Such a mass variation will cause the PL relations in Fig. 14 to have a finite width, and should indeed be part of the reason for the observed scatter.

Are the SRVs with light amplitudes exceeding 2.5 mag. common? There are 57 such SRVs (SRa or SRb) listed in the GCVS. This is about 7% of all M-type SRVs (SRa and SRb only). Periods range between 90 and more than 400 days. However, their mean period is around 250 days, thus closer to the miras regime than the typical SRVs. We also compared IRAS colors of this group with SRVs having amplitudes below 2.5 mag, but found no significant difference. Given the small number of stars in this group, it seems plausible that they are of comparably high mass.
5.3 Miras with secondary maxima
Two stars in our sample belong to this group: R Cen and R Nor. R Cen currently has both a small light and velocity amplitude for a mira (only 2.5 mag. and 8 kms-1, respectively). The velocity curve (Fig. 7) also is not typical of a mira, but rather mirrors the visual light changes, similar to the semiregular variables. The light and velocity amplitudes of R Nor are larger (7 mag and 15 kms-1, respectively), with the velocity amplitude being at the lower end of the mira velocity amplitude distribution.
Miras with double-peaked maxima are seen at high luminosities in the LMC, on sequence C (Wood et al. Wood99 (1999)). This suggests that the miras with double-peaked maxima are of high mass (3–5 M⊙). The high mass would also explain the relatively early spectral types (see Sect. 1) since the giant branch for massive stars is warmer than that for lower mass stars. The bumps seen in the light curves of these stars are probably the analogs of the bumps seen on bump Cepheid light curves, meaning that the bumps are the result of a 2-to-1 resonance between the fundamental mode and the first overtone. Indeed, Fig. 4 of Wood et al. (Wood99 (1999)) shows that the long period miras have a period ratio, fundamental to first overtone, of approximately 2/1.
5.4 Normal miras
We reported observations of four rather typical miras (S Car, R Car, RR Sco and R Hor). VZ Vel, discussed above, also – at least currently – belongs to this group. For RR Sco and R Hor we can compare the velocity curve with the center of mass velocity derived from circumstellar radio CO lines. As in almost all miras (Lebzelter & Hinkle LH02 (2002)) the velocity curve crosses the center-of-mass velocity near phase 0.4.
S Car is noteworthy as it belongs to the group of intermediate population miras. Other members of this group have been discussed in Lebzelter et al. (LHH99 (1999)). These stars show shorter periods and earlier spectral types than classical miras. Their space motion reveals that this group belongs to an older population (e.g. Hron hron91 (1991)). It was already noted in Lebzelter et al. (LHH99 (1999)) that the velocity curves of these stars cannot be distinguished from those of classical miras, and it is therefore unlikely that these stars pulsate in a different mode. With the monitoring of S Car, we confirmed this result for another object.
Bumps in the rising branch of the light curve, appear occasionally in many miras. R Car falls in this category. In addition, two stars commonly showing humps in their light curves have been observed previously, namely T Cas and T Cep (Hinkle et al. HSH84 (1984)). The question of the origin of these humps has been discussed by Lockwood & Wing (lw (1971)). They doubt the interpretation as a signature of an additionally excited first overtone mode in these stars (see e.g. the discussion in Barthes & Tuchman BT94 (1994)), because of the stochastic nature of this phenomenon. Instead, they suggest that these humps result from an interplay between rising temperature and decreasing radius during this part of the light change. In particular, they note that the temperature seems to continue its rise during the brief decline after the secondary maximum. This indicates that the radius becomes steadily smaller between the primary minimum and the primary maximum. Such humps are also visible in the light curves produced by pulsation models for miras (Feuchtinger et al. FDH93 (1993); Ya’Ari & Tuchman yt96 (1996); Hofmann et al.hsw98 (1998)).
5.5 A SRV with a long secondary period
The velocity variations of W Nor, a SRV with a long secondary period, are clearly dominated by the long period. This has been found in several other stars as well (Hinkle et al. HLJF02 (2002), Wood et al. WOK04 (2004)). Unfortunately, our time series is much too short to cover the whole pulsation cycle. Only a lower limit for the velocity amplitude can be given. However, this lower limit is already similar in value to the total velocity amplitudes observed in most other members of this group. V13 in 47 Tuc shows the largest measured amplitude of these stars in the near IR CO lines (12 kms-1).
6 Conclusions
With the help of near-infrared velocity curves we have investigated a variety of phenomena at the border between miras and SRVs. Our sample of field stars with reliable Hipparcos parallaxes roughly follows the logP--sequences found in the LMC. Nearly all stars on sequence B (first overtone mode) show similar velocity amplitudes not exceeding a few kms-1. Most of the objects pulsating in fundamental mode (sequence C) show much higher velocity amplitudes. Our result is in agreement with previous findings for LPVs in the globular cluster 47 Tuc.
SRVs with periods around 300 days, and the large amplitude SRVs which occur over a wide range of periods, all seem to be fundamental mode pulsators with smaller velocity amplitudes than those of miras with similar periods. They do not have the characteristic discontinuity in the velocity curve found for miras, although at least some of them show emission lines in their spectra. It is suggested that the smaller amplitude stars on sequence C have slightly higher mass than miras adjacent to them on this sequence.
R Nor, a mira with a secondary maximum in its light curve, has a velocity curve which does not show any evidence for a secondary maximum. This shows that the true pulsation period of the miras with secondary maxima is the interval between secondary maxima. The LMC analogs of stars like R Nor are relatively massive (3–5 M⊙) and luminous. It is suggested that the secondary maxima may be due to a resonance between the first overtone and fundamental modes.
We have argued that as a star evolves up the AGB, it generally switches mode from first overtone to fundamental mode. On the other hand, R Cen seems to be rather on the way back: the history of the star’s period decrease and light curve change favour a switch from fundamental to first overtone mode. This may be due to an ongoing Thermal Pulse, since the steady period change can be interpreted as due to a decline in luminosity i.e. evolution down the AGB.
Acknowledgements.
TL has been supported by the Austrian Academy of Science (APART programme), PRW has been partially supported by Australian Research Council grant DP0343832 and FCF’s research at Tennessee State University was partially funded by NASA grant NCC5-511 and NSF grant HRD-9706268. NOAO is operated by the Association of Universities for Research in Astronomy under cooperative agreement with the National Science Foundation. Partly based on observations obtained at the Gemini Observatory, which is operated by the Association of Universities for Research in Astronomy, Inc., under cooperative agreement with the NSF on behalf of the Gemini partnership: the National Science Foundation (US), the Particle Physics and Astronomy Research Council (UK), the National Research Council (Canada), CONICYT (Chile), the Australian Research Council, CNPq (Brazil) and CONICET (Argentina). We acknowledge with thanks the variable star observations from the AAVSO International Database contributed by observers worldwide and used in this research. Especially we wish to acknowledge the support for this and previous papers by AAVSO director Janet Mattei, who unfortunately deceased on March 22, 2004.References
- (1) Aringer, B., Kerschbaum, F., Jørgensen, U.G., 2002, A&A, 395, 915
- (2) Bagnulo, S., 1996, PhD Thesis, Queen’s University Belfast, N. Ireland
- (3) Barthes, D., Tuchman, Y., 1994, A&A, 289, 429
- (4) Bedding, T.R., Robertson, J.G., Marson, R.G., Zijlstra, A.A., von der Lühe, O., 1997, The Messenger, 87, 34
- (5) Bedding, T.R., Zijlstra, A.A., Jones, A., Foster, G., 1998, MNRAS, 301, 1073
- (6) Bedding, T.R., Zijlstra, A.A., Jones, A., et al., 2002, MNRAS, 337, 79
- (7) Bidelman, W.P., MacConnell, D.J., 1982, AJ, 87, 792
- (8) Bidelman, W.P., Ratcliffe, A.E., 1954, PASP, 66, 255
- (9) Blum, R.D., Ramirez, S.V., Sellgren, K., Olsen, K., 2003, ApJ, 597, 323
- (10) Celis, L., 1977, A&AS, 29, 15
- (11) Crowe, R.A., 1982, JAAVSO, 12 58
- (12) Crowe, R.A., Garrison, R.F., 1988, ApJS, 66, 69
- (13) Dziembowski, W.A., Gough, D.O., Houdek, G., Sienkiewicz, R., 2001, MNRAS, 328, 601
- (14) Feast, M.W., 1996, MNRAS, 278, 11
- (15) Feast, M.W., Robertson, B.S.C., Catchpole, R.M., et al., 1982, MNRAS, 201, 439
- (16) Feuchtinger, M.U., Dorfi, E.A., Höfner, S., 1993, A&A, 273, 513
- (17) Fouque, P., Le Bertre, T., Epchtein, N., Guglielmo, F., Kerschbaum, F., 1992, A&AS, 93, 151
- (18) Fox, M.W., Wood, P.R., 1982, ApJ, 259, 198
- (19) Gaposchkin, S., 1952, HA, 115, No.5
- (20) Gillet, D., Maurice, E., Bouchet, P., Ferlet, R., 1985, A&A, 148, 155
- (21) Hawkins, G., Mattei, J.A., Foster, G., 2001, PASP, 113, 501
- (22) Hinkle, K.H., 1978, ApJ, 220, 210
- (23) Hinkle, K.H., Hall, D.N.B., Ridgway, S.T., 1982, ApJ, 252, 697
- (24) Hinkle, K.H., Scharlach, W.W.G., Hall, D.N.B., 1984, ApJS, 56, 1
- (25) Hinkle, K.H., Lebzelter, T., Scharlach, W.W.G., 1997, AJ, 114, 2686
- (26) Hinkle, K.H., Lebzelter, T., Joyce, R.R., Fekel, F.C., 2002, AJ, 123, 1002
- (27) Hofmann, K.-H., Scholz, M., Wood, P.R., 1998, A&A, 339, 846
- (28) Hron, J., 1991, A&A, 252, 583
- (29) Houk, N., 1963, AJ, 68, 253
- (30) Joyce, R.R., Hinkle, K.H., Meyer, M.R., Skrutskie, M.F., 1998, Proc. SPIE Vol. 3354, 741
- (31) Jura, M., 1994, ApJ, 422, 102
- (32) Jura, M., Chen, C., Plavchan, P., 2002, ApJ, 569, 964
- (33) Keenan, P.C., Landi Dessy, J., 1966, ApJ, 146, 583
- (34) Keenan, P.C., Garrison, R.F., Deutsch, A.J., 1974, ApJS, 28, 271
- (35) Kerschbaum, F., Hron, J., 1996, A&A, 308, 489
- (36) Kerschbaum, F., Lebzelter, T., Lazaro, C., 2001, A&A, 375, 527
- 1985– (88) Kholopov, P.N., et al., 1985-88, General Catalogue of Variable Stars, 4th edition, Moscow (GCVS)
- (38) Kiss, L.L., Szatmary, K., Cadmus Jr., R.R., Mattei, J.A., 1999, A&A, 346, 542
- (39) Kiss, L.L., Szatmary, K., Szabo, G., Mattei, J.A., 2000, A&AS, 145, 283
- (40) Lacy, C.H., 1973, AJ, 78, 90
- (41) Lancon, A., Mouhacine, M., 2002, A&A, 393, 167
- (42) Lebzelter, T., 1999, A&A, 351, 644
- (43) Lebzelter, T., Hinkle, K.H., 2002, In: Radial and Nonradial Pulsations as Probes of Stellar Physics, ASP Conf. Series 259, eds. C.Aerts, T.Bedding, J.Christensen-Dalsgaard, 556
- (44) Lebzelter, T., Hinkle, K.H., Hron, J., 1999, A&A, 342, 224
- (45) Lebzelter, T., Kiss, L.L., Hinkle, K.H., 2000, A&A, 361, 167
- (46) Lebzelter, T., Wood, P.R., Hinkle, K.H., Joyce, R.R., Fekel, F.C., 2004, A&A, submitted
- (47) Lockwood, G.W., Wing, R.F., 1971, ApJ, 169, 63
- (48) Mattei, J.A., 2004, private communication
- (49) Mennessier, M.O., Boughaleb, H., Mattei, J.A., 1997, A&AS, 124, 143
- (50) Olivier, E.A., Wood, P.R., 2003, ApJ, 584, 1035
- (51) Olofsson, H., Gonzalez Delgado, D., Kerschbaum, F., Schöier, F.L., 2002, A&A, 391, 1053
- (52) Payne, C.H., 1928, HB, 860
- (53) Percy, J.R., Colivas, T., 1999, PASP, 111, 94
- (54) Pickering, E.C., Colson, H.R., Fleming, W.P., Wells, L.D., 1901, ApJ, 13, 226
- (55) Pojmanski, G., 2002, Ac.Astr., 52, 397
- (56) Pourbaix, D., Platais, I., Detournay, S., et al., 2003, A&A, 399, 1167
- (57) Proust, D., Ochsenbein, F., Pettersen, B.R., 1981, A&AS, 44, 179
- (58) Shinkawa, D., 1973, ApJS, 25, 253
- (59) Sloan, G.C., Price, S.D., 1998, ApJ S, 119, 141
- (60) Smith, B.J., Leisawitz, D., Castelaz, M.W., Luttermoser, D., 2002, AJ, 123, 948
- (61) Templeton, M.R., Mattei, J.A., 2002, IBVS, 5344
- (62) Udry, S., Mayor, M., Maurice, E., et al., 1999, in: Precise Stellar Radial Velocities, ASP Conf. Series 185, IAU Colloquium 170, eds. J.B.Hearnshaw & C.D.Scarfe, p. 383
- (63) Vardya, M.S., 1988, A&AS, 73, 181
- (64) Wallerstein, G., 1977, JRASC, 71, 298
- (65) Wallerstein, G., 1985, PASP, 97, 994
- (66) Wallerstein, G., Dominy, J.F., 1988, ApJ, 326, 292
- (67) Whitelock, P., Feast, M., 2000, MNRAS, 319, 759
- (68) Whitelock, P., Marang, F., Feast, M., 2000, MNRAS, 319, 728
- (69) Wood, B.E., Karovska, M., 2000, ApJ, 535, 304
- (70) Wood, P.R., 2000, PASA, 17, 18
- (71) Wood, P.R., Zarro, D.M., 1981, ApJ, 247, 247
- (72) Wood, P.R. and the MACHO Collaboration, 1999, in IAU Symposium 191, Asymptotic Giant Branch Stars, eds. T. Le Bertre, A. Lèbre & C. Waelkens (San Francisco: ASP), p. 151
- (73) Wood, P.R., Olivier, E., Kawaler, S., 2004, ApJ, 604, 800
- (74) Ya’Ari, A., Tuchman, Y., 1996, ApJ, 456, 350
- (75) Young, K., 1995, ApJ, 445, 872