The influence of chemical composition on the properties of Cepheid
stars
I - Period-Luminosity relation vs iron abundance††thanks: Based on observations
made with ESO Telescopes at La Silla and Paranal Observatories under proposal
ID 66.D-0571
We have assessed the influence of the stellar iron content on the Cepheid Period-Luminosity () relation by relating the band residuals from the Freedman et al (fre01 (2001)) relation to [Fe/H] for 37 Galactic and Magellanic Clouds Cepheids. The iron abundances were measured from FEROS and UVES high-resolution and high-signal to noise optical spectra. Our data indicate that the stars become fainter as metallicity increases, until a plateau or turnover point is reached at about solar metallicity. Our data are incompatible with both no dependence of the relation on iron abundance, and with the linearly decreasing behavior often found in the literature (e.g. Kennicutt et al ken98 (1998), Sakai et al sak04 (2004)). On the other hand, non-linear theoretical models of Fiorentino et al (fio02 (2002)) provide a fairly good description of the data.
Key Words.:
Stars: abundances – Stars: distances – Cepheids1 Introduction
Ever since the work of Edwin Hubble, the Cepheid Period-Luminosity () relation is a fundamental tool in determining Galactic and extragalactic distances. In spite of its paramount importance, to this day we still lack firm theoretical and empirical assessment on whether or not chemical composition has any significant influence on it.
Theoretical pulsational models by different groups lead to markedly different results. On the one side computations based on linear models (e.g. Chiosi et al chi92 (1992), Sandage et al san99 (1999), Baraffe & Alibert bar01 (2001)) suggest a mild dependence of the relation on chemical composition. The predicted change at is less than 0.1 mag at all wavelengths between the and bands for a change in metallicity from , representative of the Small Magellanic Cloud (SMC), to 0.02, typical of Galactic Cepheids at the Solar circle. This result is challenged by the outcome of the non-linear convective models (e.g. Bono et al bon99 (1999), Caputo et al cap00 (2000)), which find that both the slope and the zeropoint of the Period-Luminosity relation depend significantly on the adopted chemical composition. Again for and the same variation in metallicity as above, they predict a change as large as 0.4 magnitudes in , 0.3 magnitudes in and magnitudes in . Moreover, the change is such that metal-rich Cepheids are fainter than metal-poor ones, again at variance with the results of Baraffe & Alibert (bar01 (2001)). Recent calculations by Fiorentino et al (fio02 (2002)), also based on non-linear models, indicate that the relation also depends on the helium abundance.
Observationally, indirect measurements in external galaxies from secondary abundance indicators tend to find that metal-rich Cepheids are brighter than metal-poor ones, albeit with disappointingly large range of quoted values anywhere between 0 (Udalski et al uda01 (2001), Ciardullo et al cia02 (2002)) and (Gould gou94 (1994)). For lack of better evidence, a marginally significant dependence of was adopted in the final paper of the hst Key Project on (Freedman et al fre01 (2001)). This was largely based on the results of Kennicutt et al (ken98 (1998)) from oxygen abundances of Hii regions in two Cepheid fields in M101 () and in 10 Cepheid galaxies with Tip of the Red Giant Branch distances (). This latter method was recently applied by Sakai et al (sak04 (2004)) to a larger sample of 17 galaxies yielding . Storm et al (sto04 (2004)) assumed a metallicity difference between the Milky Way and the Small Magellanic Cloud of to derive a slope of from 5 SMC and 34 Galactic Cepheids for which they measured the distances with a Baade-Wesselink technique. Recently Groenewegen et al (gro04b (2004)) have assembled from the literature and homogenized a large sample of Cepheid stars with both distance and metallicity determinations to derive a metallicity effect of in the zero point in VIWK bands.
Compared to these previous studies, the novelty of our approach consists in measuring directly the chemical composition of Cepheid stars with know a distance, without relying on proxies such as oxygen nebular abundances derived from spectra of H II regions at the same galactocentric distance of the Cepheid field (e.g. Kennicutt et al ken98 (1998)), or secondary distance indicators like the Tip of the Red Giant Branch (e.g. Sakai et al sak04 (2004)).
2 Observations and data reduction
In order to achieve an extended coverage in metallicity, we have observed Cepheid stars in three environments known to have significantly different mean chemical compositions: the Solar Neighborhood, the Large Magellanic Cloud (LMC) and the Small Magellanic Cloud.
The spectra of the 13 Galactic stars were obtained with the FEROS
instrument (Pritchard pri04 (2004)111see also
http://www.ls.eso.org/lasilla/sciops/2p2/E2p2M/FEROS) at the
ESO 1.5m telescope on Cerro La Silla. The spectral resolution is
48,000 and the signal-to-noise ratio is about 70 to 150, depending on
the brightness of the target and on the spectral range. The 12
Cepheids in the LMC and the 12 Cepheids in the SMC were observed with
the UVES spectrograph (Kaufer et al kau04 (2004)222see also
http://www.eso.org/instruments/uves) at the VLT-Kueyen
telescope on Cerro Paranal. For them the resolution is about 40,000
and the signal-to-noise ratio about 50 to 70. The 2-D raw spectra were
run through the respective instrument pipelines, yielding to 1-D
extracted, wavelength calibrated and rectified spectra. The
normalization of the continuum was refined with the IRAF task
continuum. The 1-D spectra were corrected for heliocentric
velocity using the rvcorr and dopcor IRAF task. This
latter task was also used to apply the radial velocity correction,
which was derived from 20 FeI, FeII e MgI lines.
Selected characteristics of the programme stars are listed in Table 1.
2.1 Metallicity determination
The complete description of the method we have used to derive the metallicity for our programme stars will be presented in a forthcoming paper (Mottini et al, in preparation). Here we just summarize the salient points.
The iron content of the Cepheids was derived from the equivalent widths (EWs) of 150-200 Fe I and 10-15 Fe II unblended lines. The EWs themselves were measured semi-interactively with a software developed by one of us (PF, fitline). For about 15% of the lines it was necessary to use the splot task in IRAF, instead, because the Gaussian shape adopted by fitline could not satisfactorily reproduce the observed profile (e.g. very broad or asymmetric lines). The equivalent widths used to determine the iron content range approximately from 5 to 150 mÅ, well sampling the linear part of the curve of growth. Full details on the selection of the iron lines and their physical properties (oscillator strengths, etc.) will be given in Mottini et al (in preparation).
Following Kovtyukh & Gorlova (kov00 (2000)), we have determined the stellar effective temperature from 32 line-depths ratios. Gravity and microturbulent velocity were constrained by imposing the ionization balance and by minimizing the slope of vs EW, respectively. The LTE stellar model atmospheres by Kurucz (kur93 (1993)) and the WIDTH9 code (Kurucz kur93 (1993)) were used throughout the analysis. The detailed description of this procedure is beyond the scope of this Letter and will also be presented in Mottini et al (in preparation).
The mean value [Fe/H] is about solar for our Galactic sample, for the LMC sample and for the SMC one, with an rms of about 0.15 dex.
2.2 Periods, photometry and distances
We have adopted the periods, distance moduli and -band photometry of the Galactic Cepheids as listed in Table 3 of Storm et al (sto04 (2004)). Two of our programme stars, and , are not included in that list and for them we have used the values from Groenewegen et al (gro04b (2004), Table 3).
The periods and -band photometry for the Magellanic Cloud Cepheids were taken from Laney & Stobie (lan94 (1994)). The distance modulus of the barycenter of the LMC is assumed to be 18.50, for consistency with the relation of Freedman et al (fre01 (2001), see below). The SMC is considered 0.44 magnitudes more distant (e.g. Cioni et al cio00 (2000)). Depth and projection effects in the Magellanic Clouds were corrected for using the position angle and inclination of each galaxy as determined by van der Marel & Cioni (mar01 (2001), LMC) and Caldwell & Laney (cal91 (1991), SMC).
The periods of our programme stars range between about 5 and 65 days, thus populating the linear part of the relation, the one useful for distance determinations (e.g. Bono et al bon99 (1999)). All of stars are bona fide fundamental mode pulsators. In particular, the two stars with periods shorter than 8 days (V Cen and HV 6093) follow the fundamental mode relation of Freedman et al (fre01 (2001)), with deviations from it which are consistent with its intrinsic scatter ( and less than magnitudes, respectively).
3 The relation vs [Fe/H]
In Figure 1 we plot , the -band residuals of our programme stars from the standard relation of Freedman et al (fre01 (2001)), as a function of the iron abundance we have derived from the FEROS and UVES spectra (a positive means fainter than the mean relation). The Freedman et al (fre01 (2001)) relation was derived for the LMC as a whole and is the correction to be applied to it as a function of metallicity.
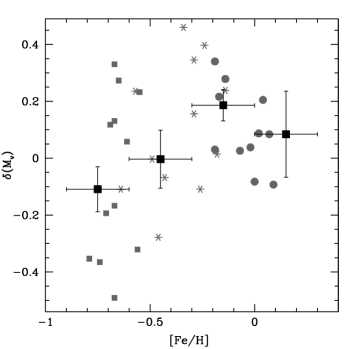

The data in Figure 1 are binned in metallicity to reflect the typical uncertainty on our determination of [Fe/H], marked by the horizontal errorbars. The median value of in each metallicity bin is plotted as filled squares, with the vertical errorbars representing its associated errors. The rms on in each bin is of the order of 0.3 mag, corresponding to the intrinsic width of the instability strip.
As it can be seen in Figure 1, our data indicate that increases with [Fe/H] up to about solar metallicity, i.e. Cepheids become fainter as metallicity increases, where it shows a turnover or a flattening. Regrettably, the rather large errorbars on do not allow us to distinguish between these two possibilities. On the other hand, the data are only marginally consistent with still rising at metallicities higher than solar: a linear extrapolation of the trend defined by the three points at lower metallicity would be away from the measured value at .
In order to enhance the statistics in the highest metallicity bin, we have included in our sample 3 stars, SZ Aql, WZ Sgr and KQ Sco, with published metallicities (Andrievsky et al 2002a ; 2002b ; ) and distances, which we have derived by combining the radii measured by Laney & Stobie (lan95 (1995)) with -band photometry (Laney & Stobie lan94 (1994)) and the surface brightness calibration of Groenewegen (gro04a (2004)). The result is shown as an open square in Figure 1. With this addition, the fact that keeps rising up to super-solar metallicity can be excluded at the level.
3.1 Comparison with previous results
Let us now use a technique to compare our data to selected previous results:
-
•
null hypothesis, i.e. no dependence of on [Fe/H]: the test returns a value of 13.5. For 3 degrees of freedom, this means that the hypothesis can be discarded at the 99.6% level. The data can be reconciled with the null hypothesis if a distance modulus of 18.2-18.3 is used for the LMC ( for 3 degrees of freedom). Such a short distance, however, seems nowadays to be rather implausible (e.g., Romaniello et al rom00 (2000), Walker wal03 (2003), Alcock et al alc04 (2004), Borissova et al bor04 (2004))
-
•
monotonically decreasing (e.g. Kennicutt et al ken98 (1998), Sakai et al sak04 (2004), Storm et al sto04 (2004), Groenewegen et al gro04b (2004)): notably, this sort of behavior was used in the final paper of the hst Key Project on (Freedman et al fre01 (2001)). As an illustration, we report in Figure 1 the classical results of Kennicutt et al (ken98 (1998), , open circles and solid line). The test on it returns a value of 28, meaning that it is incompatible with our data with a confidence higher than 99.95%.
-
•
theoretical models by Fiorentino et al (fio02 (2002)): these are the outcome of non-linear pulsation computations and predict a non-monotonic behavior of with [Fe/H]. Following the prescriptions in that paper, we have computed the value of in each metallicity bin by combining the theoretical Period-Luminosity-Color () relations as a function of metal content (see their Table 4) with the observed periods and colors of our stars. The use of the relations supplies individual absolute magnitudes, thus avoiding deceptive uncertainties due to the intrinsic width of the instability strip. In the left panel of Figure 1 we report as a dashed line the results for the models with a helium-to-iron enrichment of . The value for this model is 4.2 which, for 3 degrees of freedom, indicates a fairly good agreement with the data. The other two models presented in Fiorentino et al (fio02 (2002)), , also result in similarly acceptable values of .
4 Discussion and conclusions
We have assessed the influence of the stellar iron content on the Cepheid Period-Luminosity () relation by relating the band residuals from the Freedman et al (fre01 (2001)) relation to [Fe/H] for 37 Galactic and Magellanic Clouds Cepheids. The iron abundance was measured from FEROS and UVES high-resolution and high-signal to noise optical spectra. The novelty of our approach consists in measuring directly the chemical composition of Cepheid stars with a known distance, without relying on proxies such as oxygen nebular abundances derived from spectra of H II regions at the same galactocentric distance of the Cepheid field (e.g. Kennicutt et al ken98 (1998)), or secondary distance indicators like the Tip of the Red Giant Branch (e.g. Sakai et al sak04 (2004)). Here we have concentrated on the influence of the iron content, but the very same analysis can be applied to any other chemical species (Mottini et al, in preparation).
Our results are summarized in Figure 1 (filled squares), together with the empirical results of Kennicutt et al (ken98 (1998)) in two Cepheid fields in M101 (open circles and solid line) and the theoretical predictions by Fiorentino et al (fio02 (2002)) from non-linear pulsational models (dashed line). The data indicate that , the correction to a metal-independent relation, increases as the iron content increases, i.e. the stars become fainter as the metallicity increases, until a flattening or a turnover is reached at about solar metallicity. The possibility that the increasing trend continues at higher metallicities, while it cannot be ruled out completely by the current data, is disfavored at the level.
Applying a technique, the null hypothesis, i.e. no dependence of the relation on the iron content, can be excluded at the 99.6% level. Also, empirical monotonically decreasing linear relations (e.g. Kennicutt et al ken98 (1998), Sakai et al sak04 (2004), Storm et al sto04 (2004), Groenewegen et al gro04b (2004)) are incompatible with our data with a confidence level higher than 99.95%. A better agreement is found with the theoretical models of Fiorentino et al (fio02 (2002)), which do predict a non-monotonic behavior with a turnover at about solar metallicity. The value is 4.2 (3 degrees of freedom) for their model with , plotted as a dashed line in Figure 1. A similarly good agreement is found for their models with and .
It is apparent from an inspection of Figure 1 that, because of the limited number of stars, the errorbars on the data are quite large. However, the error on scales as the square root of the number of stars in each bin. It is, then, just a matter of gathering a larger sample of stars and apply the method we have outlined here to characterize in detail the dependence of the Cepheid relation on the stellar chemical composition.
Acknowledgements.
We warmly thank Emanuela Pompei for carrying out part of the FEROS observations for us. We would also like to thank the ESO staff for successfully executing our UVES observations in Service Mode. Several stimulating discussions with Ferdinando “Nando” Patat are gratefully acknowledged. G.B. acknowledges financial support by INAF2002 under the project “The Large Magellanic Cloud as a laboratory for stellar astrophysics”.References
- (1) Alcock, C., Alves, D.R., Axelrod, T.S., et al 2004, AJ, 127, 334
- (2) Andrievsky, S.M., Kovtyukh, V.V., Luck, R.E. et al 2002, A&A, 381, 32
- (3) Andrievsky, S.M., Bersier, D., Kovtyukh, V.V. et al 2002, A&A, 384, 140
- (4) Baraffe, I., & Alibert, Y. 2001, A&A, 371, 592
- (5) Bono, G., Caputo, F., Castellani, V., & Marconi, M. 1999, ApJ, 512, 711
- (6) Borissova, J., Minniti, D., Rejkuba, M., et al 2004, A&A, 423, 97
- (7) Caldwell, J.A.R., & Laney, C.D. 1991, in The Magellanic Clouds, IAU Symposium, Kluwer Academic Publishers, Dordrecht, p. 249
- (8) Caputo, F., Marconi, M., Musella, I., & Santolamazza, P. 2000, A&A, 359, 1059
- (9) Chiosi, C., Wood, P., Bertelli, G., & Bressan, A. 1992, ApJ, 387, 320
- (10) Ciardullo, R., Feldmeier, J.J., Jacoby, G.H., et al 2002, ApJ, 577, 31
- (11) Cioni, M.-R.L., van der Marel, R.P., Loup, C., & Habing, H.J. 2000, A&A, 359, 601
- (12) Fiorentino, G., Caputo, F., Marconi, M., & Musella, I. 2002, ApJ, 576, 402
- (13) Freedman, W.L., Madore, B.F., Gibson, B.K., et al 2001, ApJ, 553, 47
- (14) Gould, A. 1994, ApJ, 426, 542
- (15) Groenewegen, M.A.T. 2004 , MNRAS, 353, 903
- (16) Groenewegen, M.A.T., Romaniello, M., Primas, F., & Mottini, M. 2004, A&A, 420, 655
- (17) Kaufer, A., D’Odorico, S., & Kaper, L. 2004, UVES User Manual, Issue 1.9, VLT-MAN-ESO-13200-1825
- (18) Kennicutt, R.C., Jr., Stetson, P.B., Saha, A., et al 1998, ApJ, 4918, 181
- (19) Kovtyukh, V.V., & Gorlova, N.I. 2000, A&A, 358, 587
- (20) Kurucz, R.L. 1993, CD-ROMS#1, 13, 18
- (21) Laney, C.D., & Stobie, R.S. 1994, MNRAS, 226, 441
- (22) Laney, C.D., & Stobie, R.S. 1995, MNRAS, 274, 337
- (23) Madore, B.F., & Freedman, W.L. 1991, PASP, 103, 933
- (24) Pritchard, J.D. 2004, FEROS-II User Manual, Issue 1.4, LSO-MAN-ESO-22200-0001
- (25) Romaniello, M., Salaris, M., Cassisi, S., & Panagia, N. 2000, ApJ, 530, 738
- (26) Sakai, S., Ferrarese, L., Kennicutt, R.C., Jr., & Saha, A. 2004, ApJ, 608, 42
- (27) Sandage, A., Bell, R.A., & Tripicco, M.J. 1999, ApJ, 522, 250
- (28) Storm, J., Carney, B.W., Gieren, W.P., Fouqué, P., Latham, D.W., & Fry, A.M. 2004, A&A, 415, 531
- (29) Udalski, A., Wyrzykowski, L., Pietrzynski, G., et al 2001, Acta Astron., 51, 221
- (30) van der Marel, R.P., & Cioni, M.-R.L. 2001, AJ, 122, 1807
- (31) Walker, A.R. 2003, in Stellar candles for the extragalactic distance scale, Lect. Notes Phys., 635, 265
| Name | log(P) | [Fe/H] | |
|---|---|---|---|
| Galaxy | |||
| V Cen | 0.740 | -3.295 | +0.04 |
| KN Cen | 1.532 | -6.328 | +0.17 |
| VW Cen | 1.177 | -4.037 | -0.02 |
| S Nor | 0.989 | -4.101 | +0.02 |
| T Mon | 1.432 | -5.372 | -0.02 |
| U Nor | 1.102 | -4.415 | +0.07 |
| AQ Pup | 1.479 | -5.513 | -0.07 |
| VZ Pup | 1.365 | -5.009 | -0.17 |
| RS Pup | 1.617 | -6.015 | +0.09 |
| RZ Vel | 1.310 | -5.042 | -0.19 |
| l Car | 1.551 | -5.821 | 0.00 |
| beta Dor | 0.993 | -3.920 | -0.14 |
| zeta Gem | 1.007 | -3.897 | -0.19 |
| LMC | |||
| HV 1013 | 1.382 | -5.037 | -0.57 |
| HV 1023 | 1.425 | -4.994 | -0.24 |
| HV 12452 | 0.941 | -3.899 | -0.29 |
| HV 12700 | 0.911 | -3.627 | -0.29 |
| HV 2260 | 1.112 | -4.067 | -0.34 |
| HV 2294 | 1.563 | -6.050 | -0.46 |
| HV 2352 | 1.134 | -4.656 | -0.43 |
| HV 2369 | 1.684 | -6.215 | -0.64 |
| HV 997 | 1.119 | -4.308 | -0.14 |
| HV 6093 | 0.680 | -3.338 | -0.49 |
| HV 2580 | 1.228 | -4.833 | -0.18 |
| HV 2733 | 0.941 | -4.164 | -0.26 |
| SMC | |||
| HV 11211 | 1.330 | -5.296 | -0.67 |
| HV 1365 | 1.094 | -4.147 | -0.67 |
| HV 1954 | 1.223 | -5.325 | -0.67 |
| HV 2064 | 1.527 | -5.440 | -0.55 |
| HV 2195 | 1.621 | -5.874 | -0.61 |
| HV 2209 | 1.355 | -5.519 | -0.56 |
| HV 817 | 1.277 | -5.348 | -0.74 |
| HV 823 | 1.504 | -5.336 | -0.65 |
| HV 824 | 1.818 | -6.669 | -0.71 |
| HV 837 | 1.631 | -5.842 | -0.69 |
| HV 847 | 1.433 | -5.282 | -0.67 |
| HV 865 | 1.523 | -6.015 | -0.79 |