IRTS observations of the near-infrared extragalactic background light
Abstract
We have searched for near-infrared extragalactic background light (EBL) in the data from the Near-InfraRed Spectrometer (NIRS) on the Infrared Telescope in Space (IRTS). After subtracting the contribution of faint stars and the zodiacal component based on modeling, a significant isotropic emission is obtained in the wavelength bands from 1.4 m to 4.0 m. The spectrum is stellar-like, but shows a spectral jump from the optical EBL. The emission obtained is isotropic over the observed sky, and the in-band flux amounts to nWm-2sr-1 which is too bright to be explained by the integrated light from faint galaxies.
Analyses of COBE/DIRBE data, after removal of starlight, show essentially the same result within the uncertainty in the zodiacal light model, which implies that the isotropic emission observed by IRTS/NIRS is of extragalactic origin.
Significant fluctuations in sky brightness were also detected which cannot be explained by fluctuations due to faint stars, zodiacal components and normal galaxies. The excess fluctuation amounts to of the excess emission over the integrated light of galaxies and is consistent with fluctuations observed by COBE/DIRBE. A two-point correlation analysis shows that IRTS/NIRS data has an angular scale of fluctuations of a few degrees.
The spectrum and brightness of the observed excess EBL emission could be explained by the redshifted UV radiation from the first generation of massive stars (Population III stars) that caused the reionization of the Universe. Recent WMAP observations of the CMB polarization have indicated that reionization occurred at or earlier, while the spectral jump around 1 m in the observed excess EBL suggests that the Pop.III star formation terminated at . The observed fluctuations, however, are considerably larger than the theoretical predictions for the Pop.III stars.
1 Introduction
The infrared extragalactic background light (infrared EBL) provides an important clue to our understanding of the early universe and the evolution of galaxies. The near-infrared ( m), and far-infrared/submillimeter (50 m 1 mm) wavelength bands are regarded as useful windows for detecting the EBL since the sky brightness is very low there.
It has been assumed that redshifted starlight from high redshift galaxies constitutes the near infrared EBL, which must be important to understanding the energy generation during the galaxy formation era. The fluctuation of the near infrared EBL is also crucial to understanding the evolution of the large scale structure of the Universe. Much effort has been devoted to the detection of the near infrared EBL from the ground but without success because of bright atmospheric and instrumental emissions. Matsumoto et al. (1988) first attempted a rocket experiment and succeeded in observing the near-infrared sky brightness. Several more rocket experiments were attempted (Noda et al. 1992, Matsuura et al. 1994). However, they had great difficulty in subtracting the foreground emission because of the limited observing time. Recent space observations from the COsmic Background Explorer (COBE) and the InfraRed Telescope in Space (IRTS) have enabled the first quantitative analysis of the infrared EBL ( see the review by Hauser and Dwek 2001, and references therein).
The Diffuse InfraRed Background Explorer (DIRBE) instrument on COBE was designed for observations of the infrared EBL. However, observation of the near infrared EBL with DIRBE was difficult due to the large beam size of that led to serious confusion from unresolved foreground stars. Several authors, however, attempted to subtract the contribution of foreground stars and obtained a significant isotropic emission in the J, K, and L bands that was too bright to be explained by the integrated light of faint galaxies (Dwek & Arendt 1998, Gorjian et al. 2000, Wright & Reese 2000, Wright 2001, Cambrésy et al. 2001). The detection of the fluctuation of near infrared EBL in the COBE star-subtracted data was also reported by Kashlinsky and Odenwald (2000), although not with high significance.
On the other hand, the Near InfraRed Spectrometer (NIRS) on IRTS had the dual advantages of a narrow beam size and spectroscopic capability, even though the sky surveyed was limited (Noda et al. 1996).
In this paper, we present the IRTS observations and the result of data analyses to search for the near infrared EBL in the IRTS/NIRS data (section 2). We then present the residual isotropic emission in wavelength bands from 1.4 m to 4.0 m (sections 3) and also fluctuations of the sky brightness (section 4) that cannot be explained by known sources of foreground emission. We also discuss its cosmological implications based on recent WMAP results and show the future prospects for space observations (section 5). The essential results are similar to those reported in conference proceedings (Matsumoto et al. 2000, Matsumoto 2001).
2 Observation and selection of the data
NIRS is one of the focal plane instruments of IRTS, and was optimized to obtain spectra of the diffuse background (Noda et al. 1994). NIRS covers the wavelength range from 1.4 m to 4.0 m, with a spectral resolution of 0.13 m, in 24 independent bands. The beam size is 8 arcmin square which is considerably smaller than that of DIRBE.
IRTS was one of the mission experiments on the small space platform, SFU, that was launched on March 18, 1995. The orbit was a low-inclination near-earth orbit and IRTS surveyed the sky avoiding the sun and the earth. The IRTS observations lasted for about 30 days, during which 7% of the sky was surveyed (Murakami et al. 1996).
During the entire IRTS mission, NIRS worked as expected. Details of the flight performance of NIRS can be found in Noda et al. (1996), and we concentrate on topics related to the absolute background measurement in this paper.
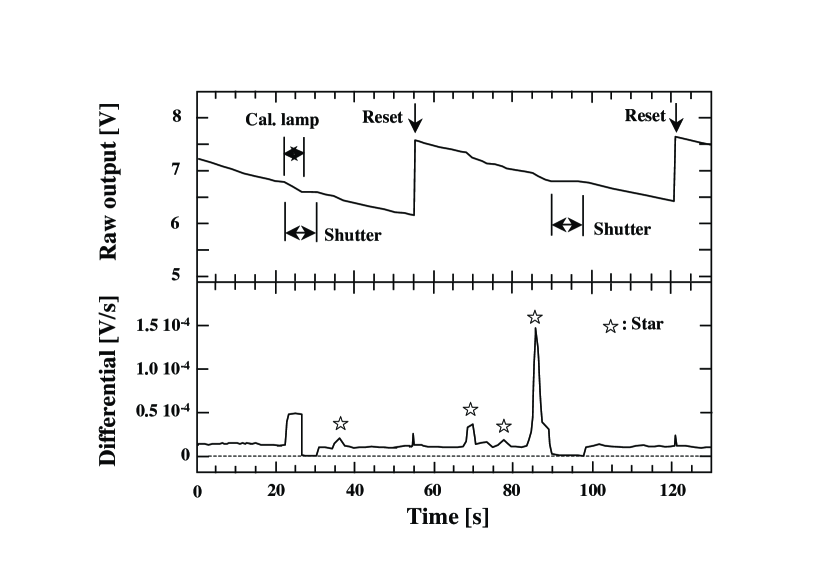
Fig.1 shows a typical output signal of the detector which had an operation cycle of 65.54 sec. Detectors were of the charge-integrating type, and a typical ramp curve is shown in the upper panel of Fig.1. The dark levels were defined as the signals when the cold shutter was closed for 8.192 sec every 65.54 sec. The integrated charges were discharged (reset) every 65.54 sec, the same period but a half cycle shifted from the operation of the cold shutter. The calibration lamp was lit every 17.5 min to monitor detector response. The lower panel of Fig.1 indicates the differentiated signal in which the stars detected are designated by 5-pointed symbols.
An anomalous change of the DC level was seen just after the reset, with an exponential decay with a time constant of sec for all bands. To avoid the influence of this anomaly, the data for 4 sec following the reset were not used in this analysis.
Before the aperture lid opened, no significant signal over the dark levels was detected, which ensures there was no internal emission in the IRTS cryostat. Fig.1, however, clearly shows a significant signal was detected when the shutter was opened in orbit. The detector responsivities derived from the signals of the calibration lamp were stable except for the periods when the SFU passed through the South Atlantic Anomaly (SAA).
No significant change in the signals both from the sky or in dark levels was found between day and night in one orbital revolution. Furthermore, no dependence of detector signals on elevation angle from the Earth’s surface was detected. This implies that the baffling system worked fairly well and the detectors did not suffer from stray light due to radiation from the Sun and Earth.
During the flight, many bright stars were observed, and a small amount of light leakage through the closed shutter was observed in the short wavelength bands. These amounts were measured during flight as a small correlation between the dark levels and the sky brightness, but the correction to the observed signals could be made fairly well. The largest leakage, found at 1.43 m, was but no leakage was detected for wavelength bands longer than 2.0 m.
In the initial phase of observations, NIRS observed the environmental OH emission in the Southern hemisphere, which had a peak at about 2.8 m. This emission exponentially decayed with a time constant of 5 days, and disappeared by the latter half of the IRTS mission. Passages through the SAA and the entry of lunar radiation into the telescope tube also seriously affected the detectors. To avoid these effects, only data from the last 5 days, on orbits that did not pass through the SAA, did not suffer from lunar radiation, and were in the Northern sky, were used for this analysis.
Absolute calibration was satisfactorily achieved with several standard stars observed during the flight (Murakami et al. 2003). The magnitude system for the NIRS bands was constructed so that the observed spectra of the standard stars were consistent with previous observations (Cohen et al. 1999). The beam pattern was also measured by using the passage of bright stars, and the corresponding conversion factors to sky brightness were obtained.
To reduce the contribution from faint stars, the sky at high galactic latitudes () was chosen. The highest galactic latitude was , while the ecliptic latitude ranged from to in the selected data set.
Data were taken within a 5-sec integration during which no distinguishable stars and no cosmic ray hits were detected in any NIRS bands. After subtracting the dark current when the cold shutter was closed, signals from the sky were obtained.
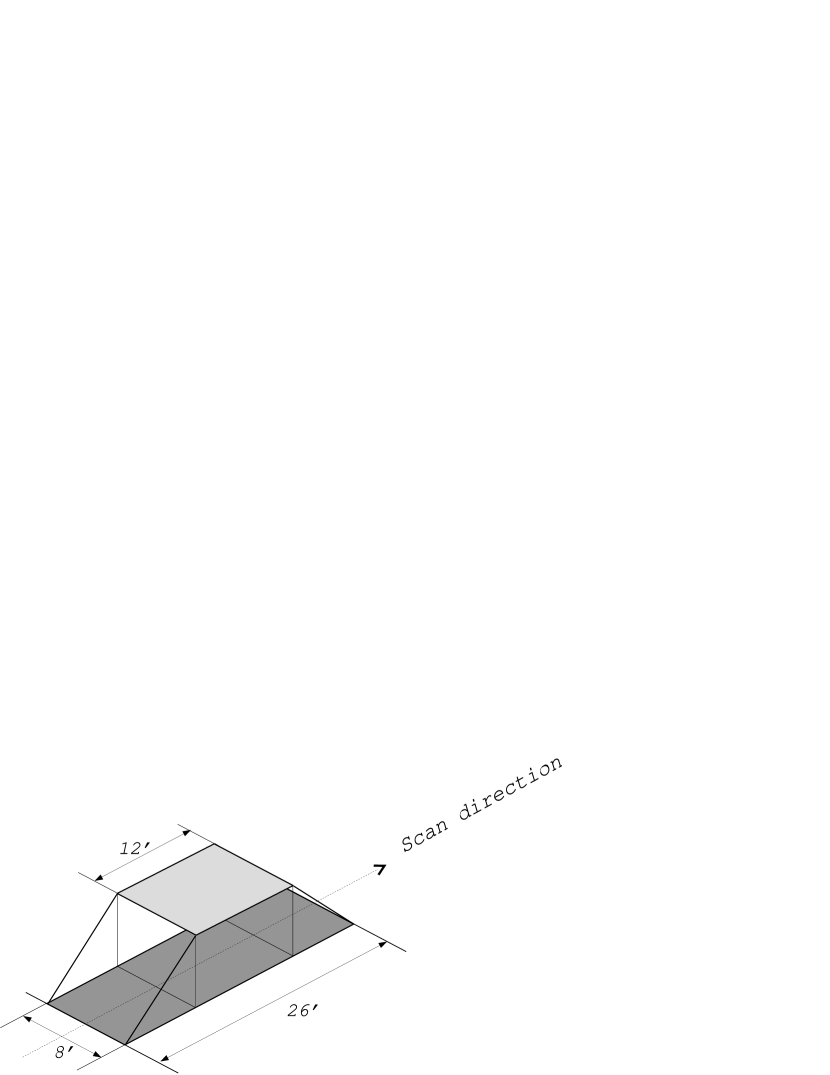
During 5-sec, the telescope axis moves about 20 arcmin along a great circle, which results in a trapezoidal beam pattern as shown in Fig.2. The effective beam size for diffuse extended sources was 8 arcmin 20 arcmin. However, the contribution from point sources depended on their position in the beam.
Celestial coordinates of the data points were determined by use of the focal plane star sensor and other attitude sensors. The error in the attitude determination for the data set was estimated to be about half a beam size ( arcmin).
Finally, complete spectra of the sky were secured at 1010 positions which were free from contamination and cosmic rays.
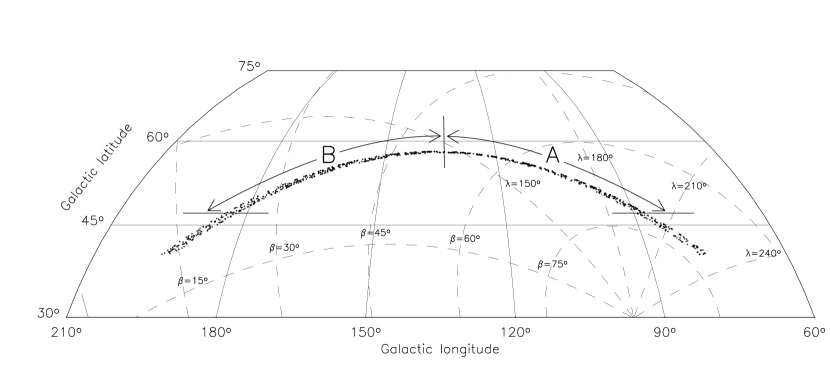
Fig.3 indicates the positions of the spectra acquired in galactic coordinates. Ecliptic coordinates are also shown by dashed lines. The sun lay close to the Spring equinox, and solar elongation angles were during the observations.
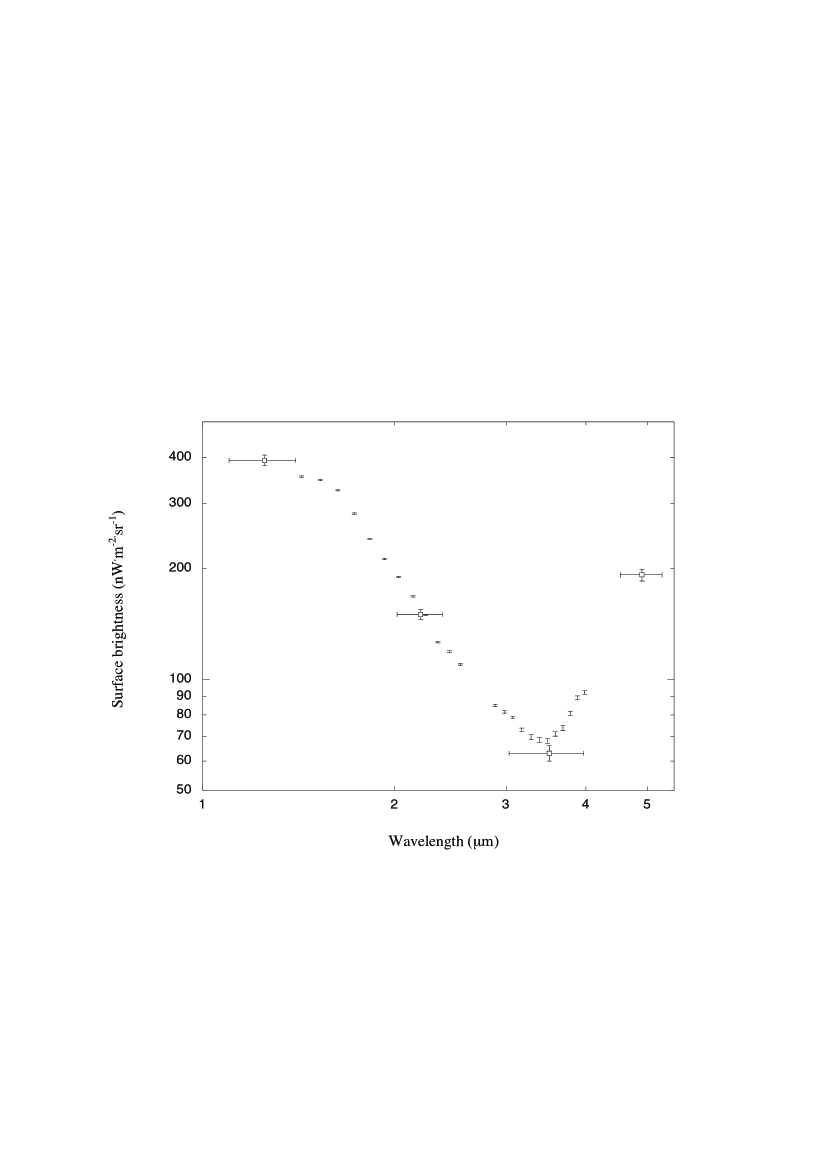
Fig.4 shows our averaged spectrum of the sky at high ecliptic latitude
() in which the data of the DIRBE darkest sky (Hauser et al. 1998)
are also presented. The surface brightness is expressed as
, in units of
nWm-2sr-1 which is used throughout this paper.
Fig.4 implies that
both the NIRS and DIRBE data are fairly consistent despite
the difference in regions observed and beam sizes.
3 Subtraction of foreground emission
3.1 Contribution of faint stars
One of the superior characteristics of NIRS is that fainter stars could be resolved and removed due to the reduction in confusion owing to the smaller beam size than COBE/DIRBE.
The first step toward subtracting the stellar component (star light) is to establish the number density of stars (i.e. the relation). Fortunately, NIRS detected several tens of thousands stars during the IRTS mission, and a complete catalog is open to the public (Yamamura et al. 2003). Although this catalog is rather shallow (completeness limit at 2.24 m is 7.5 mag), we have been able to predict the observed relations (within the Poisson error bars) down to the completeness limits for all 24 NIRS bands by using Version 5 of the “SKY” model for the point source sky of the Galaxy (Cohen 1997). The success of these predictions justifies our extrapolation of the observed NIRS star counts to 30th mag using SKY.
The second step is to determine the contribution of stars that are too faint to be resolved in the NIRS data stream. We first define the cut-off magnitude in a given wavelength band as the flux that corresponds to the noise having the same spatial frequency as the beam pattern. This means that all stars brighter than the cut-off magnitude in any bands are removed from the acquired data. For example, the cut-off magnitude obtained in the 2.24 m band is 10.45 mag. Uncertainties for the cut-off magnitudes are mag in all NIRS bands. It must be noted that the cut-off magnitude is identical for the whole of the trapezoidal beam pattern (8 arcmin 26 arcmin, Fig.2) owing to the procedure for data acquisition.
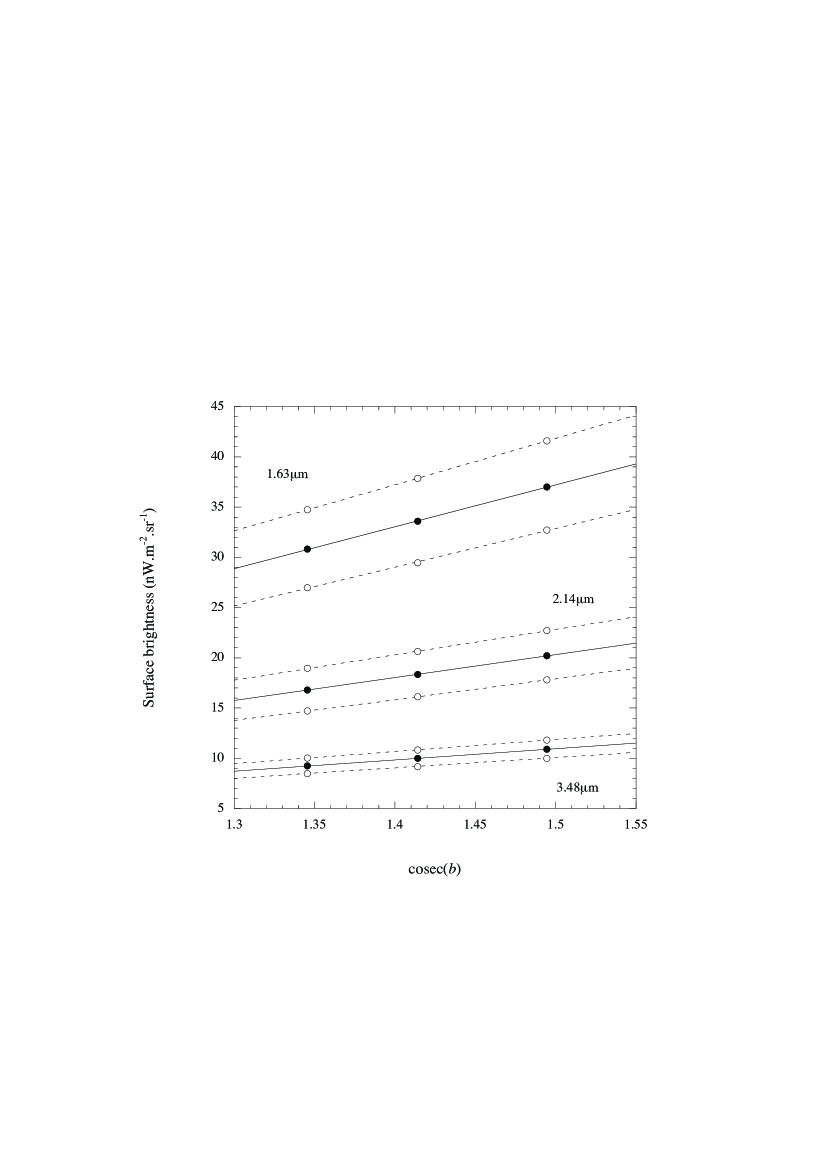
With the relations predicted by the SKY model, and using these cut-off magnitudes, we calculated the total surface brightness due to stars between 30th and the cut-off magnitudes at , , and along the scan path. The calculation was accomplished by a Monte Carlo method applying the relations for the beam pattern shown in Fig.2. In total 100,000 trials were performed for each of the three galactic latitudes, 24 wavelength bands, and three cut-off magnitudes. Fig.5 shows the average surface brightness thus obtained at 1.63, 2.14 and 3.48 m as a function of . Since excellent linearity is found, we have estimated the stellar contribution at any point assuming the law. The dependence on galactic longitude was neglected since stars at high galactic latitudes are mostly of local origin and are not affected by galactic structure. This procedure is justified later by our own data. The contribution from faint stars in the 2.14-m band is about of the observed sky brightness at high ecliptic latitude.
There are two kinds of uncertainty in the contribution of faint stars. The first is that due to the error in the cut-off magnitudes ( mag). This error can be estimated rather easily with the SKY model (see Fig.5) and are taken into consideration in our estimation of the total error.
The second uncertainty is the model itself. Typical uncertainties in SKY’s predicted values of are at the faintest relevant magnitudes (e.g. Minezaki et al. 1998, their Fig.2). However, the diminishing contribution of ever fainter sources to the predicted surface brightness leads to much smaller uncertainties in sky brightness, formally quantified by Cohen (2000) as in a typical application to surface brightness at 3.5 m.
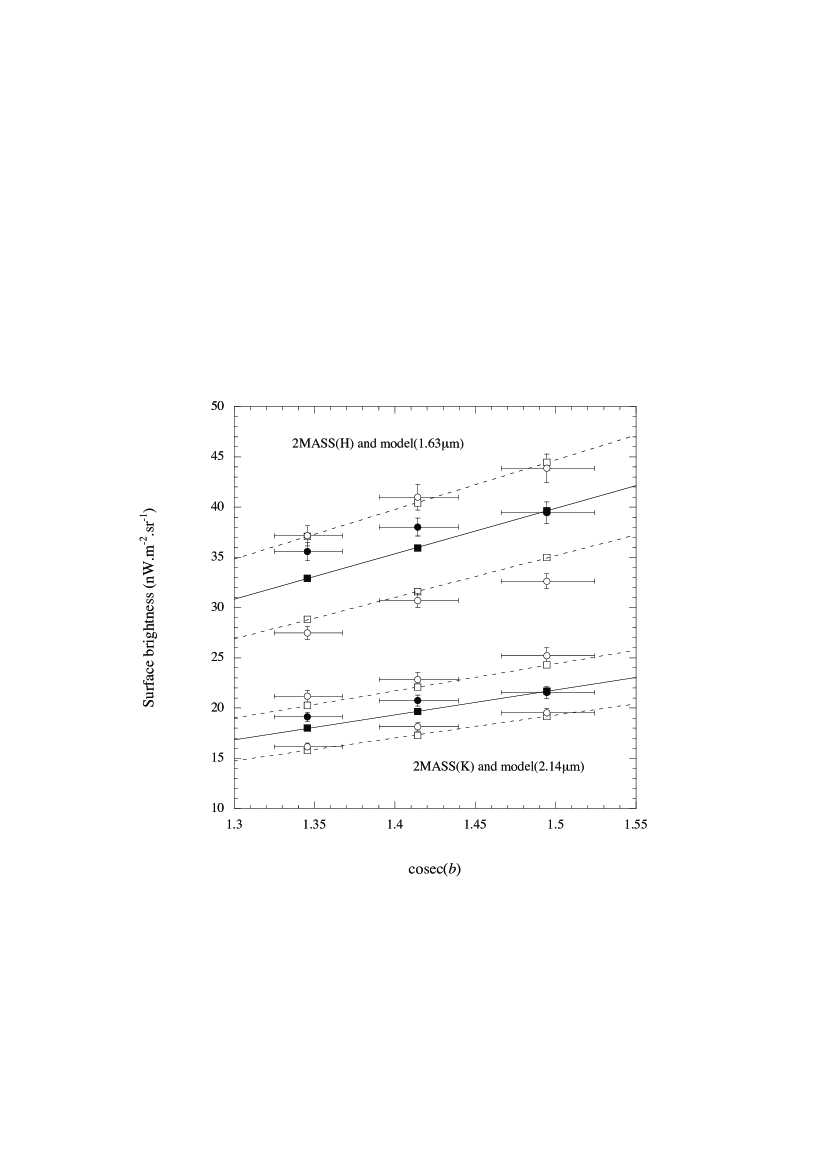
In order to verify the relations directly, we used 2MASS data. The direct subtraction of 2MASS stars from the observed data is unfortunately difficult due to the poor attitude determination. However, the 2MASS catalog is useful enough to validate the SKY model. 2MASS stars fainter than the cut-off magnitudes are picked up by the IRTS data points at , and in the H (1.66 m) and K (2.16 m) bands and converted into surface brightness. In this analysis, a flat top beam (8 arcmin 20 arcmin) was used for simplicity. An estimation using the SKY model was attained analytically for a flat top beam, and it was found that the trapezoidal beam pattern (Fig.2) provides 7 and 12 % less contribution to the surface brightness and to its fluctuation than the flat top beam pattern, respectively. Since the 2MASS catalogue has completeness limits of 15.3 mag for the H band and 14.3 mag for the K band, the contributions of stars fainter than the completeness limits are supplemented by using the model. Their contribution to the surface brightness is about 20 %. In Fig.6, the surface brightness obtained from 2MASS stars is compared with that of the SKY model for the 1.63 and 2.14 m bands (which are very close to the H and K bands of 2MASS catalog), respectively. The results of the 2MASS analysis are fairly consistent with the model and we assigned an error to the model as for all wavelength bands, adopting the worst case in Fig.6.
The integrated light of the faint stars extrapolated by the SKY model was subtracted from the observed sky brightness in each wavelength band. This “star subtracted data” is used for further analysis.
3.2 Subtraction of the zodiacal component
Kelsall et al. (1998) constructed a physical model of the interplanetary dust (IPD) using the seasonal variation of the zodiacal light and thermal re-emission. Based on this model, we calculated the brightness of the zodiacal component corresponding to our wavelength bands and observed points in the sky. The wavelength dependent parameters (phase function parameters, albedos, emissivity modification factors) in the Kelsall model are obtained by interpolation between those of the COBE wavelength bands. The characteristic feature of the resulting NIRS zodiacal model is that there exists excellent linear proportionality between NIRS wavelength bands, although slight deviations are found at the longest wavelengths. In other words, the spectral shape of the zodiacal component is essentially the same for the regions observed by NIRS. This can be understood from the fact that solar elongation angle for the NIRS data points is fairly constant (), and the dust in the smooth cloud makes the dominant contribution to the zodiacal component.
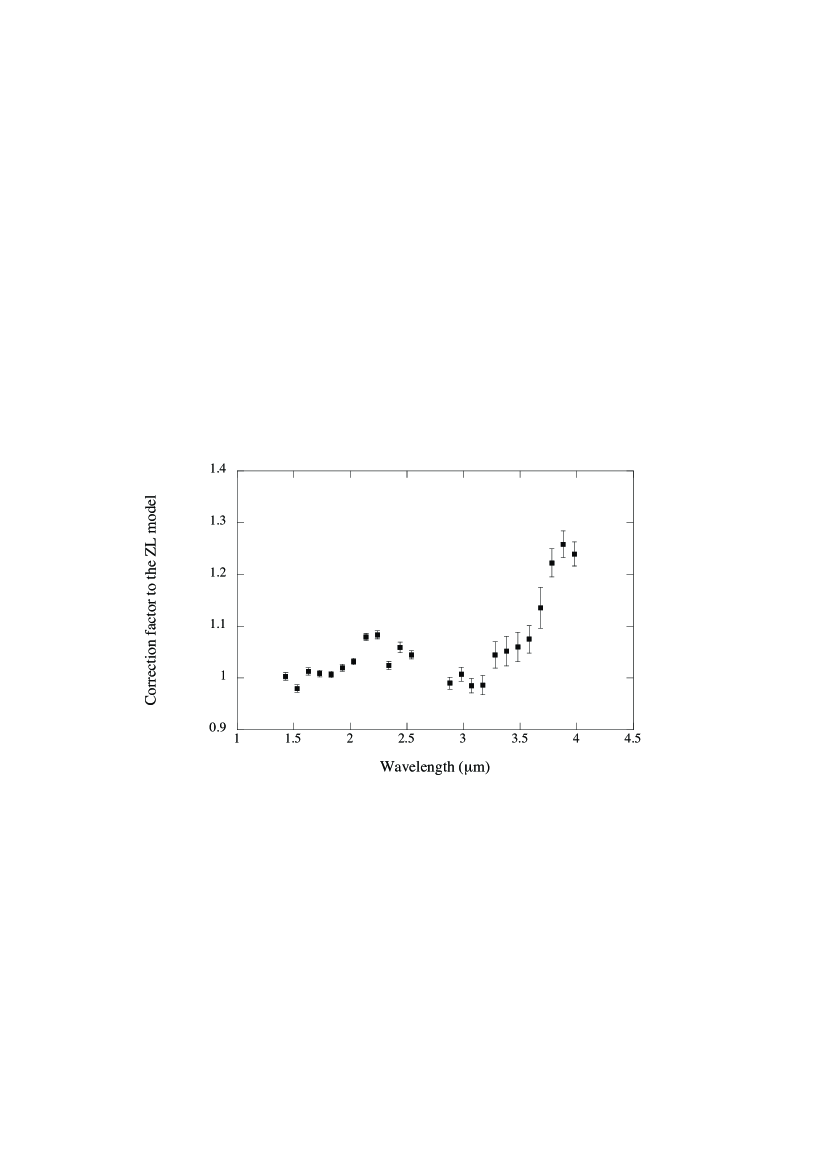
We tried to subtract this modeled brightness from the “star-subtracted-data”. First of all, we undertook a correlation analysis between “star-subtracted-data” and modeled zodiacal components. Fig.7 shows the correlation diagrams at (a) 1.63 m, (b) 2.14 m and (c) 3.48 m, respectively. The correlation is excellent for all bands. As a minor correction to the model, we applied linear fits to the correlation diagrams leaving the slopes as the free parameters. The slopes are indicated in Fig.8 as a function of wavelength in which the longest wavelength bands have a little steeper than 1.0. We regard that these corrections to the slopes as due to differences of calibration between COBE and IRTS, and uncertainty in interpolating the optical parameters in the model. This can be justified by the excellent linear proportionality between NIRS wavelength bands. This procedure can be understood as an iterative process to improve the NIRS zodi model so that the residual emission is as isotropic as possible over the sky observed by IRTS/NIRS. The correction factors for the K and L bands, however, are less than 10 %, which is within the uncertainty of the original IPD model. Furthermore, Fig.7 clearly indicates that residual emission remains where the modeled zodiacal components are zero.
Fig.9 shows the ecliptic latitude dependence of each star-subtracted brightness (pluses) and modeled zodiacal component after correction (solid line) at (a) 1.63, (b) 2.14 and (c) 3.48 m, respectively. The model brightness of the zodiacal component was calculated for all observed positions but the results show no dependence on ecliptic latitude. As a result, the model brightness in Fig.9 appears as a continuous curve.
Fig.9 clearly shows that there remains a fairly isotropic residual emission (crosses) after subtracting the zodiacal components from “star-subtracted-data”. Other wavelength bands show essentially the same pattern.
3.3 Isotropic emission
We first investigate the existence of any galactic component in residual brightness. Fig.10 shows the residual brightness as a function of . From the top, those for 1.63 m, 2.14 m, 3.28 m and 3.48 m are plotted, respectively. The residual brightness shows a fairly isotropic character and no clear dependence on is found in any wavelength band. This ensures that the adopted SKY model is appropriate.
There may be near infrared diffuse emission associated with interstellar matter as was sought in the DIRBE data by Arendt et al. (1998). They found no significant associated emission in the J and K bands, but detected a slight correlation in the L band at low galactic latitude (). Tanaka et al. (1996) detected diffuse emission from the 3.3 m UIR band on the galactic plane with the IRTS/NIRS data. This emission has a clear correlation with far infrared dust emission. However, detection was limited to low galactic latitudes, . This is confirmed by the fact that the residual emission at 3.28 m in Fig.10 shows no clear dependence on galactic latitude. In summary, we conclude that the contribution of diffuse emission associated with interstellar matter is negligible for all wavelength bands, since our data were taken only at high galactic latitudes ().
Fig.9 and Fig.10 clearly demonstrate that there remains a fairly isotropic emission in the IRTS data which has no dependence on either ecliptic or galactic latitude. We derived this isotropic emission as the brightness at which the modeled zodiacal component is zero in Fig.7. The results and errors (1 ) are listed in Table 1. Fitting errors are estimated statistically based on linear fits, while errors in both star subtraction are assessed by taking into account uncertainties in both the cut-off magnitudes and the SKY model. Errors in the IPD model are estimated by interpolating the uncertainties in the original model ( 15, 6, 2.1, and 5.9 nWm-2sr-1 for the J, K, L and M bands, respectively (Kelsall et al. 1998)). Systematic errors include all instrumental uncertainties associated with calibration, light leakage, spectral response, etc. (Noda et al. 1996). The total error is obtained by summing the five kinds of uncertainty in quadrature. Table 1 clearly shows that the major source of uncertainty is that of the IPD model.
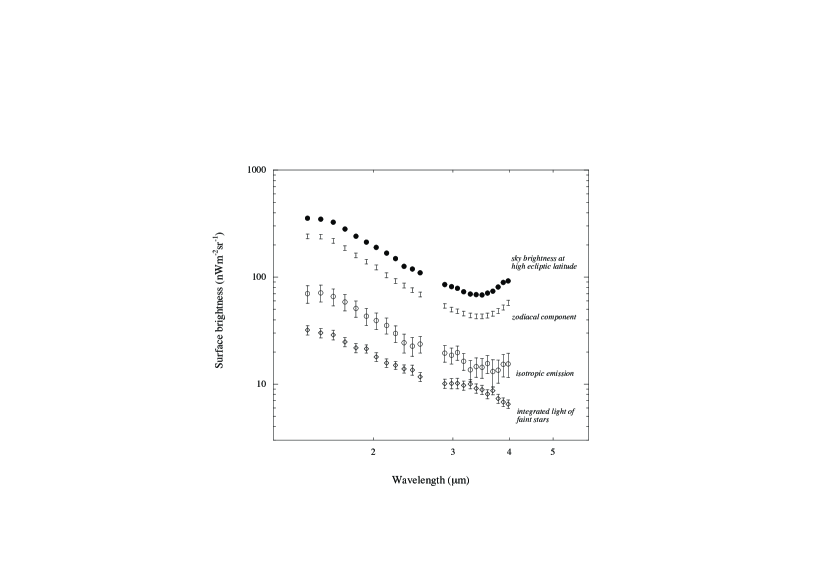
Fig.11 shows the breakdown of sky brightness at high ecliptic latitude (filled circles, as in Fig.4) in which the zodiacal component (bars), the derived isotropic emission (open circles) and the integrated light of faint stars (open diamonds) are indicated. The brightness of the isotropic emission is about of the sky brightness. It must be noted that the sum of the three emission components does not reproduce the sky brightness, because the isotropic emission is derived through statistical analysis.
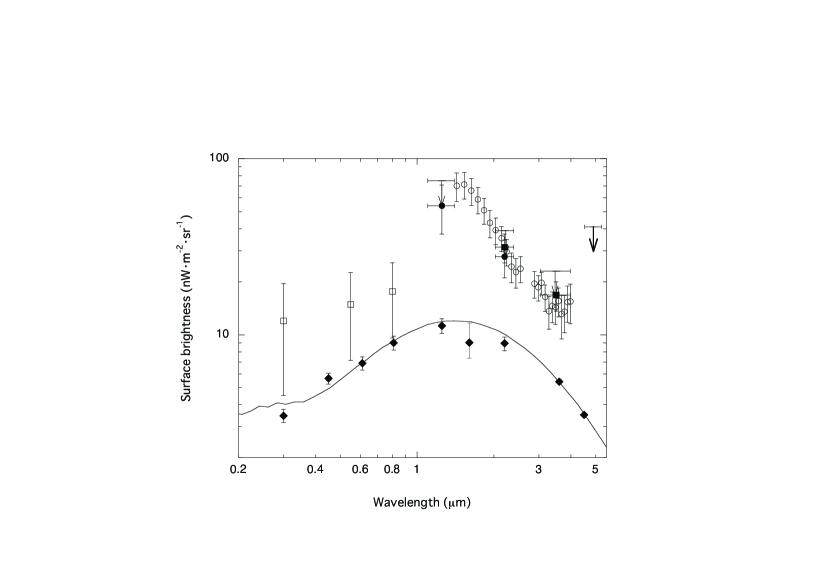
Fig.12 shows our spectrum of the derived isotropic emission in comparison to other observations. The isotropic emission component (open circles) is consistent with the DIRBE upper limits shown by the arrows (Hauser et al. 1998). Open squares show the optical EBL observed by Bernstein et al. (2002). Filled circles and filled squares indicate the results obtained for star-subtracted DIRBE analyses by Cambrésy et al. (2001) and Wright and Reese (2000), respectively. The data by Wright and Reese (2000) have been modified to use Kelsall’s IPD model (see section 5.1). Independent analyses show fairly consistent results, which suggests that the isotropic emission observed by IRTS/NIRS is of extragalactic origin, that is, EBL, although the sky observed by IRTS/NIRS is not extensive. Filled diamonds show the integrated light of galaxies, that is, a simple integration of detected galaxies. The data in the H band are compiled by Madau and Pozzetti (2000), and those in the 3.6 and 4.5 m bands are recent results from the Spitzer Space Telescope (Fazio et al. 2004). Other estimates are by Totani et al. (2001) from the SDF (Subaru Deep Field) for the J and K bands, and from the HDF (Hubble Deep Field) for others.
The solid line represents the theoretical prediction of EBL based on observations of galaxies and using the evolutionary model of Totani & Yoshii (2000), whose predicted spectrum is normalized to nWm-2sr-1 at the top of the error bar at the K band. Based on this model, Totani et al. (2001) claim that more than 90% of the integrated light of galaxies has already been resolved in deep galaxy counts. Fig.12 indicates that the near infrared EBL observed by IRTS and COBE is significantly brighter than the expected integrated light of faint galaxies. The near infrared spectrum lacks any significant feature, but there exists a clear jump from the optical EBL observed by Bernstein et al. (2002). The in-band energy is nWm-2sr-1.
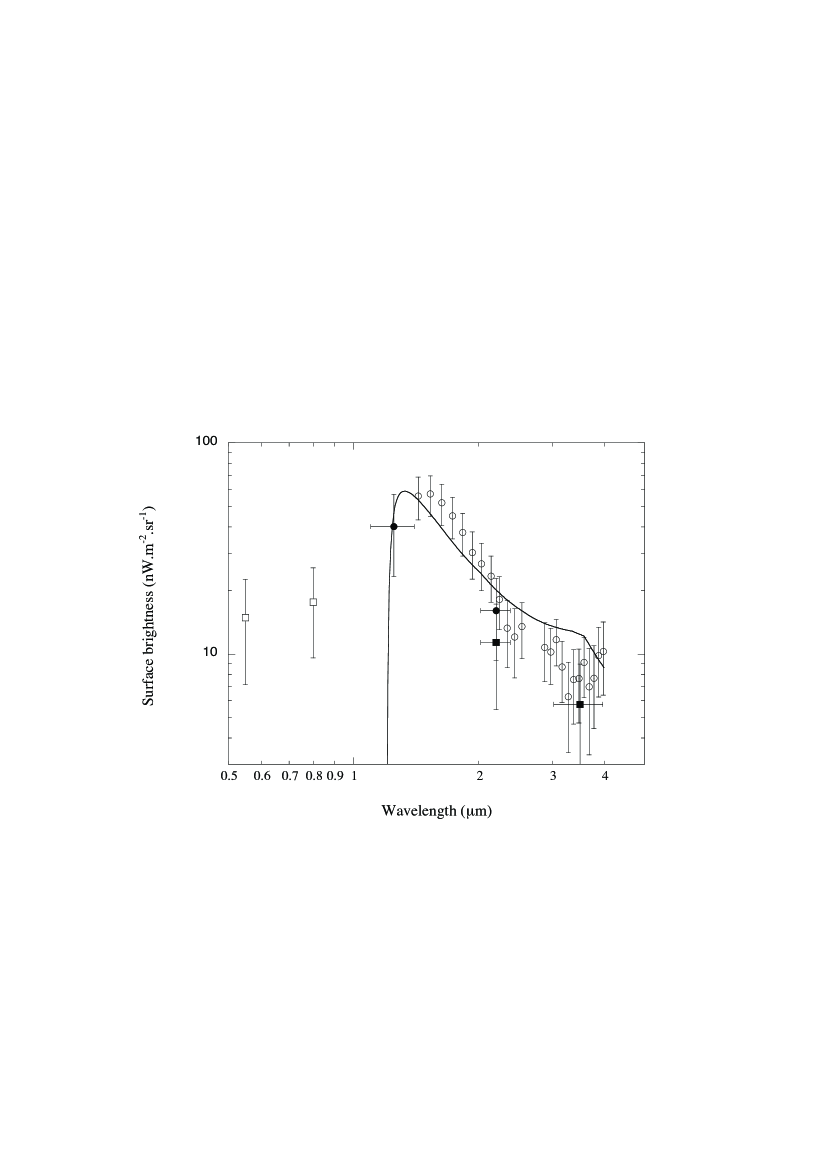
Fig.13 shows excess emission, that is, the brightness obtained by subtracting the integrated light of galaxies (ILG) of Totani et al. (2001) (solid line of Fig.12) from the isotropic emission. Optical data by Bernstein et al. (2002) are plotted without any subtraction since the contribution of galaxies ( mag) has already been subtracted from their data. Fig.13 also indicates an abrupt spectral discontinuity around 1 m. The solid line in Fig.13 is the theoretical model by Salvaterra and Ferrara (2003) which will be discussed in section 5.2.
Evidence supporting this near infrared EBL is found in intergalactic absorption of TeV rays, that is, the inverse process of pair annihilation. Since the near-infrared photons cause an absorption peak around 1 TeV, observation of the TeV Blazer at high redshift is crucial to confirm the cosmological origin of the EBL observed by IRTS and COBE (Stecker et al. 1993, Tanihata et al. 2001). Recent observations of the BL Lac object H1426+428 at with Whipple, CAT and HEGRA show a clear absorption feature at TeV (see papers in New Astronomy Review vol.48, issue 5-6). This spectrum cannot be well explained by the integrated light of normal galaxies, and requires an excess near infrared background which has a peak around 1 m (Aharonian et al. 2002, Mapelli et al. 2004). There remains uncertainty in the source spectrum of the gamma rays. However, the spectrum of the TeV Blazer strongly supports an extragalactic origin for the isotropic emission observed by IRTS/NIRS.
4 Fluctuation analysis
Fluctuations in the EBL are another important way to investigate the formation and evolution of galaxies and large scale structure. The effective beam size of 8 arcmin 20 arcmin is an adequate scale to investigate the clustering of galaxies at high redshift (Kashlinsky and Odenwald 2000).
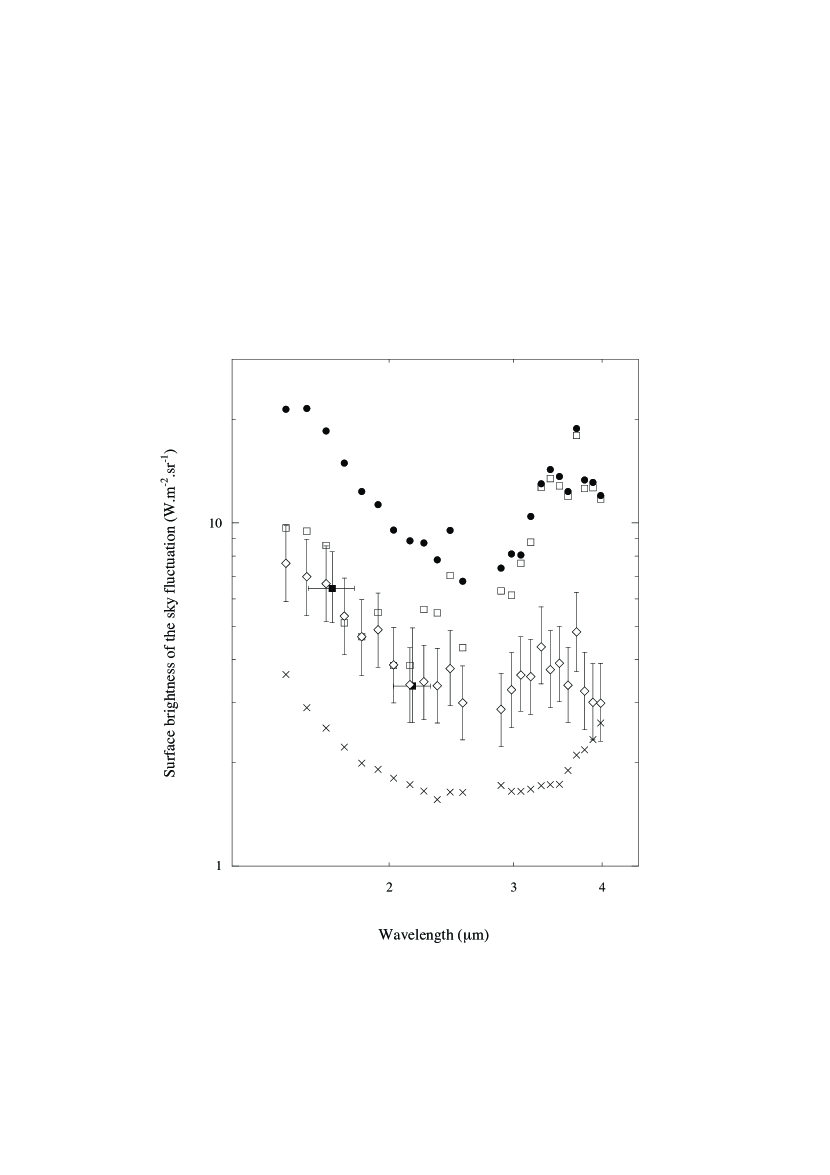
For a fluctuation analysis of the NIRS data, we selected 797 data points with to reduce the effect of fluctuations due to faint stars. Filled circles in Fig.14 show the standard deviations for these data points and these are compared with other possible sources of fluctuation.
Fluctuations due to faint stars are estimated by a Monte Carlo simulation for the SKY model at which is simultaneously made when the integrated light of faint stars is estimated in section 3.1. 100,000 trials for each wavelength band and each cut-off magnitude are made, and standard deviations are obtained. The result is indicated by open diamonds in Fig.14 for which errors due to cut-off magnitudes ( mag) are plotted. It must be noted that the contribution of faint stars is overestimated since the galactic latitudes of the NIRS data used ranges from to .
To validate the model fluctuations, we again used 2MASS stars. We picked up all stars between the cut-off magnitudes and completeness limits in the 2MASS catalog for the H and K bands. Their contribution to the surface brightness for the 797 NIRS data points was obtained. Since the 2MASS surface brightness has a dependence on galactic latitude, we made a linear fit with and obtained the fluctuating component by the fitting line. Furthermore, a correction factor of 0.88 for the flat top beam, 8 arcmin 20 arcmin, was applied (see section 3.1). The contribution of stars fainter than the completeness limits is neglected since the model indicates that their contribution is negligible. The standard deviations for this constructed “2MASS fluctuation data” are shown by filled squares in Fig.14, and are reasonably consistent with the model estimation.
The read-out noise in each NIRS band was determined from the noise signals when the shutter was closed. These are shown by open squares. The photon noise due to the incident radiation is shown by crosses. The photon noise is also overestimated, since the calculation is made assuming observations towards the ecliptic plane (Noda et al. 1996).
Fig.14 clearly shows that there remains a significant excess fluctuation at short wavelengths, although read-out noise dominates at longer wavelengths. The excess fluctuation is obtained by subtracting the known fluctuation in quadrature, and is shown in Fig.15 by filled circles. The results of the fluctuation analysis of the DIRBE data by Kashlinsky and Odenwald (2000) are also shown, as filled squares. Although their error bars are fairly large, good agreement is found with our data.
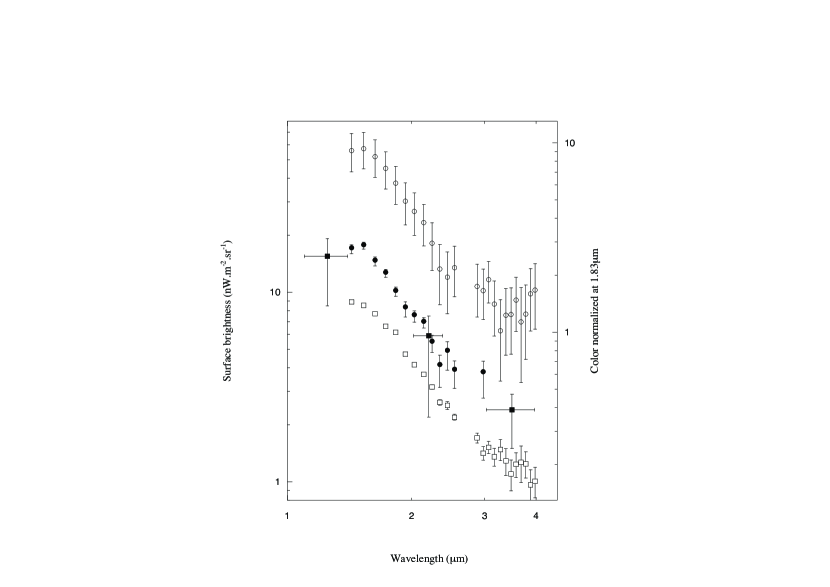
Another important feature of the observed fluctuations is the excellent correlation between wavelength bands. Fig.16 shows the correlation diagram for the residual brightness at a) 1.63, b) 2.14 and c) 3.48 m data to that at 1.83 m, respectively. This correlation is caused by the spatial distribution of the sky brightness and is independent of random noise (readout noise and photon noise). The slopes of the linear fits for these correlation diagrams indicate the colors of the spatially fluctuating components. Open squares in Fig.15 show the spectrum obtained from these colors in arbitrary units. The fact that these colors are consistent with the spectrum of the excess fluctuation implies that the observed fluctuations mainly originate from the spatial distribution of the EBL, although a minor contribution from stellar fluctuations remains.
Open circles in Fig.15 indicate the spectrum of the excess emission (as in Fig.13) which is very similar to that of the excess fluctuations shown by filled circles. The fluctuation level amounts to of the excess emission. Fig.15 implies that the observed excess fluctuations have the same origin as the excess emission; i.e., the excess emission fluctuates but maintains the same spectral shape.
Zodiacal light cannot explain such a fluctuation spectrum. Indeed, fluctuations of zodiacal emission have not yet been detected in the mid-infrared region and are less than 1 % for various beam sizes (IRAS: Vrtilek and Hauser 1995, COBE: Kelsall et al. 1998, ISO: Abraham at al. 1998). The upper limits thus obtained are much smaller than the observed fluctuating component, that is, of the isotropic emission and of the total sky brightness. It is unlikely that the scattering component has a much larger fluctuation than that of the thermal emission, so it is difficult to attribute the excess fluctuations to any zodiacal component. The fact that the fluctuations of the residual emission in Fig.9 have no dependence on ecliptic latitude is further evidence that the observed fluctuations are not interplanetary in origin.
It is implausible to attribute the observed fluctuations to those of normal galaxies. Fig.12 indicates that the integrated light of galaxies is nWm-2sr-1 at 1.4 m which is lower than the observed fluctuation itself. The expected fluctuation due to normal galaxies is roughly one order of magnitude lower than the IRTS data (Cooray et al. 2004).
The angular distribution of the fluctuations is crucial to investigate large scale structure at high redshift. It is obvious that the typical angular scale is larger than the COBE/DIRBE beam, . In order to investigate the angular scale of the fluctuations qualitatively, we tried a two-point correlation analysis for the residual emission at that was the same as used for the rms fluctuation analysis. To secure a definite result, we defined a “wide band brightness” by integrating the brightness of the NIRS short wavelength bands from 1.43 m to 2.14 m. The central wavelength is 1.7 m, which roughly corresponds to the H band. For the “wide band brightness”, read out noise and photon noise are suppressed, while fluctuations associated with the sky brightness must be summed, since the sky fluctuates keeping the same spectral shape (Fig.15). The standard deviation of the “wide band brightness” is nWm-2sr-1 which is much larger than the estimated readout noise of nWm-2sr-1. This shows that the fluctuation of “wide band brightness” can solely be attributed to a celestial origin.
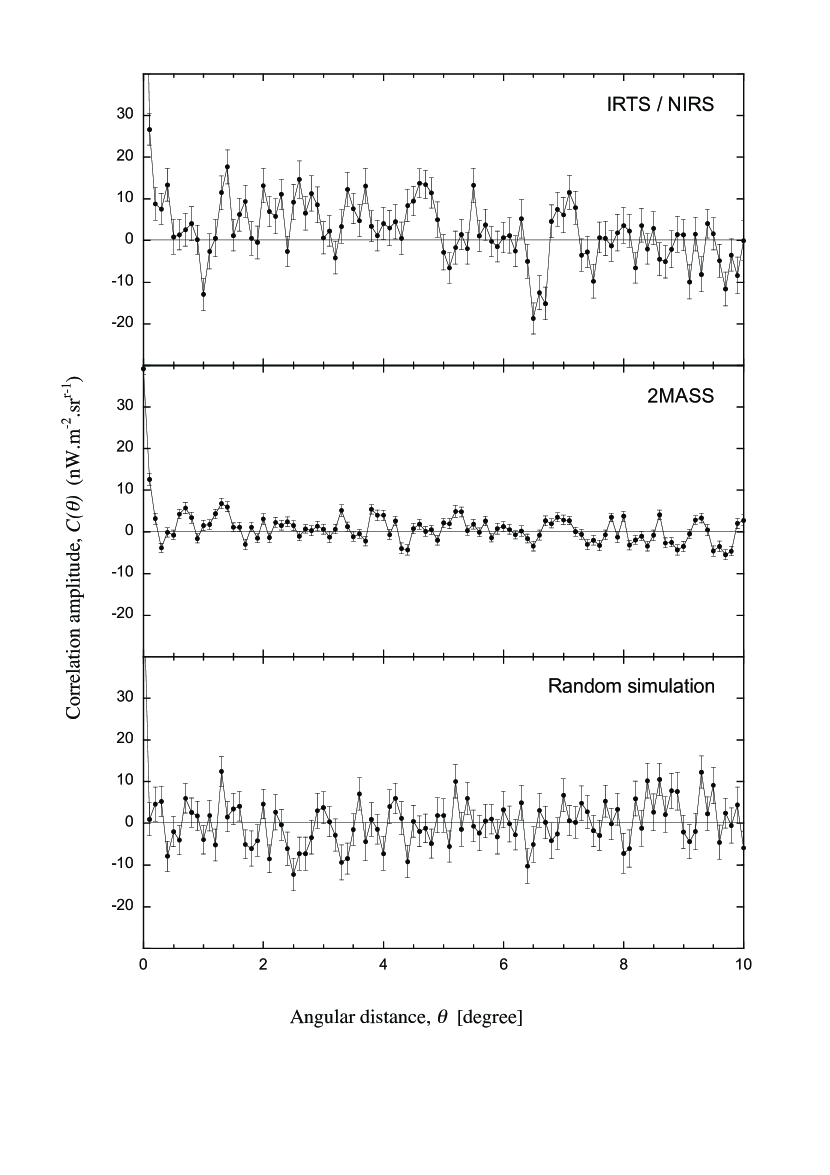
We applied a two-point correlation analysis to the data set after simply subtracting the average value from “wide band brightness”. The two-point correlation function is defined as , where is a fluctuating component, is the angular distance in degrees between two points, and represents the location of an observed point. Since data points are aligned along a great circle (Fig.3) and the beam pattern is elongated along a scan path, we pursued a one-dimensional analysis as a function of .
The top panel of Fig.17 shows our two-point correlation function on a linear scale, in which data are binned and averaged for an interval. Error bars are based on the scatter of , and do not include systematic errors. A semi-periodic component with a scale of a few degrees is found. To confirm this feature and examine the contribution of faint stars, we made a similar analysis for the H band in the “2MASS fluctuation data” (middle panel). The result shows a quite different character from IRTS/NIRS data. The amplitude of the correlation is fairly small and no clear spatial structure is found. This implies that the spacial fluctuation of the IRTS/NIRS data is not stellar in origin. To seek any selection effect among the data points, a two-point correlation was also applied on a random data set at the same spacial positions but with the same standard deviation as “wide band brightness”. The result (bottom panel of Fig.17) looks like simple noise and shows no specific spatial structure, as expected.
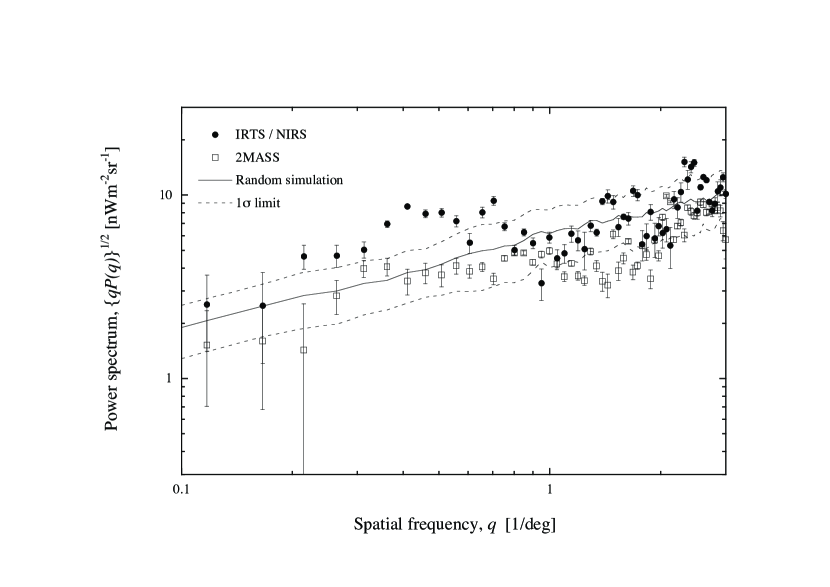
In order to extract the angular scale of the fluctuations, we converted the two-point correlation function to a power spectrum, , where is wavenumber in units of degree-1. We adopted a one-dimensional Fourier transformation of . The result is shown in Fig.18 (filled circles) where is plotted as a function of . The range of the spatial frequency, , is restricted to between 0.1 and 3, considering the effective beam size (8 arcmin 20 arcmin) and uncertainty in subtracting zodiacal light at large angular scales. A clear hump at is found. The power spectrum for the “2MASS fluctuation data” is also shown by open squares in Fig.18. A corresponding feature at is not found. 100 random simulations were made, and the average values and standard deviations (1 error) are indicated by solid and dashed lines, respectively. Fig.18 indicates that there exists statistically significant spatial fluctuation on an angular scale of in the IRTS/NIRS data.
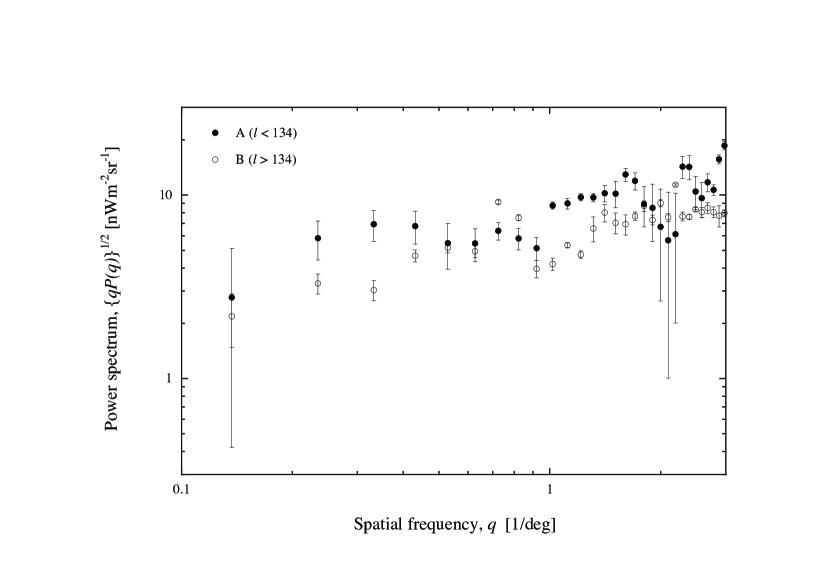
To confirm the characteristic angular scale of , we divided the observed area into two regions, A () and B (), and tried to detect a similar feature in these subsets. These two regions are indicated in Fig.3. The result shown in Fig.19 is not so clear, and power spectra of the two regions appear fairly different. Region A has a higher angular power at low spatial frequency than region B. This result indicates that the fluctuation has a broad power spectrum over a few-degree scale which has a distinct dependence on the sky area observed. To obtain any definite and decisive result, two-dimensional analysis for a wide area is needed.
5 Discussion
5.1 Comparison with previous studies
We first review the results of EBL analysis using the COBE/DIRBE data.
Dwek and Arendt (1998) made a correlation study between the bands, and obtained a clear correlation between the K and L band, nWm-2sr-1. By adopting a value for the integrated light of galaxies at K, , they reported the detection of EBL in the L band. Their result was offered as tentative although their was fairly consistent with our own values near 3.5 m (see Table 1).
The most serious obstacle to analysis of the COBE/DIRBE data is that unresolved faint stars provide significant contributions to sky brightness due to the large beam size. Wright and Reese (2000) found isotropic emission in the K and L bands by comparing the model Galaxy with the galactic distribution of the DIRBE Zodi-Subtracted data set. Gorjian et al. (2000) observed deep star counts towards the COBE dark spot and subtracted the stellar contribution from the DIRBE Zodi-Subtracted data, detecting significant isotropic emission in the K and L bands. Recently, 2MASS data have also been used to remove the stellar contribution from the DIRBE data (Wright 2001, Cambrésy et al. 2001), which has also yielded results consistent with previous work.
Table 2 summarizes all these results. The isotropic emission found by Wright and Reese (2000), Gorjian et al. (2000), and Wright (2001) are somewhat lower than other values. This is attributable to the difference in the IPD models used. Parenthesized values show the derived brightness when Kelsall’s IPD model is adopted. Table 2 indicates that all these observations are consistent when corrected using a common IPD model, and demonstrates the significant uncertainty arising from the choice of IPD model. We deduce that the near-infrared EBL is significantly brighter than the observed integrated light of galaxies, even allowing for all error estimates.
5.2 Origin of excess emission and fluctuation
The isotropic emission detected by IRTS/NIRS is consistent with that detected by COBE/DIRBE and is attributed to an extragalactic origin. Furthermore, the detected emission is too bright to be explained by the integrated light of normal galaxies and requires events in the early Universe.
Recent observations of CMB polarization by WMAP (Kogut et al. 2003) first determined that the reionization of the Universe took place earlier than previously thought, back to or earlier. The most probable candidates for causing the reionization are UV photons from the first generation stars, that is, Pop.III stars. Star formation and spectral features of Pop.III stars have been investigated by many authors (cf. Bromm et al. 2001), and it is believed that massive stars are formed without metals.
Salvaterra and Ferrara (2003) tried to fit the spectrum of the excess EBL emission with the integrated light of Pop.III stars (the solid line of Fig.13). They assumed that star formation of Pop.III stars terminated at to explain the spectral jump around 1 m. Due to the ionized gas around stars, UV photons are reprocessed to Lyman photons which form the peak of the excess emission around 1 m in Fig.13. Furthermore, they assumed a top heavy IMF so that supernovae do not contaminate the interstellar matter with metals. Stars responsible for the excess EBL must be heavier than 260 solar masses whose final stage is a black hole.
The most important aspect of this paper is the significant detection of fluctuations in the near infrared sky. The observed fluctuations are fairly large ( of the excess emission), but are consistent with the result for the COBE/DIRBE data (Kashlinsky & Odenwald 2000). Furthermore, the two-point correlation analysis indicates that these fluctuations have an angular scale of a few degrees which could be related to large scale structure. It must be noted that the first peak of CMB fluctuation observed by WMAP corresponds to at the redshift of 8.8, which is very close to the angular scale observed by IRTS/NIRS. The physical scales corresponding to are and for and the present Universe, respectively.
An important feature of the fluctuations detected by IRTS is that the spectrum of fluctuations is very similar to that of the excess EBL. This could be readily understood within the model of Salvaterra and Ferrara (2003), since the dominant contribution to the excess EBL is due to the nearest Pop.III stars at the terminating era.
The amplitude and angular scale of fluctuations, however, are not so simply understood. Cooray et al. (2004) estimated the fluctuations assuming that density of Pop.III stars traces that of dark matter. Their result shows a broad peak at which is much smaller than the observed angular scale of a few degrees. The estimated amplitudes of fluctuations (zero-lag correlation) are about one order of magnitude lower than the observed ones even for the optimistic case.
Kashlinsky et al. (2004) made a similar analysis taking the nonlinear effect of Pop.III star formation into account. Their result, however, still has difficulty in explaining the large amplitudes and angular scale of the observed fluctuations.
In order to understand the observed fluctuations, more observational data are needed. In this analysis, sampling of the data points is not perfect and a one-dimensional analysis was applied for simplicity. Future observations with wider sky coverage and higher sensitivity will make two-dimensional analysis possible, as WMAP did. Furthermore, two-point correlation analysis at different wavelengths will be crucial to investigate the origin of the observed fluctuations.
5.3 Connection with far infrared and submillimeter background
In the far infrared and submillimeter region, detections of the EBL are also reported based on the COBE/DIRBE data (Hauser et al. 1998, Lagache et al. 2000, Finkbeiner et al. 2000, Matsuhara et al. 2000) and COBE/FIRAS data (Puget et al. 1996, Fixsen et al. 1998). These EBLs should be compared with the integrated light from point sources.
At submillimeter wavelengths, deep surveys using lensing effects with the SCUBA instrument on the JCMT measurements have shown that SCUBA sources at 850 m can explain most of the submillimeter background (Blain et al 1999). Counterparts to SCUBA sources are thought to be ultraluminous galaxies with a median redshift (Smail et al. 2002, Chapman et al. 2004).
In the far-infrared region, ISO surveys had been the sole available deep observations. The detection limits of the ISO surveys, however, were not deep enough to estimate the contribution of point sources to the EBL (Matsuhara et al. 2000). Recent MIPS/SST observations, however, provided a several times deeper survey than ISO (Dole et al. 2004), but could resolve only 23 % and 7 % of the cosmic far-infrared background at 70 m and 160 m, respectively. Much deeper surveys with advanced space telescopes such as Herschel Space Telescope (Pilbratt 2004), SPICA (Matsumoto 2004), etc. are required to understand the origin of far-infrared EBL.
In any case, the origin of the excess emission in the far-infrared region must be thermal emission from the dust. Since Pop.III stars are formed from Hydrogen and Helium atoms without metals, the far-infrared EBL must originate in a period later than the Pop.III era. The far infrared EBL could be a key to understanding the star formation history after the Pop.III era.
5.4 Future observations
The near infrared background is a unique observational tool to investigate the Pop.III era. From the observational point of view, there are three important aspects that are expected of future observations. The first is to confirm the spectral jump around 1 m. This is important to investigate the termination era of Pop.III star formation. The second is to measure the fluctuations at the different angular scales and wavelengths. This will provide valuable information to understand the evolution of Pop.III stars and large scale structure. The third is absolute measurement, free from the uncertainty in IPD model.
It is not so easy to achieve these three criteria, since space observations are absolutely necessary. The Japanese ASTRO-F mission that will be launched in 2005 will be a powerful tool in near infrared background observations (Murakami 2004). Its Infrared Camera (IRC) will provide images of 10 arcmin over pixel scales of 1.5 arcsec for the K and L bands. A large area survey towards the north ecliptic pole is being planned (Pearson et al. 2004) and the observation of fluctuations from a few arcsec to several degrees will be attained with excellent quality (Cooray et al. 2004). Low resolution spectroscopy at wavelengths longer than 1.8 m will also provide additional spectral information.
The shortest wavelength of the IRC is 2 m, and no satellite mission is scheduled to observe the background emission around 1 m. Owing to the progress of detector arrays, even sounding rocket experiments with short observing times can provide data of high quality. The rocket experiment, CIBER (Cosmic Infrared Background ExpeRiment) has been approved by NASA. CIBER is a US-Japan-Korea joint mission (PI: J. Bock of JPL), and has two objectives. One is to measure the spectrum of the sky around 1 m, and another is to measure fluctuations of sky at the I and H bands with a wide field camera. CIBER is a complementary experiment to the ASTRO-F mission that can be realized in a relatively short period at low cost.
Absolute measurement is the most difficult aspect. Since it is difficult to improve the IPD model, the best technique will be to measure sky brightness outside the zodiacal cloud. ISAS/JAXA is now examining a solar sail mission to Jupiter. The near infrared instrument for the measurement of background radiation is proposed as one of the onboard instruments (Matsuura et al. 2004). At the orbit of Jupiter, the surface brightness of the zodiacal light towards the ecliptic pole is estimated to be of that at the Earth’s orbit, and of the observed near infrared EBL. A solar sail mission towards Jupiter will definitely render accurate absolute brightness and fluctuation measurements of the near infrared EBL.
6 Conclusion
The IRTS/NIRS has provided high quality data with which to seek the near infrared extragalactic background light (EBL) with an 8 arcmin 20 arcmin beam, across a wavelength range from 1.4 m to 4.0 m, with spectral resolution of 0.13 m. The contribution of the foreground emission (zodiacal component and integrated light of faint stars) was subtracted by modeling, and significant isotropic emission was detected that we attribute to an extragalactic origin. Its spectrum is star-like but shows a spectral discontinuity with the optical EBL.
The observed isotropic emission is significantly brighter than that of the integrated light of faint galaxies. Our results are consistent with the results of independent analyses of star-subtracted DIRBE data, although significant uncertainty stems from the use of different IPD models.
The spectrum and brightness of the observed excess EBL emission could be explained by the redshifted UV radiation from the first stars (Pop.III stars) that caused the reionization of the Universe. WMAP observations of the CMB polarization has indicated that reionization occurred at or earlier, while the spectral jump around 1 m of observed excess EBL suggests that the Pop.III star formation terminated at .
Excess fluctuations of the sky brightness were detected at a level of the excess emission. A two-point correlation analysis indicates that the excess fluctuations have an angular scale of a few degrees. The observed fluctuations, however, are considerably larger than the theoretical predictions for the Pop.III stars.
7 ACKNOWLEDGMENTS
The authors thank IRTS members for their encouragement, and Dr. Totani and Prof. Takahashi for inspiring discussions. Thanks are also due to Drs. Ferrara and Salvaterra for their courtesy in using their theoretical model. We are also grateful to Ms. Kimura for her support in acquiring the 2MASS data.
MC thanks NASA for supporting his participation in IRTS/NIRS work through Co-operative Agreement NCC2-1125 between Berkeley and NASA-Ames Research Center.
This publication makes use of data products from the Two Micron All Sky Survey, which is a joint project of the University of Massachusetts and the Infrared Processing and Analysis Center/California Institute of Technology, funded by the National Aeronautics and Space Administration and the National Science Foundation.
References
- Abraham et al. (1998) Abraham, P. et al 1998, In The Universe as seen by ISO, ed. P. Cox, & M. Kessler, ESA SP-427, 145
- Aharonian et al. (2002) Aharonian, F. et al. 2002, A&A, 384, L23 seen by ISO, ed. P. Cox, & M. Kessler, ESA SP-427, 145
- Arendt et al. (1998) Arendt, R.G. et al. 1998, ApJ, 508, 74
- Bernstein et al. (2002) Bernstein, R. A., Freedman, W. L. & Madore, B.F. 2002, ApJ, 571, 56
- Blain et al. (1999) Blain, A. W., Kneib, J. -P, Ivison, R. J. & Smail, I. 1999, ApJ, 512, L87
- Bromm et al. (2001) Bromm, V., Kudritzki, R. P. & Loeb, A. 2001, ApJ, 552, 464
- Cambrésy et al. (2001) Cambrésy, L., Reach, W. T., Beichman, V.A. & Jarrett, T.H. 2001, ApJ, 555, 563
- Chapman et al. (2004) Chapman, S. C., Smail, I., Windhurst, R. Muxlow, T. & Ivison, R. J. 2004, ApJ, 664, 732
- Cohen (1997) Cohen, M. 1997, ASP Conf. Series, 124, Diffuse Infrared Radiation and the IRTS eds. H. Okuda, T. Matsumoto & T. Roellig, 61
- Cohen (1999) Cohen, M., Walker, R.G., Carter, B., Hammersley, P. L., Kidger, M. R. & Noguchi, K. 1999, AJ, 117, 1864
- Cohen (2000) Cohen, M. 2000, In ASP Conf. Ser., 204, The Extragalactic Infrared Background and its Cosmological Implications, eds. Martin Harwit, & Michael G. Hauser, 234
- Cooray et al. (2004) Cooray, A., Bock, J., Keating, B., Lange, A. E. & Matsumoto, T. 2004, ApJ, 606, 611
- Dwek et al. (1998) Dwek, E. & Arendt, R.G. 1998, ApJ, 508, L9
- Dole et al. (2004) Dole et al. 2004, ApJS, 154, 87
- Fazio et al. (2004) Fazio G. et al. 2004, ApJS, 154, 39
- Finkbeiner et al. (2000) Finkbeiner, D. P., Davis, M. & Schlegel, D. J. 2000, ApJ, 544, 81
- Fixsen et al. (1998) Fixsen, D. J., Dwek, E., Mather, J. C., Bennett, C. L. & Shafer, R.A. 1998, ApJ. 508, 123
- Gorjian et al. (2000) Gorjian, V., Wright, E.L. & Charry, R. R. 2000, ApJ, 536, 550
- Hauser (1995) Hauser, M. G. 1995, in AIP Conf. Proc., 348, Unveiling the cosmic infrared background, ed. Eli Dwek (New York: AIP), 11
- Hauser et al. (1998) Hauser, M. G. et al. 1998, ApJ, 508, 25
- Hauser and Dwek (2001) Hauser, M. G. & Dwek, E. 2001, Ann. Rev. Astrophysics, 39, 249
- Kashlinsky and Odenwald (2000) Kashlinsky, A. & Odenwald, S. 2000, ApJ, 528, 74
- Kashlinsky et al. (2004) Kashlinsky, A., Arendt, R., Gardner, J. Mather, J. & Moseley, H. 2004, ApJ, 608, 1
- Kesall et al. (1998) Kelsall, T. et al. 1998, ApJ, 508, 44
- Kogut et al. (2003) Kogut, A. et al. 2003, ApJSuppl,, 148, 161
- Lagache et al. (2000) Lagache, G. Haffner, L. M., Reynolds, R. J. & Tufte, S. L. 2000, A&A, 354, 247
- Madau and Pozzetti (2000) Madau, P. & Pozzetti, L. 2000, A&A, 312, L9
- Mapelli et al. (2004) Mapelli, M., Salvaterra, B. & Ferrara, A. 2004, submitted to MNRAS (astro-ph/0410615)
- Matsumoto et al. (1988) Matsumoto, T., M. Akiba & Murakami, H. 1988, ApJ, 332, 575
- Matsumoto et al. (2000) Matsumoto, T., Cohen, M., Freund, M. M., Kawada, M. & Lim, M. 2000, In Lect. Notes Phys. 548, ISO Surveys of a Dusty Universe, eds. D. Lemke, M. Stickel & K. Wilke, Berlin/Heidelberg: Springer Verlag, 96
- Matsumoto (2001) Matsumoto, T. 2001, In ASP Conf. Ser., 204, The Extragalactic Infrared Background and its Cosmological Implications, eds. Martin Harwit & Michael G. Hauser, 87
- Matsumoto (2004) Matsumoto, T. 2004, SPIE, 5487, in press
- Matsuhara et al. (2000) Matsuhara, H. Kawara, K. Sato, Y. Taniguchi, Y. Okuda, H. Matsumoto, T. Sofue, Y. Wakamatsu, K. Cowie, L. L., Joseph, R. D. & Sanders, D. B. 2000, A&A, 361, 407
- Matsuura et al. (1994) Matsuura, S., Kawada, M., Matsuhara, H., Matsumoto, T., Tanaka, M., Lim, M. & Murakami, H. 1994, PASP, 106, 770
- Matsuura et al. (2004) Matsuura, S., Wada, T. & Matsumoto, T. 2004, Adv. Sp, Sci., in press
- Minezaki et al. (1998) Minezaki, T., Cohen, M., Kobayashi, Y., Yoshii, Y., & Peterson, B. A. 1998, AJ, 115, 229
- Murakami et al. (1996) Murakami, H. et al. 1996, PASJ, 48, L41
- Murakami et al. (2003) Murakami, H., Noda, M., Cohen, M., Matsuura, M, Freund, M. M. & Tanaka, M. 2003, In The calibration Legacy of the ISO mission, eds. L. Metcalfe et al., ESA SP-481, 431
- Murakami (2004) Murakami, H. 2004, SPIE, 5487, in press
- Noda et al. (1992) Noda, M., Christov, V. V., Matsuhara, H. Matsumoto, T., Matsuura, S., Noguchi, K., Sato, S. & Murakami, H. 1992, ApJ, 391, 456
- Noda et al. (1994) Noda, M. et al. 1994, ApJ, 428, 363
- Noda et al. (1996) Noda, M. et al. 1996, SPIE, 2817, 248
- Pearson et al. (2004) Peason, C., Shibai, H., Matsumoto, T., Murakami, H. Nakagawa, T., Kawada, M., Onaka, T., Matsuhara, H., Kii, T. & Yamamura, I. 2004, MNRAS, 347, 1113
- Pilbratt (2004) Pilbratt, G. L. 2004, SPIE, 5487, in press
- Puget et al. (1996) Puget, J.-L, et al. 1996, A&A,308, L5
- Salvaterra and Ferrara (2003) Salvaterra, R. & Ferrara, A. 2003, MNRAS, 339, 973
- Smail et al. (2002) Smail, I., Ivison, R. J., Blain, A. W. & Kneib, J.-P. 2002, MNRAS, 331, 495
- Stecker et al. (1993) Stecke, F. W., De Jager, O.C. & Salamon, M. H. 1993, ApJ, 390, L49
- Tanaka et al. (1996) Tanaka, M., Matsumoto, T., Murakami, H., Kawada, M., Noda, M. & Matsuura, S. 1996, PASJ, 48, L53
- Tanihata et al. (2001) Tanihata, C., Takahashi, T. & Matsumoto, T. 2001, In ASP Conf. Series, 251, New Century of X-ray Astronomy, eds. D. H. Inoue, & H. Kunieda, 414
- Totani and Yoshii (2000) Totani,T. & Yoshii, Y. 2000, ApJ, 540, 81
- Totani et al. (2001) Totani,T. Yoshii, Y., Iwamuro, F., Maihara, T., & Motohara, K. 2001, ApJ, 550, L137
- Vrtilek and Hauser (1995) Vrtilek, J. M. & Hauser, M. G. 1995, ApJ, 455, 677
- Wright and Reese (2000) Wright, E. L. & Reese, E. D. 2000, ApJ, 545, 43
- Wright (2001) Wright, E. L. 2001, ApJ, 553, 538
- Yamamura et al. (2003) Yamamura. I, Tanaka, M, Takahashi, H. et al. 2003, In Exploiting the ISO Data Archive – Infrared Astronomy in the Internet Age, ed. C. Gry et al., ESA SP-511, 35


| Errors | ||||||||
|---|---|---|---|---|---|---|---|---|
| Wavelength | Residual | Fitting | Error of Starlight | Error of | Systematic | Total | ||
| (m) | error | Cut-off Mag | Model | ZL Model | error | |||
| 3.98 | 15.5 | 1.73 | 0.47 | 0.58 | 3.17 | 1.37 | 3.9 | |
| 3.88 | 15.3 | 1.75 | 0.48 | 0.61 | 2.83 | 1.15 | 3.6 | |
| 3.78 | 13.5 | 1.74 | 0.51 | 0.66 | 2.57 | 0.83 | 3.3 | |
| 3.68 | 13.1 | 2.40 | 0.66 | 0.78 | 2.38 | 1.22 | 3.7 | |
| 3.58 | 15.5 | 1.56 | 0.58 | 0.73 | 2.24 | 0.79 | 3.0 | |
| 3.48 | 14.4 | 1.67 | 0.60 | 0.80 | 2.17 | 0.88 | 3.0 | |
| 3.38 | 14.6 | 1.69 | 0.67 | 0.82 | 2.13 | 0.77 | 3.0 | |
| 3.28 | 13.6 | 1.54 | 0.71 | 0.90 | 2.17 | 0.81 | 3.0 | |
| 3.17 | 16.4 | 1.19 | 0.70 | 0.88 | 2.25 | 0.98 | 2.9 | |
| 3.07 | 19.7 | 0.94 | 0.93 | 0.92 | 2.35 | 1.06 | 3.0 | |
| 2.98 | 18.6 | 0.94 | 0.77 | 0.92 | 2.44 | 1.35 | 3.2 | |
| 2.88 | 19.5 | 0.88 | 0.91 | 0.92 | 2.67 | 1.56 | 3.5 | |
| 2.54 | 23.7 | 0.79 | 1.07 | 1.07 | 3.55 | 1.31 | 4.2 | |
| 2.44 | 22.7 | 1.11 | 1.06 | 1.23 | 3.91 | 1.04 | 4.5 | |
| 2.34 | 24.4 | 0.92 | 1.28 | 1.27 | 4.28 | 0.92 | 4.8 | |
| 2.24 | 29.7 | 1.01 | 1.38 | 1.37 | 4.77 | 0.71 | 5.3 | |
| 2.14 | 35.4 | 1.03 | 1.66 | 1.46 | 5.38 | 0.77 | 6.0 | |
| 2.03 | 39.2 | 1.12 | 2.08 | 1.67 | 6.28 | 0.74 | 7.0 | |
| 1.93 | 43.2 | 1.34 | 2.32 | 1.98 | 7.08 | 0.89 | 7.9 | |
| 1.83 | 51.0 | 1.45 | 2.56 | 2.04 | 8.01 | 0.88 | 8.8 | |
| 1.73 | 58.7 | 1.74 | 2.85 | 2.31 | 9.38 | 1.03 | 10.3 | |
| 1.63 | 65.9 | 2.14 | 3.24 | 2.68 | 10.8 | 1.54 | 11.9 | |
| 1.53 | 71.3 | 2.45 | 3.26 | 2.80 | 11.6 | 2.11 | 12.8 | |
| 1.43 | 70.1 | 2.48 | 3.72 | 2.98 | 11.8 | 2.53 | 13.2 | |
| Authors | J | K | L |
|---|---|---|---|
| Dwek & Arendt (1998) | – | – | |
| Gorjian et al. (2000) | – | ||
| – | |||
| Wright and Reese (2000) | – | ||
| – | |||
| Wright (2001) | – | ||
| – | |||
| Cambrésy et al. (2001) | – |