INTEGRAL and XMM–Newton Observations of GRB 040106††thanks: Based on observations with INTEGRAL, an ESA project with instruments and science data centre funded by ESA member states (especially the PI countries: Denmark, France, Germany, Italy, Switzerland, Spain), Czech Republic and Poland, and with the participation of Russia and the USA.
On January 6th 2004, the IBAS burst alert system triggered the 8th gamma–ray burst (GRB) to be located by the INTEGRAL satellite. The position was determined and publicly distributed within 12 s, prompting ESA’s XMM–Newton to execute a ToO observation just 5 hours later, during which an X–ray afterglow was detected. The GRB had a duration 52 s with two distinct pulses separated by 42 s. Here we present the results of imaging and spectral analyses of the prompt emission from INTEGRAL data and the X–ray afterglow from XMM–Newton data. The –ray spectrum is consistent with a single power–law of photon index -1.72 0.15. The fluence (20 - 200 keV) was 8.2 10-7 erg cm-2. The X–ray afterglow () was extremely hard with and . The 2 - 10 keV flux 11 hours after the burst was 1.1 10-12 erg cm-2 s-1. The time profile of the GRB is consistent with the observed trends from previous analysis of BATSE GRBs. We find that the X–ray data are not well-fit by either a simple spherical fireball or by a speading jet, expanding into a homogeneous medium or a wind environment. Based on previously determined correlations between GRB spectra and redshift, we estimate a redshift of 0.9 (1 ) and a lower limit on the isotropic radiated energy of 5 1051 erg in this burst.
Key Words.:
gamma–rays: bursts – gamma–rays: observations – X–rays: observations1 Introduction
Gamma–ray bursts are an amazingly energetic phenomenon, capable of a jetted output of order 1051 erg in a few seconds. Although first detected in the late 1960s, significant progress has mostly been achieved in the last dozen years. That GRBs are extragalactic in origin was suggested by the isotropic distribution of GRBs observed by BATSE on board the Compton Gamma–Ray Observatory (Meegan et al. 1992; Fishman et al. 1994). The discovery by BeppoSAX of afterglows in the X–ray (Costa et al. 1997) and subsequent discoveries at optical (van Paradijs et al. 1997) and radio (Frail et al. 1997) wavelengths have led to redshift measurements (Metzger et al. 1997) for 40 bursts ranging from 0.105 to 4.5.
ESA’s International Gamma–Ray Astrophysics Laboratory INTEGRAL (Winkler et al. 2003), launched in October 2002, is composed of two main telescopes, an imager IBIS (Ubertini et al. 2003), and a spectrometer SPI (Vedrenne et al. 2003), coupled with two monitors, one in the X–ray band and the other working at optical wavelengths. Although not built as a GRB-oriented mission, INTEGRAL has a burst alert system, IBAS (Mereghetti et al. 2003). IBAS carries out rapid localisations for GRBs incident on the IBIS detector with a precision of a few arcminutes (Mereghetti et al. 2004b). The public distribution of these co-ordinates enables multi-wavelength searches for afterglows at lower energies. INTEGRAL data on the prompt emission in combination with the early multi-wavelength studies offer the best currently available probe of these energetic phenomena.
2 INTEGRAL Observations and Results
GRB 040106 was detected by IBAS at 17:55:11 UTC on January 6th 2004 (Mereghetti et al. 2004a) with a signal to noise ratio of 7.7 in the 15 to 200 keV band for the interval from 17:55:10 UTC to 17:55:65 UTC. The burst was observed at = 11h 52m 17.7s, = -46 47′ 15″, at an off-axis angle of 10.5°, lying in the partially coded FoV of IBIS and of SPI, but outside the FoV of the two monitoring instruments, JEM–X and the OMC. The IBAS alert was automatically distributed approximately 12 s after the burst start time with a positional uncertainty of only 3′. Due to the weakness of the burst, data in the energy range 20 - 60 keV from the two time intervals around the prominent peaks of emission were combined to enable SPI to determine a position for the GRB. The position for GRB 040106 extracted from the SPI data is = 11h 52m 51s, = -46° 47′ 13″ (S/N = 6.8), which is 5.7′ away from the IBIS location, consistent with the 10′ location accuracy of SPI for a source with S/N 10 (Dubath et al. 2004). At 23:05 UT XMM–Newton began a 45 ks exposure ToO observation. A bright source was visible at = 11h 52m 12.4s, = -46° 47′ 15.9″ in the 30 ks Quick-Look-Analysis (Ehle et al. 2004), 0.9′ from the IBAS position (Tedds & Watson 2004).
2.1 Light Curves
This GRB falls into the class of long bursts with a duration of 52 s and two prominent pulses with a peak to peak separation of 42 s and a long quiescent interval of 24 s between the pulses. Light curves are available from SPI and IBIS. The ISGRI detector of IBIS (Lebrun et al. 2003), an array of 128 128 CdTe crystals sensitive to lower energy –rays, was used to produce the light curves of GRB 040106 in the ranges 15 - 40 keV and 40 - 200 keV (Fig. 1). The burst light curves were extracted using the pixels which had at least half of their surface illuminated by the GRB. The spectral lag could not be determined with any precision due to the weakness of the burst. The best constraint was obtained using a cross-correlation function on the background-subtracted IBIS data in the energy ranges 15 - 40 keV and 40 - 200 keV and a time-binning of 0.2 s from 10-65 s after 17:55:00 UT. The measured lag was 0 1 s which is about what can be estimated by eye and does not allow us to constrain the GRB to a location on the lag-luminosity diagram, since lags are expressed on a logarithmic scale.
The determination of SPI light curves with a short time binning is only possible by using the 1 s count rates of the 19 germanium detectors, which are usually used for scientific house-keeping purposes. These values reflect the count rates of each detector in the broad SPI energy band from 20 keV - 8 MeV. The SPI light curve in Fig. 1 was generated by summing the background–subtracted count rates. The background ( 50 counts s-1 detector-1) was determined from a 40 minute period before the burst trigger and was subtracted for each detector individually.
A hardness ratio was derived from the ISGRI data by comparing the count rate in the different energy bands such that HR = (H - S)/(H + S). The time bins were chosen to ensure at least 100 counts per bin in the sum of the two bands. The evolution of the hardness ratio is shown in the bottom panel of Fig. 1. Although visual inspection indicates a slight hardening in the second pulse, this is not statistically significant (2 level).
The IBIS light curve was denoised using a wavelet analysis (Quilligan et al. 2002) and the temporal properties of the two pulses (rise time, fall time, FWHM) were extracted and are shown in Table 1.

2.2 Spectral Analysis
IBIS is a coded mask instrument and the photons of a single point source are spread over all the individual detectors. Spectral extraction is possible using specifically designed software which consists of modelling the illuminated mask by a point source of unitary flux placed at the sky coordinates of the GRB. The model is then fit to the detected shadowgram in each energy channel to obtain the rate and error for each channel. ISGRI single events were used to derive photon indices and fluxes for two time intervals, of 9 s and 8 s duration, around the peaks of emission as shown in the column ‘IBIS/ISGRI’ of Table 2. Spectral fitting was carried out using two methods. Firstly, a time averaged spectrum was derived for GRB 040106 by comparing its count rate in different energy bins to the corresponding values obtained from the Crab Nebula observed at a similar position in the FoV. This method yields a best-fit single power–law model with photon index -1.32 0.28 and a fluence of 1.1 10-6 erg cm-2. Secondly, the effect of the IBIS mask support structure (the so-called nomex), which absorbs low–energy ( 50 keV) photons differently at different off-axis angles has been taken into account using Offline Software Analysis (OSA) version 4.0 off-axis correction matrices and the extracted spectra have been modified accordingly. The improved low-energy response yields a best-fit single power–law model with photon index of -1.72 0.15 and a fluence of 8.2 10-7 erg cm-2. The spectral fit results for the 2 pulses using the nomex correction are given in Table 2. Due to the improved low energy response, these are the spectral indices used in subsequent discussion.
The spectral evolution of GRB 040106 was also investigated with SPI. Spectra were extracted for two time intervals around the peaks of emission. The background was determined from a 40 minute period of SPI data before the burst trigger. The first interval is 7 s long starting at the very beginning of the burst at 17:55:11 UTC, and the second begins 34 s later and lasts for 12 s. Single events detected by SPI, corrected for intrinsic deadtimes and telemetry gaps, were binned into 5 equally spaced logarithmic energy bins in the 20 keV to 500 MeV range in each of the chosen intervals. Version 3 of the OSA from the INTEGRAL Science Data Centre (Courvoisier et al. 2003) and the software package SPIROS 6 (Skinner & Connell 2003) were used for SPI spectral extraction, while XSPEC 11.2 was used for model fitting. The results are shown in the column labelled ‘SPI’ in Table 2. The same analysis was conducted for multiple events incident on the SPI detectors, but yielded no significant improvement to the fit.
3 XMM–Newton
XMM–Newton observed the position of GRB 040106 for about 45 ks, starting only 20 ks after the burst. For the MOS1 camera (Turner et al. 2001) of the EPIC instrument the medium optical blocking filter was used, while for the MOS2 and PN detectors (Strüder et al. 2001) the thin filter was chosen. All three X–ray cameras operated in Full Frame Mode. The data were processed using SAS version 5.4.1.
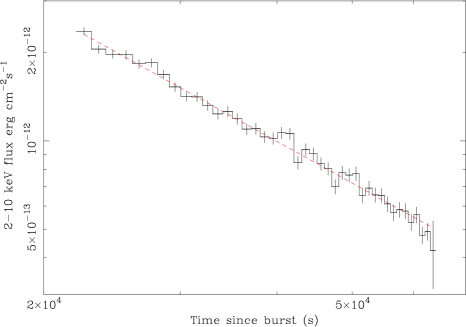
A fading X–ray source was clearly detected in the IBAS error region. The light curve, obtained by summing the counts from the three EPIC cameras, is shown in Fig. 2. The afterglow time decay () is well fit by a power–law with index = 1.46 0.04 (1 ). An analysis of the light curves in different energy ranges and of the corresponding hardness ratios showed no evidence for spectral changes during the XMM–Newton observation.
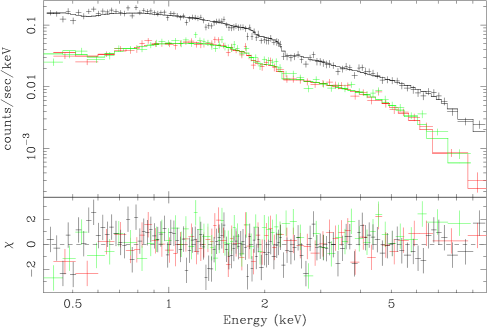
Afterglow spectra from the PN and MOS cameras were obtained after standard data screening. The GRB afterglow position was close to a gap between two chips of the PN detector, so the PN spectra were extracted both from a circle of 40″ radius and from a smaller circle of 20″ radius, which did not contain the gap. Since the two extraction regions led to consistent results, the spectrum extracted from the larger region, containing about 90 % of the source counts, was used for subsequent analysis. The background spectra were taken from source free regions of the same observation. The three spectra in the 0.4 - 10 keV range, rebinned to have at least 30 counts per bin, are well fit by a power–law model (Fig. 3) with spectral index = 0.47 0.01 (1 ) (where ), absorption NH = 7.4 0.9 1020 cm-2 and flux of 1.1 10-12 erg cm-2 s-1 (2 - 10 keV) at 11 hours after the burst (observed flux not corrected for absorption). The column density is consistent with the Galactic value in this direction (8.6 1020 cm-2).
From the analysis of the combined MOS and PN spectra of the entire observation, a 3 upper limit of 40 and 200 eV can be set on the equivalent width for narrow emission lines in the 0.5 - 2 and 2 - 8 keV energy ranges, respectively.
4 Discussion
4.1 Interpretation of the X–ray Afterglow Behaviour
The X–ray afterglow of GRB 040106 has a remarkably hard , which is flatter than that of any other X–ray afterglow seen by XMM–Newton (Piro 2004). BeppoSAX measured values in this range, but not with such high precision (Frontera 2003). GRB 020405 was observed by Chandra to have and (Mirabal et al. 2003) compatible, within the large errors, with the values measured by XMM–Newton in GRB 040106.
Following the approach of Price et al. (2002) we consider the suitability of three afterglow models using the closure relation where the specific values of and required for closure depend on the model and whether the X–ray frequency, , is above or below , the cooling frequency of the electrons. The models considered are (i) a simple spherical fireball expanding into a homogeneous medium (‘ISM’) (Sari et al. 1998); (ii) a spherical fireball expanding into a wind environment (‘Wind’) (Chevalier & Li 1999) and (iii) a spreading jet expanding into either a wind-stratified medium or the ISM (Sari et al. 1999).
The combination of very hard and relatively typical makes it difficult to fit the data with any of these models (Table 3). The model which comes closest to meeting the closure condition is the case of spherical expansion into a stellar-wind density profile when . This interpretation of the XMM–Newton data has already been considered in the case of GRB 040106 (Gendre et al. 2004). The results of the XMM–Newton analysis presented in Section 3 are consistent with those obtained by Gendre et al. (2004). Our improved constraint on ( 0.04 rather than 0.1) comes from our use of both PN and MOS camera data, improving the light curve statistics and resulting in a less convincing agreement (5 away from the closure condition) with the wind model. The wind interpretation also requires that is already above at the time of the X–ray measurement since no deviation from a power–law decay is seen in the XMM–Newton lightcurve. The required high cooling frequency suggests that the stellar wind has a low density and/or a low energy fraction for magnetic fields in the blast wave, similar to the case of GRB 020405 (Chevalier et al. 2004).
There are two measurements in R–band (m and ) of the likely optical afterglow (Masetti et al. 2004), the first of which was made during the XMM–Newton observation, the second 24 hours later. The optical flux is consistent with the extrapolation of the X–ray spectrum (Gendre et al. 2004). The observed temporal decay of the R-band light curve has a power–law index of 1.2 0.4 which is compatible with that seen at X–ray wavelengths. Therefore, the cooling frequency could be below optical wavelengths or above the X–ray at the time of the XMM–Newton observation. Gendre et al. (2004) argue that the cooling frequency has moved above the X–ray band 11 hours post-burst since their XMM–Newton analysis gives good agreement with the wind model prediction for this case. We have shown that there is no strongly compelling case in favour of the wind model from the X–ray data (Table 3).
In fact, the X–ray spectral index is exactly coincident with the spectral index ‘fast cooling’ case of the synchrotron shock afterglow model (Sari et al. 1998; Zhang & Mészáros 2004; Piran 2000), for the limited spectral region where (where is the synchrotron cooling frequency) and , where represents the characteristic synchrotron frequency of the lower-energy limit of the emitting electron distribution. This limit exists so that electron energy distributions with a power–law index do not diverge at low energies). The predicted temporal decay in this case is much flatter than that observed, however a more complicated geometry, such as in the case of an anisotropic jet, where the emission or bulk Lorentz factor varies with angle, leaves the time decay index largely unconstrained (Mészáros et al. 1998).
For all cases shown in Table 3 the appropriate power–law index for the electron distribution, , is significantly flatter than the nearly universal power–law spectrum for charged particles accelerated near ultra-relativistic shocks, which has a slope of 2.2 - 2.3 (Achterberg et al. 2001). A model of highly collimated jets with flat electron spectra (Dai & Cheng 2001), although not meeting the closure condition imposed by the X–ray data, occupies the right region of the parameter space and may, with suitable modification, provide a good fit to the afterglow data in this case.
4.2 Comparison with other INTEGRAL bursts
Eighteen GRBs occurred within the field of view of the main INTEGRAL instruments up to the end of October 2004. One of these events, initially classified as a GRB (GRB 040903) is believed to be an X–ray flash (XRF) or a possible Type I X–ray flare from a new transient source in the Galactic bulge (Götz et al. 2004). In a second case, GRB 031203, modelling of the dust-scattered X–ray echo provided the first evidence for a low luminosity, XRF source (Vaughan et al. 2004; Watson et al. 2004). The IBIS spectrum, however, is consistent with a single power–law of photon index (Sazonov et al. 2004), typical of INTEGRAL bursts. This event is the only INTEGRAL burst to date for which a direct redshift () measurement has been made (Prochaska et al. 2004).
A single power–law model, with photon index in the range -2.0 to -1.0, provides a good fit to the data for the vast majority of INTEGRAL bursts in the range 20 - 200 keV (von Kienlin et al. 2003). Only one burst detected by IBIS, GRB 030131, was best fit by a Band model over its whole duration, with break energy, E0, of keV; photon index below the turnover, , of and photon index above the turnover, , of (Götz et al. 2003). GRB 030131 occurred during an INTEGRAL slew and due to telemetry restrictions only limited SPI data were obtained for this event (Moran et al. 2004).
4.3 Constraints on redshift and energy
A relationship between , the –ray spectral index below the spectral turnover, and redshift, derived from BeppoSAX –ray bursts with known redshifts, is of the form (Amati et al. 2002):
| (1) |
This relationship reflects a dependence of on the peak energy, Ep, due to spectral curvature, rather than a fundamental connection between and . Assuming the IBIS photon index is , the redshift of GRB 040106 derived from Eq. 1 is (1 ). This is a reasonable assumption since most values are steeper than -2, while most values are in the range -2 to 0 (Preece et al. 2000). We estimate 200 keV as the lower limit on the break energy, since there is no curvature evident in the INTEGRAL spectra up to this energy. In the cosmological rest-frame, using the lower limit on from above, keV. The peak energy, , is given by and hence keV. The relationship (Amati et al. 2002) can then be used to estimate a lower limit on the isotropic radiated energy, , of erg in this burst. Due to the weakness of this GRB, no strong constraint on the spectral lag, and hence on the peak luminosity from the luminosity-lag relationship, could be determined (Norris et al. 2000).
The lower limit on the isotropic radiated energy is a factor of 10 higher than the ‘mean’ erg determined by Frail et al. (2001) when geometric corrections due to the effects of a jet are taken into account. Liang (2004) has investigated the relationships between jet opening angle, , and the prompt emission and the X–ray afterglow emission in a sample of 10 GRBs. The 20 - 2000 keV fluence as a function of is found to be a broken power–law, with a break at . GRB 040106 has an estimated 20 - 2000 keV fluence of erg cm-2. This is probably an over-estimate since it assumes the power–law spectrum extends up to 2 MeV, which is almost certainly not the case. However, it allows us to determine a lower limit on from the –ray data from the relation:
| (2) |
for , where is the –ray fluence in units of erg cm-2 (Liang 2004). A lower limit of rad is obtained from this relation. Hence, a lower limit of erg on the energy radiated in –rays is derived. Uncertainties in the cosmological correction which should be applied, and in the true spectral shape, probably give rise to an uncertainty of order 2 in the –ray fluence, which is % on .
The value predicted from the X–ray afterglow decay slope of (Liang 2004) according to the relation:
| (3) |
is , considerably smaller than the lower limit derived from the –ray data. If this correction is applied to the isotropic radiated energy estimate, then a lower limit of erg on the energy radiated in –rays is obtained.
A third relationship, between the rest-frame X–ray afterglow flux 10 hours after the burst and , is given by:
| (4) |
where is the rest-frame 2 - 10 keV flux derived from the observed flux in units of erg cm-2 s-1 according to:
| (5) |
Using derived above, a value of 0.24 rad is obtained, consistent with the estimate from the –ray data.
From the burst morphology view-point, GRB 040106 has the characteristics of a low-luminosity, long lag burst (few, well-separated peaks) (Norris 2002). Its location in super-galactic coordinates (161∘, -22∘) is consistent with that found in the subset of such bursts (Norris 2002), but there is no independent evidence to suggest that this event is anything other than a ‘standard’ cosmological burst. The pulse properties and time intervals between pulses are related to T90 (McBreen et al. 2002). The time interval, T, and properties of the two pulses of GRB 040106, including rise time, fall time and FWHM fit well with the expected trends from previous analyses of BATSE bursts (McBreen et al. 2002).
4.4 GRB-Afterglow Connection

We examined the possibility that the second pulse of the GRB is the onset of the afterglow. The temporal decay of the 2nd pulse is consistent with a power–law (with large errors due to the small number of bins and their low counts) which may indicate the presence of a high-energy afterglow, due to external shocks, during the burst itself.
The IBIS and SPI derived fluxes in the two pulses were extrapolated to X–ray energies, assuming a single power–law spectrum, to estimate the 2 - 10 keV flux during the GRB. Clearly this is valid only if the GRB has neither an X–ray excess nor is X–ray rich. It is unlikely that this is an X–ray rich GRB with a peak energy at or below the low end of the SPI and IBIS detector sensitivity (i.e. 20 keV) since the photon index would then correspond to an unusually hard value for the high-energy index above the spectral turnover (Preece et al. 2000). It is more likely that the weakness of this GRB washes out evidence for a spectral break at more typical energies of a few hundred keV.
The extrapolated fluxes from SPI and IBIS are shown as symbols in Fig. 4. Folding in the range of possible values of the SPI and IBIS extrapolated fluxes, assuming they follow the power–law temporal decay of the 2nd GRB pulse, these extrapolated values fall marginally below the backward extrapolation of the late-time X–ray afterglow data obtained by XMM–Newton (Fig. 4). Assuming the decay slope of the 2nd pulse is indicative of the onset of a high-energy afterglow, the change in temporal decay occurs roughly between 50 and 5 000 s after the onset of the GRB and may be evidence of the passage of the cooling break through the X–ray band in that time window. The fact that the –ray photon index and X–ray spectral index are within 2 of each other suggests that during the X–ray observations. This interpretation hinges on the assumption that the decay of the 2nd GRB pulse is the onset of the afterglow.
5 Conclusion
INTEGRAL’s capabilities for GRB studies, from the rapid and accurate localisation provided by IBAS, to the good timing and spectral resolution provided by SPI and IBIS, are well illustrated in the case of GRB 040106. The –ray measurements have provided a constraint on the redshift () and energy (lower limit on the isotropic radiated energy of erg) for this burst, in the absence of optical spectroscopy. Furthermore, previously identified correlations between –ray properties and X–ray afterglows have been used to estimate the jet opening angle ( rad) and hence the geometry-corrected radiated energy ( erg) in this burst.
The combination of very hard energy index and relatively typical temporal decay makes it difficult to fit the X–ray data with afterglow models of a simple spherical fireball or a jet, expanding into either the ISM or a wind environment. In particular, we can rule out the case of isotropic expansion into a wind environment (), suggested by Gendre et al. (2004), at 5 confidence. In all scenarios, the power–law index of the emitting electrons is flatter than 2 and models involving flat electron spectra may be more successful fitting the X–ray afterglow data of this burst.
The additional science provided by the combination of –ray and X–ray early afterglow measurements highlight the importance of broadband high-energy coverage from the GRB through to the first days post-burst. We anticipate the significant progress in this area that will be made with the launch of NASA’s Swift mission.
Acknowledgements.
We thank the anonymous referee for his/her useful comments which helped to improve this paper.References
- Achterberg et al. (2001) Achterberg, A., Gallant, Y. A., Kirk, J. G., & Guthmann, A. W. 2001, MNRAS, 328, 393
- Amati et al. (2002) Amati, L., Frontera, F., Tavani, M., et al. 2002, A&A, 390, 81
- Burenin et al. (1999) Burenin, R. A., Vikhlinin, A. A., Gilfanov, M. R., et al. 1999, A&A, 344, L53
- Chevalier & Li (1999) Chevalier, R. A. & Li, Z. Y. 1999, ApJ, 520, L29
- Chevalier et al. (2004) Chevalier, R. A., Li, Z. Y., & Fransson, C. 2004, ApJ, 606, 369
- Costa et al. (1997) Costa, E., Frontera, F., Heise, J., et al. 1997, Nature, 387, 783
- Courvoisier et al. (2003) Courvoisier, T. J. L., Walter, R., Beckmann, V., et al. 2003, A&A, 411, L53
- Crew et al. (2003) Crew, G. B., Lamb, D. Q., Ricker, G. R., et al. 2003, ApJ, 599, 387
- Dai & Cheng (2001) Dai, Z. G. & Cheng, K. S. 2001, ApJ, 558, L109
- Dubath et al. (2004) Dubath, P. et al. 2004, submitted to Astronomy & Astrophysics
- Ehle et al. (2004) Ehle, M., Gonzalez-Riestra, R., & Gonzalez-Garcia, B. 2004, GCN 2508
- Fishman et al. (1994) Fishman, G. J., Meegan, C. A., Wilson, R. B., et al. 1994, ApJS, 92, 229
- Frail et al. (1997) Frail, D. A., Kulkarni, S. R., Nicastro, S. R., Feroci, M., & Taylor, G. B. 1997, Nature, 389, 261
- Frail et al. (2001) Frail, D. A., Kulkarni, S. R., Sari, R., et al. 2001, ApJ, 562, L55
- Frontera (2003) Frontera, F. 2003, in Supernovae and Gamma–Ray Bursts, ed. K. Weiler, Lecture Notes in Physics 598 (Heidelberg: Springer), astro–ph/0406579
- Gendre et al. (2004) Gendre, B., Piro, L., & De Pasquale, M. 2004, A&A, 424, L27
- Götz et al. (2003) Götz, D., Mereghetti, S., Hurley, K., et al. 2003, A&A, 409, 831
- Götz et al. (2004) Götz, D., Mereghetti, S., Produit, N., & Mowlavi, N. 2004, GCN 2695
- Lebrun et al. (2003) Lebrun, F., Leray, J. P., Lavocat, P., et al. 2003, A&A, 411, L141
- Liang (2004) Liang, E. W. 2004, MNRAS, 348, 153
- Masetti et al. (2004) Masetti, N., Palazzi, E., Rol, E., et al. 2004, GCN 2515
- McBreen et al. (2002) McBreen, S., McBreen, B., Quilligan, F., & Hanlon, L. 2002, A&A, 385, L19
- Meegan et al. (1992) Meegan, C. A., Fishman, G. J., Wilson, R., et al. 1992, Nature, 355, 143
- Mereghetti et al. (2004a) Mereghetti, S., Götz, D., Beck, M., et al. 2004a, GCN 2505
- Mereghetti et al. (2004b) Mereghetti, S., Götz, D., Beck, M., et al. 2004b, in Proceedings of the 5th INTEGRAL Workshop: The INTEGRAL Universe (Munich), ESA Special Publication SP-552, astro–ph/0404019, in press
- Mereghetti et al. (2003) Mereghetti, S., Götz, D., Borkowski, J., Walter, R., & Pedersen, H. 2003, A&A, 411, L291
- Mészáros et al. (1998) Mészáros, P., Rees, M. J., & Wijers, R. A. M. J. 1998, ApJ, 499, 301
- Metzger et al. (1997) Metzger, M. R., Djorgovski, S. G., Kulkarni, S. R., et al. 1997, Nature, 387, 879
- Mirabal et al. (2003) Mirabal, N., Paerels, F., & Halpern, J. P. 2003, ApJ, 587, 128
- Moran et al. (2004) Moran, L., Hanlon, L., McBreen, B., et al. 2004, in Gamma–ray bursts: 30 years of discovery, Proceedings of the Santa Fe workshop, ed. E. E. Fenimore & M. Galassi., AIP Conference Proceedings Vol. 727, 225
- Norris (2002) Norris, J. P. 2002, ApJ, 579, 386
- Norris et al. (2000) Norris, J. P., Marani, G. F., & Bonnell, J. T. 2000, ApJ, 534, 248
- Piran (2000) Piran, T. 2000, Physics Reports, 333, 529
- Piro (2004) Piro, L. 2004, in Proceedings of the 3rd workshop on gamma–ray bursts in the afterglow era, ed. M. Feroci, F. Frontera, N. Masetti, & L. Piro, ASP Vol.312, 149
- Preece et al. (2000) Preece, R. D., Briggs, M. S., Mallozzi, R., et al. 2000, ApJS, 126, 19
- Price et al. (2002) Price, P. A., Berger, E., Reichart, D. E., et al. 2002, ApJ, 572, L51
- Prochaska et al. (2004) Prochaska, J. X., Bloom, J. S., Chen, H. W., et al. 2004, ApJ, 611, 200
- Quilligan et al. (2002) Quilligan, F., McBreen, B., Hanlon, L., et al. 2002, A&A, 385, 377
- Sari et al. (1999) Sari, R., Piran, T., & Halpern, J. P. 1999, ApJ, 519, L17
- Sari et al. (1998) Sari, R., Piran, T., & Narayan, R. 1998, ApJ, 497, L17
- Sazonov et al. (2004) Sazonov, S. Y., Lutovinov, A. A., & Sunyaev, R. A. 2004, Nature, 430, 646
- Skinner & Connell (2003) Skinner, G. & Connell, P. 2003, A&A, 411, L123
- Strüder et al. (2001) Strüder, L., Briel, U., Dennerl, K., et al. 2001, A&A, 365, L18
- Tedds & Watson (2004) Tedds, J. A. & Watson, D. 2004, GCN 2520
- Turner et al. (2001) Turner, M. J. L., Abbey, A., Arnaud, M., et al. 2001, A&A, 365, L27
- Ubertini et al. (2003) Ubertini, P., Lebrun, F., Cocco, G. D., et al. 2003, A&A, 411, L131
- van Paradijs et al. (1997) van Paradijs, J., Groot, P. J., Galama, T., et al. 1997, Nature, 386, 686
- Vaughan et al. (2004) Vaughan, S., Willingale, R., O’Brien, P., et al. 2004, ApJ, 603, L5
- Vedrenne et al. (2003) Vedrenne, G., Roques, J. P., Schönfelder, V., et al. 2003, A&A, 411, L63
- von Kienlin et al. (2003) von Kienlin, A., Beckmann, V., Rau, A., et al. 2003, A&A, 411, L299
- Watson et al. (2004) Watson, D., Hjorth, J., Levan, A., et al. 2004, ApJ, 605, L101
- Winkler et al. (2003) Winkler, C., Courvoisier, T. J. L., Di Cocco, G., et al. 2003, A&A, 411, L1
- Zhang & Mészáros (2004) Zhang, B. & Mészáros, P. 2004, International Journal of Modern Physics, A19, 2385, astro-ph/0311321