11email: michele,roy@oso.chalmers.se 22institutetext: Service d’Astrophysique, DAPNIA/DSM/CEA CE de Saclay, 91 191 Gif-sur-Yvette, France
22email: Vincent.Minier@cea.fr
A general catalogue of 6.7-GHz methanol masers††thanks: The complete catalogue (Table 3) is available in electronic form at the CDS via anonymous ftp to cdsarc.u-strasbg.fr (130.79.125.5) or via http://cdsweb.u-strasbg.fr/cgi-bin/qcat?/J/A+A/
Methanol masers are often detected in regions of intense star formation. Several studies in the last decade indicate that they may even be the earliest signpost of a high-mass star-forming region. Their powerful emission make them very good candidates for observations using both single–dish telescopes and interferometers, the latter allows detailed structural and dynamical studies of these objects. We have prepared a catalogue of all known 6.7-GHz methanol masers, discovered both by surveys that targeted possible associated objects and unbiased surveys covering a large fraction of galactic longitudes across the Galactic plane ( for most of the regions). The catalogue contains 519 sources which are listed with their kinematic (galactocentric and heliocentric) distances as well as possibly associated IR objects. We find that 6.7-GHz methanol masers clearly trace the molecular ring of our Galaxy, where most of the OB associations are located. The present list of masers also reports detections of other masing transitions of methanol as further information for the study of the maser phenomenon. In a further publication we will address some statistical considerations.
Key Words.:
star formation – Interstellar medium – masersemail: michele@oso.chalmers.se
1 Introduction
Methanol masers were originally detected toward regions of active star formation (e.g. GMCs, H ii regions) and have recently gained increasing interest in the community. The first observed transition was the -E line at 25 GHz, which was discovered toward Orion-KL by Barrett et al. (1971). Nearly 20 years later, Batrla et al. (1987) and Menten (1991a) detected two very bright (1-1000 Jy) methanol maser transitions at 12.2 and 6.7 GHz, respectively. Given that methanol masers at 6.7 and 12.2 GHz were associated and had never been observed toward 25-GHz maser sources, Menten (1991b) proposed to empirically divide methanol masers in two classes, Class I (e.g. 25 and 44 GHz masers) and Class II (e.g. 6.7 and 12.2 GHz). This classification is still valid. Class II masers are directly associated with the birth place of a massive star (e.g. hot cores, ultra-compact H ii regions) and may be pumped radiatively by infrared radiation from nearby warm dust (Sobolev et al. 1997). Class I masers are seen offset from strong radio continuum sources (i.e. young ionising high-mass stars) and may be pumped collisionally (Cragg et al. 1992). However, the nature of Class I maser sites remains poorly known.
During the past decade, extensive maser searches have been undertaken using two different strategies: (1) targeted searches undertaken toward colour–selected infrared (IR) sources and known regions of intense star formation (e.g. IRAS sources, OH and H2O masers); (2) full-sampling and unbiased surveys covering large regions of sky conducted both in the Northern and in the Southern hemispheres. These methods yield different results in terms of detection statistics. The targeted surveys focused only on well-known sites and missed masers arising in regions where they were not necessarily expected. The unbiased searches detected all sources in a certain area of sky, and were biased only by the sensitivity of the observations.
To date, the most powerful and widespread methanol maser transition is the -A+ line at 6.7 GHz. It plays a key role in finding new high-mass star-forming regions and in studying their kinematics at high angular resolution. The objective of this paper is to provide a complete catalogue of the 6.7-GHz methanol maser sources. Section 2 describes the searches for methanol masers and summarises their main results. Section 3 describes the catalogue and lists the referenced publications. Section 4 gathers the conclusions we draw after the first analysis of the data in the catalogue. Further statistical analysis of the catalogue will be the matter of a further publication.
2 Searches for 6.7-GHz methanol masers: 1991-2004
2.1 Targeted surveys
6.7-GHz methanol masers were discovered by Menten (1991a). At this frequency the author expected to find an enhanced absorption toward Class I maser sources. The observation of a sample of 123 star-forming regions including both Class I and Class II maser regions as well as H ii regions and OH masers yielded instead 80 detections of a strong maser emission, which was characterised as a Class II maser. All previously known Class II methanol maser sites in that sample showed 6.7-GHz maser emission, as did 78 of the 98 main line OH maser sources in the same sample.
The work by Menten (1991a) was a starting point for a number of extended targeted searches for 6.7-GHz methanol masers, which probed large samples of putative star-forming regions. These targets were selected either by the presence of maser species (OH, H2O and 12.2-GHz methanol masers) or by IRAS point sources exhibiting IR colours of ultra-compact (UC) H ii regions (e.g. Wood & Churchwell 1989). The surveys were conducted by MacLeod et al. (1992); MacLeod & Gaylard (1992); Gaylard & MacLeod (1993); Schutte et al. (1993); Caswell et al. (1995); Van der Walt et al. (1995, 1996); Walsh et al. (1997); Slysh et al. (1999); Szymczak et al. (2000a). The upper part of Table 1 lists these targeted searches with their detection rate, the sensitivity of the observations (when reported in the associated publication) and the target types. A list of all searches at 6.7 GHz is presented in Table 2.
MacLeod et al. (1992) reported a 100% detection rate of 6.7-GHz methanol masers toward known 12.2-GHz masers. All of the new sources were associated with compact IR sources from the IRAS point source catalogue (IRAS PSC) within the positional errors ( arcmin). Subsequent work by the same authors (MacLeod & Gaylard 1992; Gaylard & MacLeod 1993) found 40 and 18 new methanol masers respectively toward OH maser sources. Caswell et al. (1995) listed 245 6.7-GHz methanol maser sources detected toward star formation regions, and OH maser sites with a detection rate of . From the luminosity function of the masers, the authors concluded that there should be about 500 sources in the Galaxy.
Furthermore, methanol masers seemed to be associated with OH maser sources having the reddest far-IR colours (). Schutte et al. (1993) searched for 6.7-GHz methanol masers toward colour selected IRAS sources. The selection criteria were based on the Wood & Churchwell (1989) IRAS colour criteria for UC H ii regions, with the addition of lower limits for 60- and 100-m fluxes. This survey suggested for the first time that massive star formation regions could be traced by methanol masers alone. Larger samples of colour-selected IRAS sources were searched by Van der Walt et al. (1995), where the properties of the 31 new sources as well as all the previous detections are discussed. No correlation between maser and IRAS flux densities could be found. Spatially, methanol masers seemed to be concentrated in the inner part of the Galactic plane and followed the velocity curve of the Milky Way. Van der Walt et al. (1996) noticed that methanol masers were concentrated in the Galactic plane, showing a scale-height significantly smaller than the molecular gas in the Galaxy. The luminosity function of methanol masers seemed to be a power law with an index close to –2. Walsh et al. (1997) found that their 201 detections toward 535 IRAS colour selected sources lay between spiral arms. This result suffered from an ambiguity in the kinematics distances. Two extensive targeted searches (Slysh et al. 1999; Szymczak et al. 2000a) were undertaken toward very large samples of IRAS sources up to Northern hemisphere declinations. The detection rates were . Slysh et al. (1999) pointed out the large velocity dispersion of the sources and their uniform distribution over the inner part of the Galaxy. Szymczak et al. (2000a) and Szymczak et al. (2000b) found sources with IR colours falling outside the range for typical UC H ii regions.
Surveys giving negative results have also been reported. 6.7 GHz methanol masers were not detected towards a sample of low-mass star-forming regions (Minier et al. 2003), of evolved stars (Koo et al. 1988) and starburst galaxies (Phillips et al. 1998), although the line was detected in the Large Magellanic Cloud (Ellingsen et al. 1994). Long term monitoring of 54 methanol maser sources showed that most masers were variable over a few days to several days (Goedhart et al. 2004b). The types of behaviour include non-variability to periodic maser flares (Goedhart et al. 2004a).
2.2 Full-sampling unbiased surveys
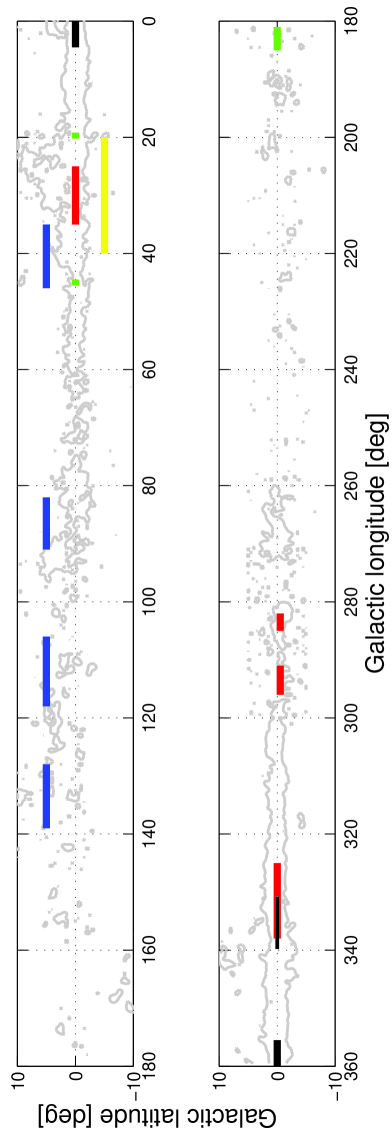
Parallel to targeted searches, a series of unbiased surveys covering large areas of the sky were undertaken (Fig. 1, online). The main goal of these observations was to find all detectable sources in the surveyed regions. These surveys were carried out by Ellingsen (1996), Caswell (1996a), Caswell (1996b), Szymczak et al. (2002), the group in Noto (Italy) (Palagi et al.) and the group at the Onsala Space Observatory (OSO) in Sweden (Minier 2000, Pestalozzi et al. 2002b). Table 3 lists all galactic regions that have been covered by unbiased observations.
The OSO survey covered a total of about 55 square degrees of sky. The portion of the Galactic plane usefully observable from Onsala extended to galactic longitudes , in contrast to the other unbiased surveys, which had focused on the inner parts (). This is illustrated by the colour boxes in Figure 1. The OSO survey yielded 11 detections, 4 of them that are new. Only one detection was made for longitudes greater than .
The unbiased surveys have been very effective in detecting methanol maser sources where no clear signposts of star formation were previously known. Ellingsen (1996) found that about 50% of the 100 detections in his survey do not have any clear IRAS PS counterpart. The same conclusion was confirmed by Szymczak et al. (2002). Three of the four new sources of the Onsala survey are of this kind as well.
2.3 Follow-up observations
High angular resolution observations using the Australia Telescope Compact Array (ATCA) and Very Long Baseline Interferometry techniques (VLBI) revealed that the physical association of methanol masers with UC H ii regions does not hold for all sources. In general, as seen by Walsh et al. (1998) and Minier et al. (2001), the methanol maser appeared to be clearly offset from the main radio continuum peak marking the UC H ii region. The maser sites are therefore radio-quiet sources. Minier et al. (2001) proposed that methanol masers are mostly associated with hot molecular cores and hyper-compact H ii regions, which probably represent earlier stages of high-mass star formation than the UC H ii region phase.
(Sub)Millimetre observations of methanol maser sites (Pestalozzi et al. 2002a, Walsh et al. 2003 and Minier et al. 2004) demonstrated that methanol masers with no radio continuum emission were always detected in the mm continuum. The spectral energy distribution of these sources was consistent with that of an embedded, luminous, massive protostellar object (Minier et al. 2004). IR observations were also performed (e.g. Walsh et al. 1999; Goedhart et al. 2002; De Buizer et al. 2000) indicating that methanol masers were not always associated with the brightest IR source but might arise from a nearby, deeply embedded source.
Furthermore, methanol masers might trace Keplerian rotating protostellar disks seen edge-on. The masers arise from an extended, flat structure with a linear velocity gradient along it. The best example was imaged and modelled in NGC7538-IRS1 (e.g. Minier et al. 1998; Pestalozzi et al. 2004). Other objects also showed an ordered structure both in space and line-of-sight velocity (Norris et al. 1998; Minier et al. 2001). The cases for disks are not straightforward in all sources and methanol masers could also be associated with outflows (Minier et al. 2001).
Finally, Minier et al. (2003) detected a weak 6.7-GHz methanol maser toward NGC 2024, a region of intermediate-mass star formation in Orion B. The maser was associated with a massive protostellar core that could host a nascent high-mass star. Recent observations by Voronkov et al. (2004) have also revealed methanol emission at 6.7 GHz in the OMC-1 region near the 25-GHz maser site, i.e. a Class I maser source.
2.4 Methanol maser modelling
Theoretical modelling was developed to produce synthetic emission spectra of methanol masers at 6.7 and 12.2 GHz. It was found that in order to reproduce typical brightness temperatures of K, an IR radiation field is needed as well as ambient dust temperature of about 150 K (Sobolev et al. 1997; Cragg et al. 2001, Sutton et al. 2001 for refinements). This radiation field plays a dual role in producing methanol masers. It is required to release methanol from the icy mantles of dust grains and to inject a sufficient amount of methanol into the gas phase, reaching the needed column densities of cm-2. It also provides pump photons for the population inversion. These conditions are actually met in a region where young, embedded massive ( M⊙) stars are present (see Minier et al. 2003 and references therein). The IR radiation field needed for pumping the masers could then be provided either by warm dust near the protostar or by shocks produced by accreted material and outflows.
3 Catalogue description
Each entry of the catalogue (Table 3, available only in
electronic format at the CDS via anonymous ftp to
cdsarc.u-strasbg.fr (130.79.125.5) or via
http://cdsweb.u-strasbg.fr/cgi-bin/qcat?/J/A+A/) contains the
following information: source name
(sounam), right ascension and declination in J2000 coordinates
(raj2000 and decj2000), galactic longitude and latitude
(glon, glat), radial velocity (vlsr), velocity range
with minimal and
maximal velocities (vmin, vmax), peak flux (peak),
kinematic distances (galactocentric,
g_dist as well as far and near heliocentric, s_dfar,
s_dnear), possible IRAS111Infrared Satellite,
12,25,60,100 m, 2’ pos. rms at 100 m and MSX222Midcourse
experiment, 4, 8, 14, 21 m, 1-5” pos. rms associated sources
(iras, msx), usual name (u_name), other masing
transitions detected (m12,m44,m85,m86,m95,m107,m108,m156), references
corresponding to the
6.7-GHz methanol maser detections (ref). Celestial coordinates,
radial velocities and flux refer to the brightest spectral feature if the
source shows a complex spectrum.
The position accuracy may be deduced from the way the positions are listed in
the catalogue. Positions from single-dish measurements have one significant
decimal number in right ascension (RA) and none in declination (DEC). Australia
Telescope Compact Array (ATCA) positions from
Walsh et al. (1998) have been approximated to two significant decimal numbers in RA
and to the closest half second in DEC (0.5”). Positions from
Caswell (1996a, b) have been approximated to two and one significant decimal
numbers in RA and DEC, respectively. Full precision (three and two significant
decimal numbers in RA and DEC
respectively) is listed for sources observed using VLBI
(Minier et al. 2000, 2001). Not all source positions have been determined
accurately using high angular resolution, and this creates some difficulties
when trying to draw conclusions about associations. Note that many sources
show a number of features spread in space and frequency. When wal98
is listed in the references it means that the catalogue lists the position of
the brightest component in that region.
The flux densities listed in our catalogue refer to the first measurement if the sources have been detected several times. Since it is known that many methanol maser sources show variability (e.g. Goedhart et al. 2003, 2004b), it is difficult to be accurate to better than 10%.
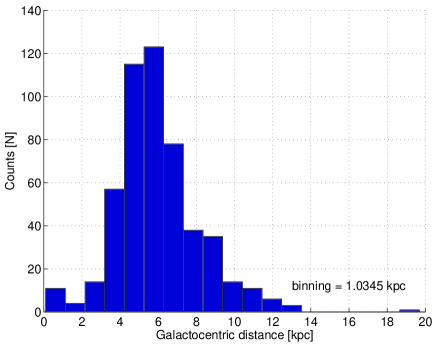
The kinematic distances listed in the catalogue have been calculated using the Brand & Blitz (1993) Galactic rotation curve, using kpc (galactocentric distance of the Sun) and kms-1 (solar orbital velocity around the Galactic center). However, we are not able to safely discriminate between far and near heliocentric distance for each source. When available, it is possible to compare the listed heliocentric distances with distances measured using e.g. optical or IR photometry. This is not possible for all sources, since some of them are deeply embedded in a thick dust cocoon and isolated from optical H ii, so not visible at those wavelengths. What is more, some of the sources show forbidden radial velocities, i.e. velocities not corresponding to the quadrant of the LOS velocity – longitude diagram they are in. For these sources the distance is not calculated. Finally, sources having show only one heliocentric distance, as expected. The binning used in Figure 4 is 1 kpc. This value was chosen after an error analysis of the calculation of the galactocentric distance, which is affected by the uncertainties in the galactic coordinates and the line–of–sight velocity (taken to be on average 1 arcmin in and and 0.2 kms-1, respectively).
For each source, possible associations with IRAS and MSX sources are given. The IRAS associations often refer to the observed field where the IRAS point source is taken as the name of the field. 457 sources are listed with an IRAS counterpart. We list the closest MSX source in an area of radius 1, 2 or 3 arcmin from the position of the 6.7-GHz methanol maser. All but 7 sources show association with an MSX source. 370 sources seem to have an MSX counterpart within 1 arcmin, another 119 within 2 arcmin. This fact comes from the better angular resolution of MSX, which could prevent the problems coming from confusion. Only one source (173.71+2.35) shows neither an IRAS nor an MSX counterpart. Six sources have a clear IRAS, but no MSX counterpart, and 62 sources show an MSX counterpart without any IRAS identification. In all but five of the last mentioned sources the MSX is within 2 arcminutes.
The references to the 6.7-GHz detections appearing in the catalogue are listed in Table 2 in order to facilitate the search. They always refer to 6.7-GHz detections or re-observations. When a source has been observed several times the reference to the listed position is preceeded by a star.
The columns reserved for other masing transitions of methanol contain the value of the peak flux density measured. The references to these detections are listed in Table 4, but not in the catalogue.
| Targeted |
#det./#obs. |
1 [Jy] | Selection |
|---|---|---|---|
men91 |
80 / 123 | – | UCH ii, H2O, OH |
mcl92a |
19 / 19 | 4 | 12.2 GHz masers |
mcl92b |
40 / 94 | 1.7-2 | OH, H2O masers |
gay93 |
18 / 62 | 0.5 | OH masers |
schu93 |
35 / 235 | 1 | IRAS, col. sel. |
cas95a |
245 / | 0.06 | OH (208), SFR |
vdw95 |
31 / 520 | 1.7 | IRAS (UCH ii) |
vdw96 |
5 / 241 | 1.7 | IRAS (UCH ii) |
wal97 |
201 / 535 | 1 | IRAS, col. sel. |
sly99 |
42 / 429 | 0.5-0.6 | IRAS (UCH ii) |
szy00a |
182 / 1399 | 0.7 | IRAS, col. sel. |
| Unbiased |
#det./ (deg)2
|
Detection rate | |
cas96a,b |
80 / 3.24 | 0.16 | 24.7 / (deg)2 |
elli96 |
107 / 33 | 0.52 | 3.2 / (deg)2 |
szy02 |
100 / 20 | 0.53 | 5 / (deg)2 |
Noto00,02 |
10 / 4.5 | – | 2.2 / (deg)2 |
Onsala99-03 |
11 / 50 | 1 | 0.22 / (deg)2 |
| Code | Reference | Telescope |
|---|---|---|
men91 |
Menten 1991a | Green Bank, 43 m |
mcl92a |
MacLeod et al. 1992 | Hartebeestoek, 25 m |
mcl92b |
MacLeod & Gaylard 1992 | Hartebeestoek, 25 m |
schu93 |
Schutte et al. 1993 | Hartebeestoek, 25 m |
gay93 |
Gaylard & MacLeod 1993 | Hartebeestoek, 25 m |
cas95 |
Caswell et al. 1995 | Parkes, 76 m |
vdW95 |
Van der Walt et al. 1995 | Parkes, 76 m |
vdW96 |
Van der Walt et al. 1996 | Hartebeestoek, 25 m |
elli96 |
Ellingsen et al. 1996 | Parkes, 76 m |
cas96a |
Caswell 1996a | ATCA |
cas96b |
Caswell 1996b | ATCA |
wal97 |
Walsh et al. 1997 | ATCA |
wal98 |
Walsh et al. 1998 | ATCA |
sly99 |
Slysh et al. 1999 | Medicina, 32 m |
min00 |
Minier et al. 2000 | VLBA, EVN, ATCA |
szy00 |
Szymczak et al. 2000b | Torun, 32 m |
szy02 |
Szymczak et al. 2002 | Torun, 32 m |
min01 |
Minier et al. 2001 | EVN |
min03 |
Minier et al. 2003 | ATCA |
noto |
Palagi et al. | Noto, 25 m |
on00 |
Onsala blind Survey | Onsala, 25 m |
| -range | -range | Area | Project |
|---|---|---|---|
| –4.5∘ – 4.5∘ | b | 1.8 | cas96b |
| 19.2∘ – 20.2∘ | b | 0.5 | noto |
| 20∘ – 40∘ | b | 20.0 | szy02 |
| 25∘ – 35∘ | b | 10.0 | elli96b |
| 35∘ – 46∘ | b | 11.0 | on00 |
| 44.5∘ – 45.5∘ | b | 1.0 | noto |
| 82∘ – 91∘ | b | 9.0 | on00 |
| 106∘ – 118∘ | b | 13.0 | on00 |
| 128∘ – 139∘ | b | 12.0 | on00 |
| 181.0∘ – 185.0∘ | b | 3.0 | noto |
| 282∘ – 286∘ | –1.03∘ b ∘ 0.03∘ | 4.0 | elli96b |
| 291∘ – 296∘ | –1.03∘ b ∘ 0.03∘ | 5.0 | elli96b |
| 325∘ – 338∘ | b | 13.0 | elli96b |
| 330.8∘ – 339.8∘ | b | 1.44 | cas96a |
| Other regions | 4.0 | on00 |
| Reference | Telescope, freq. [GHz] |
|---|---|
| Batrla et al. 1987 | 12 |
| Koo et al. 1988 | Hat Creek, 12 |
| Bachiller et al. 1990 | Yebes-14m, 44 |
| Haschick et al. 1990 | Haystack, 44 |
| Kalenskii et al. 1994 | Metsaehovi-13.7-m, 95 |
| Slysh et al. 1994 | Parkes, 44 |
| Val’tts et al. 1995 | OSO-20m, 107 |
| Slysh et al. 1995 | Kitt Peak, 156 |
| Caswell et al. 1995b | Parkes, 12 |
| Val’tts et al. 1999 | Mopra, 107-108 |
| Val’tts et al. 2000 | Mopra, 95 |
| Caswell et al. 2000 | SEST, 107 and 156 |
| Minier & Booth 2002 | OSO-20m, 85,86,95,107,108,111 |
| Błaszkiewicz & Kus 2004 | Toruń, 12 |
| Ellingsen et al. 2003 | Mopra, 85.5 & 86.6 |
4 Summary and conclusions
As a part of the Onsala unbiased survey of the Galactic plane searching for 6.7-GHz methanol masers (Pestalozzi et al. 2002b), we have gathered all 6.7-GHz methanol masers found since 1991 in a general catalogue. Our goal was both to deliver to the community a useful tool for selecting potential young high-mass star-forming regions and to draw some statistical conclusions about the maser phenomenon in our Galaxy. From the first order analysis of the general catalogue, several conclusions can be drawn:
-
•
519 methanol maser sites are present in the catalogue;
-
•
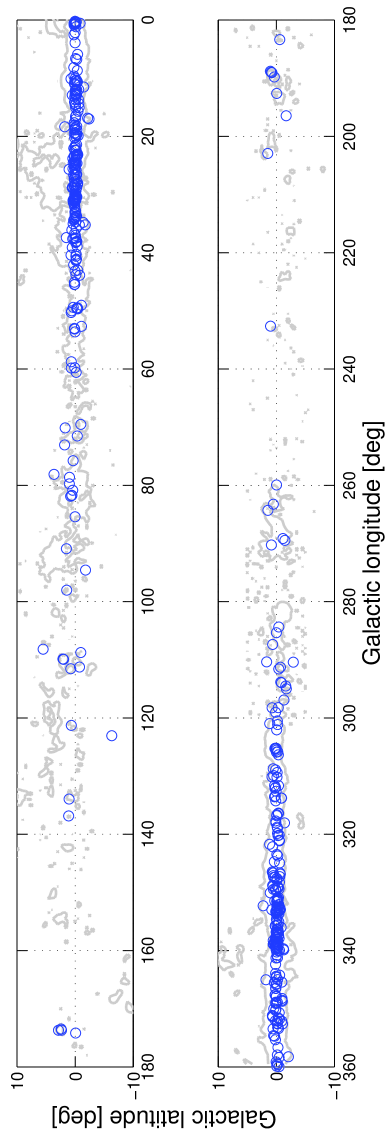
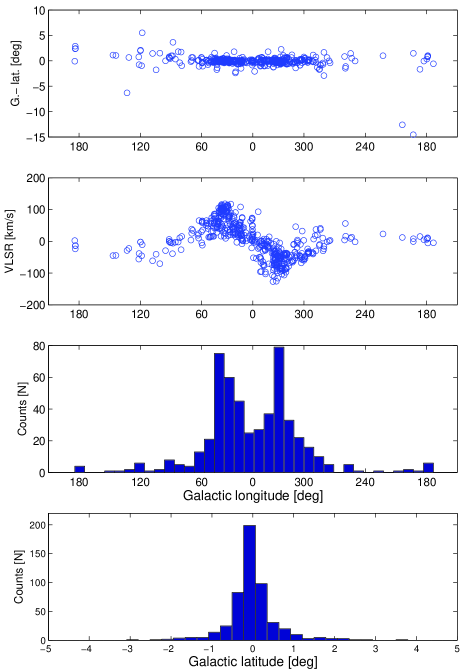
6.7-GHz methanol masers show a non-random distribution in the Galactic plane, concentrated in a ring of (see Figures 2 and 3);
-
•
a Gaussian fitting of the distribution across the Galactic plane shows a FWHM close to 0.5∘. This is less than found in the literature before 1996 (see Figure 3, bottom). This could be due to the fact that unbiased searches (started in 1996) have concentrated on regions close to the Galactic plane;
-
•
the location of this ring seems to agree very well with the position of the molecular ring of the Milky Way as defined by e.g. Bronfman et al. (2000) as having a radius of (see figure 4). The ring is also the location of most of the OB associations: this fact supports the idea that methanol masers are closely associated with massive star formation;
-
•
about 50% of the sources have flux densities between 10 and 200 Jy, 45% of the sources are weaker than 10 Jy, 27.9% weaker than 5 Jy. This fact suggests that the population of methanol masers in the Galaxy is probably dominated by weak emitters. An example comes from Szymczak et al. (2002), where the new sources discovered have a mean flux below 10 Jy.
Unbiased, high sensitivity searches seem then to be a useful way to complete the general catalogue of galactic 6.7-GHz methanol masers.
Acknowledgements.
We thank the technical staff at the Onsala Space Observatory for the excellent support while surveying the Galactic plane. We also are very grateful to Simon Ellingsen and Andrew Walsh for providing accurate positions for a large number of sources.References
- Bachiller et al. (1990) Bachiller, R., Gòmez-Gonzalez, J., Barcia, A., & Menten, K. 1990, A&A, 240, 116
- Barrett et al. (1971) Barrett, A., Schwartz, P., & Waters, J. 1971, ApJL, 168, L101
- Batrla et al. (1987) Batrla, W., Matthews, H., Menten, K., & Walmsley, C. 1987, Nature, 326, 49
- Błaszkiewicz & Kus (2004) Błaszkiewicz, L. & Kus, A. 2004, A&A, 413, 233
- Brand & Blitz (1993) Brand, J. & Blitz, L. 1993, A&A, 275, 67
- Bronfman et al. (2000) Bronfman, L., Casassus, S., May, J., & Nyman, L.-A. 2000, A&A, 358, 521
- Caswell (1996a) Caswell, J. 1996a, MNRAS, 279, 79
- Caswell (1996b) —. 1996b, MNRAS, 283, 606
- Caswell et al. (1995b) Caswell, J., Vaile, R., Ellingsen, S., & Norris, R. 1995b, MNRAS, 274, 1126
- Caswell et al. (1995) Caswell, J., Vaile, R., Ellingsen, S., Whiteoak, J., & Norris, R. 1995, MNRAS, 272, 96
- Caswell et al. (2000) Caswell, J., Yi, J., Booth, R., & Cragg, D. 2000, MNRAS, 313, 599
- Cragg et al. (1992) Cragg, D., Johns, K., Godfrey, P., & Brown, R. 1992, MNRAS, 259, 203
- Cragg et al. (2001) Cragg, D., Sobolev, A., Ellingsen, S., et al. 2001, MNRAS, 323, 939
- Dame et al. (1987) Dame, T., Ungerechts, H., Cohen, R., et al. 1987, ApJ, 322, 706
- De Buizer et al. (2000) De Buizer, J., Piña, R., & Telesco, C. 2000, ApJS, 130, 437
- Ellingsen (1996) Ellingsen, S. 1996, PhD thesis, University of Tasmania, Hobart
- Ellingsen et al. (2003) Ellingsen, S., Cragg, D., Minier, V., Muller, E., & Godfrey, P. 2003, MNRAS, 344, 73
- Ellingsen et al. (1996) Ellingsen, S., von Bibra, M., McCulloch, P., et al. 1996, MNRAS, 280, 378
- Ellingsen et al. (1994) Ellingsen, S., Whiteoak, J., R.P., N., J.L., C., & Vaile, R. 1994, MNRAS, 269, 1019
- Gaylard & MacLeod (1993) Gaylard, M. & MacLeod, G. 1993, MNRAS, 262, 43
- Goedhart et al. (2003) Goedhart, S., Gaylard, M., & van der Walt, D. 2003, MNRAS, 339, L33
- Goedhart et al. (2004a) Goedhart, S., Minier, V., van der Walt, D., & Gaylard, M. 2004a, MNRAS, in press
- Goedhart et al. (2004b) Goedhart, S., van der Walt, D., & Gaylard, M. 2004b, MNRAS, in press
- Goedhart et al. (2002) Goedhart, S., van der Walt D.J., & Gaylard, M. 2002, MNRAS, 335, 125
- Haschick et al. (1990) Haschick, A., Menten, K., & Baan, W. 1990, ApJ
- Kalenskii et al. (1994) Kalenskii, S., Liljestroem, T., Val’tts, I., et al. 1994, A&ASS, 103, 129
- Koo et al. (1988) Koo, B.-C., Williams, D., Heiles, C., & Backer, D. 1988, ApJ, 326, 931
- MacLeod & Gaylard (1992) MacLeod, G. & Gaylard, M. 1992, MNRAS, 256, 519
- MacLeod et al. (1992) MacLeod, G., Gaylard, M., & Nicolson, G. 1992, MNRAS, 254, 1
- Menten (1991a) Menten, K. 1991a, ApJ, 380, L75
- Menten (1991b) Menten, K. 1991b, in Atoms, ions and molecules: New results in spectral line astrophysics, ed. A. Haschick & P. Ho, Vol. 16 (ASP: San Franisco), 119
- Minier (2000) Minier, V. 2000, PhD thesis, Chalmers University of Technology, Sweden
- Minier & Booth (2002) Minier, V. & Booth, R. 2002, A&A, 387, 179
- Minier et al. (1998) Minier, V., Booth, R., & Conway, J. 1998, A&A, 336, L5
- Minier et al. (2000) —. 2000, A&A, 362, 1093
- Minier et al. (2004) Minier, V., Burton, M., Hill, T., et al. 2004, A&A, in press
- Minier et al. (2001) Minier, V., Conway, J., & Booth, R. 2001, A&A, 369, 278
- Minier et al. (2003) Minier, V., Ellingsen, S., Norris, R., & Booth, R. 2003, A&A, 403, 1095
- Norris et al. (1998) Norris, R., Byleveld, S., Diamond, P., & co authors. 1998, ApJ, 508, 275
- Pestalozzi et al. (2004) Pestalozzi, M., Elitzur, M., Conway, J., & Booth, R. 2004, ApJL, 603, L113
- Pestalozzi et al. (2002a) Pestalozzi, M., Humphreys, E., & Booth, R. 2002a, A&A, 384, L15
- Pestalozzi et al. (2002b) Pestalozzi, M., Minier, V., Booth, R., & Conway, J. 2002b, in Cosmic Masers: from Proto-Stars to Black Holes, ed. V. Migenes & M. Reid, Vol. S–206 (ASP: San Francisco), 139
- Phillips et al. (1998) Phillips, C., Norris, R., Ellingsen, S., & Rayner, D. 1998, MNRAS, 294, 265
- Schutte et al. (1993) Schutte, A., van der Walt, D., Gaylard, M., & MacLeod, G. 1993, MNRAS, 261, 783
- Slysh et al. (1995) Slysh, V., Kalenskii, S., & Val’tts, I. 1995, ApJ, 442, 668
- Slysh et al. (1994) Slysh, V., Kalenskii, S., Valtts, I., & Otrupcek, R. 1994, MNRAS, 268, 464
- Slysh et al. (1999) Slysh, V., Val’tts, I., & Kalenskii, S. 1999, A&AS, 134, 115
- Sobolev et al. (1997) Sobolev, A., Cragg, D., & Godfrey, P. 1997, MNRAS, 288, L39
- Sutton et al. (2001) Sutton, E., Sobolev, A., Ellingsen, S., et al. 2001, ApJ, 554, 173
- Szymczak et al. (2000b) Szymczak, M., Hrynek, G., & Kus, A. 2000b, A&ASS, 143, 269
- Szymczak et al. (2000a) Szymczak, M., Kus, A., & Hrynek, G. 2000a, MNRAS, 312, 211
- Szymczak et al. (2002) Szymczak, M., Kus, A., Hrynek, G., Kepa, A., & Pazdereski, E. 2002, MNRAS, 392, 277
- Val’tts et al. (1995) Val’tts, I., Dzura, A., Kalenskii, S., et al. 1995, A&A, 294, 825
- Val’tts et al. (2000) Val’tts, I., Ellingsen, S., Slysh, V., et al. 2000, MNRAS, 317, 315
- Val’tts et al. (1999) —. 1999, MNRAS, 310, 1077
- Van der Walt et al. (1995) Van der Walt, D., Gaylard, M., & MacLeod, G. 1995, A&AS, 110, 81
- Van der Walt et al. (1996) Van der Walt, D., Retief, S., Gaylard, M., & MacLeod, G. 1996, MNRAS, 282, 1085
- Voronkov et al. (2004) Voronkov, M., Sobolev, A., Ellingsen, S., Ostrovskii, A., & Alakoz, A. 2004, ApSS
- Walsh et al. (1998) Walsh, A., Burton, M., Hylard, A., & Robinson, G. 1998, MNRAS, 301, 640
- Walsh et al. (1999) —. 1999, MNRAS, 309, 905
- Walsh et al. (1997) Walsh, A., Hylard, A., Robinson, G., & Burton, M. 1997, MNRAS, 291, 261
- Walsh et al. (2003) Walsh, A., Macdonald, G., Alvey, N., Burton, M., & Lee, J.-K. 2003, A&A, 410, 597
- Wood & Churchwell (1989) Wood, D. & Churchwell, E. 1989, ApJ, 340, 265