The Initial Mass Function toward the low-mass end in the Large Magellanic Cloud with HST/WFPC2 Observations
Abstract
We present and equivalent HST/WFPC2 photometry of two areas in the Large Magellanic Cloud: The southern part of the stellar association LH 52, located on the western edge of the super-shell LMC 4, and a field between two associations, which is located on the southwestern edge of the shell, and which accounts for the general background field of the galaxy. The HST/WFPC2 observations reach magnitudes as faint as mag, much deeper than have been observed earlier in stellar associations in the LMC. We determine the MF for main-sequence stars in the areas. Its slope in both areas is steeper for stars with masses 2 M⊙ (4 6), compared with stars of 2 M⊙ (1 2). Thus, as far as the field of the LMC concerns the MF does not have a uniform slope throughout its observed mass range. The MF of the general field of the LMC was found previously to be steeper than the MF of a stellar association for massive stars with 5 M⊙. We conclude that this seems to be also the case toward lower masses down to 1 M⊙. Our data allow to construct the field-subtracted, incompleteness-corrected, main-sequence MF of the southwestern part of the young stellar association LH 52, which accounts for the Initial Mass Function (IMF) of the system. Its mean slope is found to be comparable, but still more shallow than a typical Salpeter IMF () for masses down to 1 M⊙. We found indications that the IMF of the association probably is “top-heavy”, due to the large number of intermediate-mass stars in the field of the system, while the general LMC field is found to be responsible for the low-mass population, with 2 M⊙, observed in both fields. This finding suggests that the local conditions seem to favor the formation of higher mass stars in associations, and not in the background field. No evidence for flattening of the IMF toward the low-mass regime, nor a lower mass cutoff in the IMF was detected in our data.
1 Introduction
Stellar associations are young systems defined by their bright early-type stellar content (Ambartsumian 1947; Blaauw 1964), constituting a unique length-scale of the star formation process in a galaxy (Efremov & Elmegreen 1998a). While the membership of stars to associations in our own Galaxy is not easily verified (unless kinematic information is available for the stars in these areas; e.g. de Zeeuw et al. 1999) extra-galactic stellar associations are outlined by their bright early-type stellar content, and hence they can easily be identified in the general stellar field from the loci of their bright stars alone (Hodge 1986). Thus, their original identification with the use of photographic or photoelectric data has been based purely on these stars (see references in Gouliermis et al. 2003, Table 4). More advanced CCD ground-based observations have allowed to observe with better sensitivity and to resolve these systems down to their intermediate-mass populations, in particular for associations in the Large Magellanic Cloud (e.g. Massey et al. 1989; Parker & Garmany 1993; Hill et al. 1994; Garmany, Massey & Parker 1994; Oey & Massey 1995; Will, Bomans & Dieball 1997; Parker et al. 2001). A recent comprehensive study, however, with the high spatial resolution, provided by HST, of extra-galactic stellar associations and their fields is still lacking.
The Large Magellanic Cloud (LMC), our closest neighboring irregular galaxy, is characterized by a unique sample of stellar associations (Lucke & Hodge 1970) and is known to contain a large number of them throughout its extent (Gouliermis et al. 2003), easily identified by their bright stellar content. This galaxy has lower mass and metallicity in comparison to our own, but it has been shown to have almost the same present-day star formation rate (e.g. Westerlund 1997). This results in a large number of early-type stars establishing intense radiation fields, leading to the star formation in the LMC being different from the Milky Way. Most of the LMC associations are related to bright HII regions (Davies, Elliott & Meaburn 1976), indicating places of on-going star formation. Many of them have been detected on the edges of super-giant HI shells (Meaburn 1980), as identified by Kim et al. (1999), which suggests that it is likely that these systems are the product of massive sequential or triggered star formation events (Gouliermis et al. 2003). They are characterized by loose structure, so that their observations do not suffer from crowding effects, while the reddening toward them is low enough to reveal the entirety of any pre-main-sequence population. The stellar content of the general LMC field can be easily identified and distinguished from the one of the associations, while the foreground contamination from Galactic stars toward the LMC is minute. These facts make young LMC stellar associations very attractive targets for the study of stellar populations in regions of recent star formation and, in general, for the investigation of newly formed stellar systems in the Local Group.
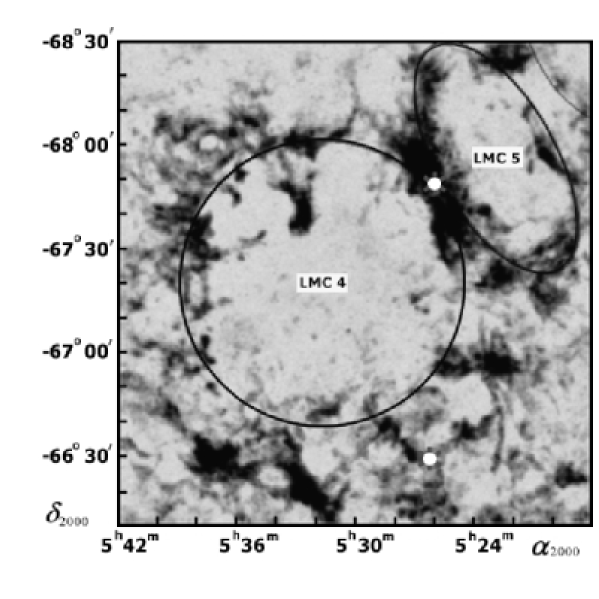
LMC 4 (Shapley Constellation III) is considered to be one of the most impressive super-giant shells in the LMC (Meaburn 1980). It is located north-east of the Bar and its edges, which are easily detected in HI (Fig. 1), are also clearly highlighted by a large number of HII regions, most of which are related to stellar associations. The origin of LMC 4 has been discussed by de Boer et al. (1998) and Efremov & Elmegreen (1998b). Several previous studies have been concentrated on stellar associations located on the edge of LMC 4. In the following, we summarize the results of the three most recent. Dolphin & Hunter (1998) performed photometry on six fields within Shapley Constellation III with the 0.9m telescope at CTIO. These fields cover association LH 77 and four LMC clusters, as well as two general fields. These authors were able to measure stars accurately down to 19th magnitude in and , with the cutoff caused by crowding effects. They concluded that stars have formed in two modes in the constellation, a more diffuse mode, and a tighter clustered mode. They constructed the mass function of the observed regions and they did not find any low-mass cutoff for star formation down to 1.5 M⊙. Olsen, Kim & Buss (2001) analyzed the association LH 72 and its surroundings in LMC 4 with photometry from 1.5m and 0.9m telescopes at CTIO. They identified emission stars in the boundaries of the system and a broad main sequence down to 21 mag. They concluded that the expansion of the shell has cleared the northeastern quadrant of gas and triggered the formation of LH 72 behind its shock front. Gouliermis et al. (2002) used and H imaging from the 1-m telescope at Siding Spring Observatory to study an area of 205 205 on the north-east edge of LMC 4, where three stellar associations are located, the most interesting being the association LH 95. This system was found to be very young, with the highest emissivity of the related large bright HII region (DEM L 252) to be connected to four Be emission stars concentrated in its very center. Their photometry was complete down to 20 mag. These authors constructed the mass function of the system for masses down to 2 M⊙. This limit was set by the completeness. They suggested that there is a clear distinction between the population of the system, of its surrounding field and of the general field of the LMC for stars within the observed stellar mass limits.
The above studies on associations located in the vicinity of LMC 4 demonstrate the necessity for high spatial resolution photometry on the region, in order to detect the lower main-sequence stellar populations in star-forming regions of the LMC. This will also allow the determination of the low-metallicity Mass Function (MF) toward the low-mass end. Since associations are unbound stellar systems, characterized by loose appearance, contamination by the back- or fore-ground stars of the LMC itself can be substantial and thus observations of the field of the galaxy are as important as of the systems themselves. Furthermore, it should be considered that the observed fields should be wide enough to cover the extended regions of these systems. Ground-based observations, with telescopes equipped with Adaptive Optics systems, can provide high spatial resolution, but require a bright star for wave-front sensing and are limited to small fields of view. Space observations with HST, on the other hand, provide the desired resolution with WFPC2 and ACS in a wider field of view. Therefore, HST can be considered as the best available instrument for such studies in the optical.
| Data Set | Target | Exposure Time | R.A. | Decl. | ||
|---|---|---|---|---|---|---|
| (name) | Name | Filter | Band | (s) | (J2000.0) | (J2000.0) |
| U5AY120 | LH 52 | F555W | WFPC2 | 1 10 | 05 25 37.66 | 66 17 02.60 |
| 2 350 | 05 25 37.66 | 66 17 02.60 | ||||
| 2 350 | 05 25 37.72 | 66 17 02.60 | ||||
| F814W | WFPC2 | 1 10 | 05 25 37.66 | 66 17 02.60 | ||
| 2 350 | 05 25 37.66 | 66 17 02.60 | ||||
| 2 350 | 05 25 37.72 | 66 17 02.60 | ||||
| U4WOAC0 | LIST-1 | F300W | Wide | 1 40 | 05 26 10.42 | 67 35 07.50 |
| 1 400 | 05 26 10.42 | 67 35 07.50 | ||||
| F450W | Wide | 1 40 | 05 26 10.42 | 67 35 07.50 | ||
| 1 300 | 05 26 10.42 | 67 35 07.50 | ||||
| F606W | Wide | 1 40 | 05 26 10.42 | 67 35 07.50 | ||
| 1 160 | 05 26 10.42 | 67 35 07.50 | ||||
| F814W | WFPC2 | 1 100 | 05 26 10.42 | 67 35 07.50 | ||
| 1 400 | 05 26 10.42 | 67 35 07.50 |
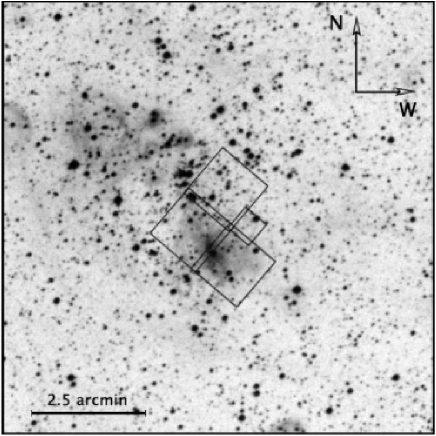
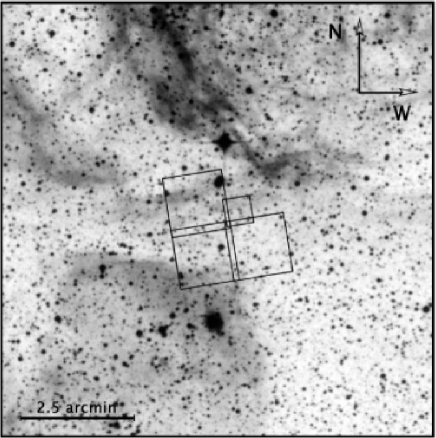
Taking under consideration this argument, we use archived HST/WFPC2 imaging data of two selected fields in the LMC, both on the edges of the super-giant shell LMC 4: The first covers the southwestern part of a typical large association LH 52 (Lucke & Hodge 1970), also known as NGC 1948, and the second, which we will hereon refer to as the “field”, covers the area between the associations LH 54 and LH 55 and can be considered as a typical “empty” general field in the LMC (Fig. 2). This investigation will provide new information on 1) the mass function (MF) of the general LMC field and of an association in this galaxy toward the low-mass end and 2) the faint population of two fields, one of them covering a bona fide non-starburst star-forming region (LH 52). Deep Color-Magnitude Diagrams (CMD) of both regions, and consequently their low-mass MF will be presented, while the field subtracted MF toward the association LH 52 itself will be constructed and studied with high completeness down to the limit of 1 M⊙.
Our main concern in this paper is the study of the MF in the low-metallicity environment of the LMC. Consequently with the investigation that follows we add more information on several related issues: 1) What is the slope of the low-mass end of the MF in this galaxy? 2) Is the MF slope universal through the whole detected mass range? 3) Is the low-mass MF slope different from the MF slope for more massive stars? 4) Is there any specific cut-off in the MF of young stellar systems in the LMC? It is worth noting that while previous studies in the LMC with HST observations concentrated on young star clusters (e.g. Hunter et al. 1997; Fischer et al. 1998; Grebel & Chu 2000; de Grijs et al. 2002; Gouliermis et al. 2004), no information of such kind is available for stellar associations of this galaxy.
The outline of this paper is the following: In the next section (§2) we present our data and we describe the performed photometry. The spatial distribution of the detected stars in each observed field is investigated in §3, while the investigation of the observed populations takes place in §4, where the color-magnitude diagrams are presented. The determination and the study of the MF in both fields is described in §5, where we also present the (field subtracted) MF of the observed part of the association LH 52. The summary of our results and a discussion are presented in §6.
2 Observations and Data Reduction
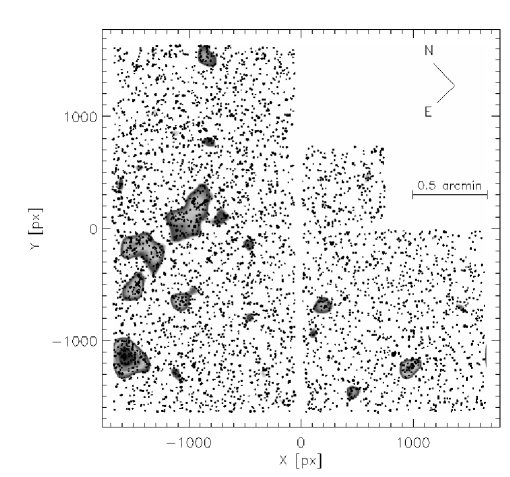
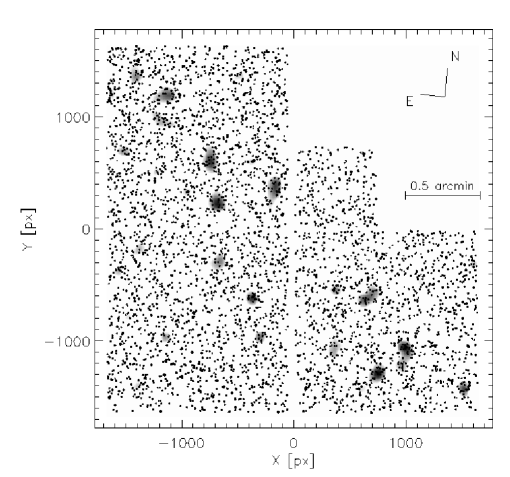
The WFPC2 images on the region of LH 52 were collected as target of the Hubble Space Telescope program GO-8134. One telescope pointing was obtained, with the southern part of the association covered by WF2 and WF3 frames (Fig. 2 - left panel). The exposure times for the two filters used F555W () and F814W () are given in Table 1, together with other details of the observations. The data obtained for the “field” covers a larger collection of bands: F300W (), F450W (), F606W () and F814W (). Details for these observations are also given in Table 1. This area was observed as target of the Hubble Space Telescope program GO-8059. Both the WFPC2 fields, overlayed on SuperCOSMOS Sky Survey images of the general areas, are shown in Fig. 2.
The photometry has been performed using the package HSTphot as developed by Dolphin (2000a). We used the subroutine coadd for adding medium-exposure images (e.g. 2 of 350 sec in each filter in the case of LH 52) to create deep ones. For LH 52 the three sets of exposure times (10, 350, 700 sec) allow us to cover the high dynamic range of brightness of the stars in the region with good overlap between sets, though we were not able to detect the brightest ones due to saturation. We recovered these stars with the use of previous ground-based observations, as it will be shown later. The fewer exposures used for the “field” did not allow us to create images as deep as for LH 52, and thus the corresponding stellar sample has a brighter detection limit. The most recent version of the HSTphot package (version 1.1.5b; May 2003) has been used, which allows the simultaneous photometry of a set of images obtained by multiple exposures. HSTphot is tailored to handle the undersampled nature of the point-spread function (PSF) in WFPC2 images and uses a self-consistent treatment of the charge transfer efficiency (CTE) and zero-point photometric calibrations (Dolphin 2000b).


Following Dolphin (2000a) we used the subroutine mask to take advantage of the accompanying data quality images by removing bad columns and pixels, charge traps and saturated pixels. The same procedure is also able to properly solve the problem of the vignetted regions at the border of the chips. The subroutine crmask was used for the removal of cosmic rays. One of the advantages of HSTphot is that it allows the use of PSFs which are computed directly to reproduce the shape details of star images as obtained in the different regions of WFPC2. For this reason, we adopt the PSF fitting option in the HSTphot routine, rather than use aperture photometry. The HSTphot photometry routine, hstphot, returns various data quality parameters for each detected source, which can be used for the removal of spurious objects. The most useful of them is the object type, which we used for a first selection of the best detected stars. According to the recipe outlined in “HSTphot User’s Guide”, a good, clean star in an uncrowded field should have a goodness-of-fit parameter () of up to 2.5. We used this limit for our selection. An additional parameter provided by the HSTphot photometry is the sharpness of each detected object. Reasonable sharpness values for a good star in an uncrowded field are between and .
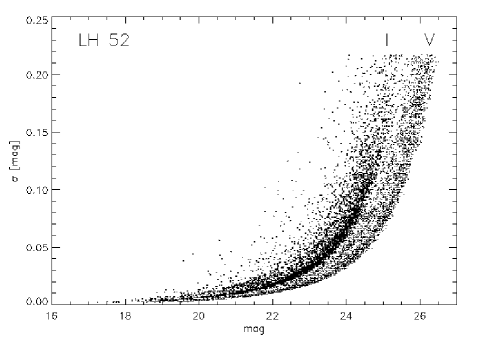
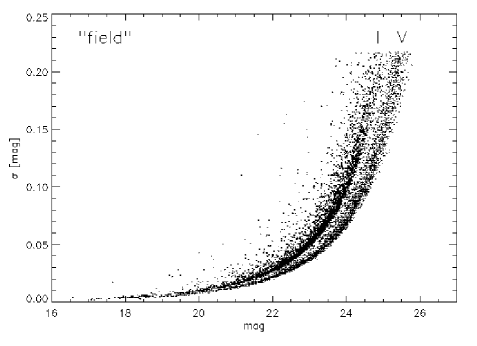
CTE corrections and calibrations to the standard system were obtained directly by HSTphot (Dolphin 2000b). Fig. 3 shows typical uncertainties of photometry as a function of the magnitude for the two filters, as obtained from the deep-exposure frames. Artificial star experiments were performed to evaluate the completeness. The HSTPhot utility hstfake was used for the creation of simulated images by distributing artificial stars of known positions and magnitudes. This utility allows the distribution of stars with similar colors and magnitudes as in the real CMD. The resulting completeness functions are shown in Fig. 4 for the two selected filters.
3 Topology of the observed fields
The HST/WFPC2 field on LH 52 covers the southwestern part of the association and it is almost entirely within its boundary as it was defined by Lucke (1972). The boundaries of a stellar concentration can be defined in a straightforward manner by performing star counts in a quadrilateral grid of the stars detected in the area. This technique depends on the size of the covered area, the stellar number statistics and the selected size of the grid elements, within which stars will be counted (e.g. Gouliermis et al. 2000). We applied this technique on our data in order to establish the limits of the stellar concentrations in both observed WFPC2 fields. We show the star-count images overlayed on the stellar charts of the HST observations in Fig. 5. In the case of the field on LH 52 we did not use the few stars of the Red Clump (see CMD in Fig. 6), since we are mostly interested in the distribution of the main-sequence stars. Eventually, the lower MS population of the CMD can not be distinguished between stellar members of the association and the field. The star counts on the whole stellar sample of the field on LH 52 did not show a unique coherent stellar concentration, as expected for a single stellar system (Fig. 5 - left). This is probably due to the use of local statistics in a relatively small field such as the one of WFPC2, but it could also indicate sub-clustering through fragmentation of the parental molecular cloud. In any case, with star counts we observe the statistically significant local density peaks, which belong to the main body of the association. Specifically, the isodensity map of LH 52 shows that the eastern part of the observed field is denser populated and large stellar sub-groups, which belong to the association, are revealed in this region. This sub-clustering is a phenomenon common among associations and aggregates in the LMC (Gouliermis et al. 2000).
The clumpy behavior of the area is also detected by star counts on stellar samples selected according to their brightness. We divided the stellar catalog of the area arbitrarily into three groups of stars according to their magnitudes in . The groups are defined as bright for stars with 20 mag, intermediate for those with 20 mag 23 mag and faint for the ones with 23 mag. It was found that in some cases the stars, which belong to different brightness groups have different spatial distributions. Specifically, five cases were identified, where clumps of bright stars are located in areas surrounded by regions with overdensities of faint stars, meaning that the observed clumps could represent bright newly formed subclusters. On the other hand, the noted groupings could also be apparent ones due to the lower completeness of faint stars in the areas, where bright stars are located, but this does not seem to be the case. We checked if the change in spatial distribution for the bright clumps happens mostly close to the 50% completeness limit ( mag), or at lower levels. We found that in most of the cases there are larger numbers of stars with magnitudes of completeness lower than 50% than with higher within the boundaries of the bright clumps. This suggests that the observed segregation between bright and faint stars at the locations of the bright clumps should not be considered due to incompleteness alone. The western part of the field on LH 52 is rather empty and it could serve as a representative field for the local background field of the LMC, due to its emptiness. Still, there are two factors not allowing us to use it as such: 1) The fact that the whole field is confined by the boundary of the association and 2) the argument that the observed emptiness is due to the use of local statistics within the small field of view, which covers an area of the association itself, and not due to the lack of statistically significant stellar numbers. Consequently, a more careful treatment should be considered for the use of a general background field of the LMC. As such serves the second observed area, which we call the “field”.
As shown in Fig. 5 (right), star counts on the “field” did not reveal any specific stellar concentration, except of few compact clumps, which are too small to be considered as significant. Since the area observed in this pointing is fairly small and not very close to the area of LH 52, there is the issue of how well the “field” represents the general LMC field at the location of LH 52, which should be addressed. The choice of the “field” for characterizing the general background field of the LMC is supported by the CMD of the area, which is shown in the next section (Fig. 6). There are several previous investigations on the LMC field observed with HST/WFPC2, and their results are consistent concerning the star formation history of the galaxy. In order to check if the use of the “field”, as a representative LMC field is reasonable we compare our results with the ones of these studies. A field at the outer disk of the LMC was observed by Gallagher et al. (1996), while Elson, Gilmore & Santiago (1997) observed a field in the inner disk of the galaxy. Three fields were studied by Geha et al. (1998) and seven, more recently, by Castro et al. (2001), all of them located at the outer disk. The most recent investigation is by Smecker-Hane et al. (2002), who studied a field at the center of the LMC bar and another in the inner disk.
Though these investigations cover a sample of 14 WFPC2 fields, which are spread in a large area of the LMC (from the center of the bar to the edge of the outer disk), their color-magnitude diagrams are very similar to each other and to the CMD of our “field”. Specifically, a prominent red-giant clump at 1 mag and 19 mag, which characterize these CMDs is also visible in the CMD of the “field”. In addition, there is a lack of main-sequence stars brighter than 18 mag in all fields. This is not completely due to saturation, since the LMC field is known to have few massive MS stars per unit area (Massey et al. 1995). The similarity of the CMDs of all these WFPC2 fields suggests that the general LMC field does not seem to change significantly from one area to the other. Consequently, the CMD of the “field” may be used as representative of the LMC general field population. Still, there are variations in the number of stars observed in each field. These variations are due to a gradient in the number of stars in the LMC field, with higher numbers towards the center of the galaxy. Specifically, each of the pointings observed by Smecker-Hane et al. (2002) in the bar and the inner disk of the galaxy (17 southwest of the center of the LMC) covers stars, in line with 15,800 stars observed by Elson, Gilmore & Santiago (1997) also in the inner disk. On the other hand Castro et al. (2001) report that each of their fields at the outer disk contain, typically, 2,000 stars in agreement with the number of detected stars by Gallagher et al. (1996) in their field also in the outer disk. The number of observed stars in the “field” ( 4,000) is in line with these variations, since this field is not located close to the bar, and still it is much closer to it than all the fields observed in the outer disk. Furthermore, this field is the closest available to the area of LH 52, and thus it is the most appropriate to be used as representative of the local LMC field. The facts presented above give confidence that the choice of the “field” as a representative of the general background LMC population, observed at the location of LH 52, is reasonable.
4 Color-Magnitude Diagrams
4.1 The area of LH 52 (NGC 1948)
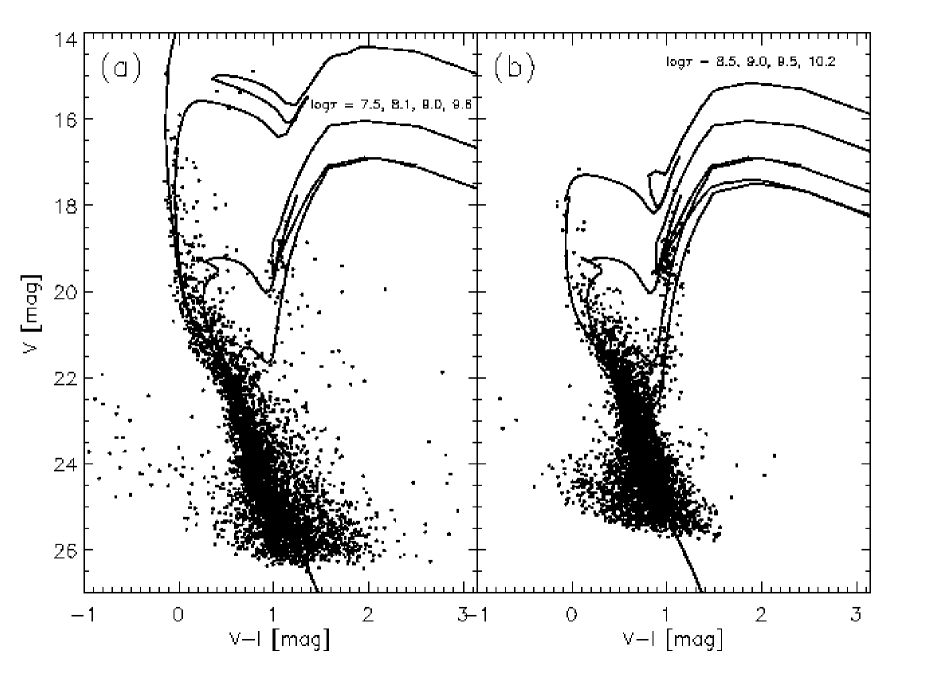
The vs. Color-Magnitude diagram (CMD) of the WFPC2 field on LH 52, which includes 4,050 stars is shown in Fig. 6. Hill et al. (1995; from hereon HCB95) observed a field including the associations LH 52 and LH 53 in the LMC with the Ultraviolet Imaging Telescope (UIT) in the 162 nm bandpass. They also observed two fields covering the associations from Cerro Tololo Inter-American Observatory (CTIO) with the 0.9 m telescope in and . From the 1048 stars detected by these authors within the boundary of LH 52, 218 are included in our HST/WFPC2 field, 28 of which were also detected in the far-UV. HCB95, using 421 stars with 14.8 mag 18.6 mag and 0.20 mag 0.15 mag, found an average reddening for LH 52 of 0.15 with a 1 scatter of 0.14 among the individual stars. Isochrone fitting on our CMD showed that the reddening should be considered to be very low between 0.05 and 0.1 (Fig. 6). We adopted a distance modulus for the LMC of 18.5 0.1 mag, derived by Panagia et al. (1991) from SN 1987A. This corresponds to a distance to the LMC of 50.1 3.1 kpc. At this distance 1′ 14.6 pc. Considering that this is a star-forming region, the presence of differential reddening in the area should also be considered.
The comparison of the CMD of the stars detected by HCB95 within the boundaries of our WFPC2 field with the one presented here for LH 52 exemplifies the gain that has been introduced to crowded stellar photometry toward LMC with HST. The WFPC2 data, which were taken eight years later than the ones from CTIO reach a detection limit almost 5 magnitudes deeper. The five brightest of the stars, detected by HCB95 with UIT to have far-UV emission, are main-sequence stars with 13 15.5 mag and 0.2 0.2. They could not be detected in our observations, due to saturation. These stars show in a direct manner that the stellar content of this field is very young, possibly still forming stars. Isochrone fitting on this CMD can only provide an age limit which coincides with the younger available models of 4 Myr. Consequently one may suggest that the stellar content of the area is that young. In Fig. 6 (left panel) the CMD of the area is plotted with representative isochrone models of older ages.
4.2 The area of the “field”
The WFPC2 field on LH 52 includes, as it would be expected, also stars of the general LMC background field, which can be detected in the CMD of Fig. 6 (left panel) mostly by the few members of the sub-giant branch located around 20 mag and 1 mag. The fact that this part of the CMD has only few members suggests that the contribution of the LMC field in the CMD at these magnitudes of the association is small. Still, there is a large number of low-mass MS stars in the field which is expected to contaminate the lower MS of the CMD in the area of LH 52. In order to quantify this contribution we study the second HST/WFPC2 field, the “field”, which is located on the “empty” area almost 1∘ south of LH 52 (see Figs. 1, 2).
The constructed vs. Color-Magnitude diagram of the “field” is shown in Fig. 6 (right panel). The “field” includes 4,155 stars detected in both and . The comparison between the two fields does not call for area normalization of the star numbers, since both cover equal surfaces. One should consider that differences in stellar numbers between the two fields should be expected due to a gradient in the LMC field star density, which is higher closer to the Bar. Indeed, the sub-giant branch of the “field” is very well defined and richer than the one in the CMD of the area of LH 52, in which the field contamination is very small for 18.5 mag. The “field”, on the other hand, is characterized by lack of upper main-sequence stars, which has been previously verified for the general LMC field by other investigators (see §3). As far as the lower main-sequence concerns both CMDs are comparable, except the fact that in the area of LH 52 there are a lot of reddened low-mass stars, which do not seem to exist in the area of the “field”. This spread of colors toward the red cannot be accounted for by photometric errors alone. One cannot exclude the possibility of the existence of pre-main sequence stars forming this reddened sequence. In the case of the area of SN 1987A, it was found that such a sequence can be traced very well in the CMD with PMS models (Panagia et al. 2000). Differential reddening should also be considered as important possibility. In the CMDs of Fig. 6 is shown that the number of field stars significantly increases towards fainter magnitudes, and thus the field contamination in the area of LH 52 directly affects the mass function of the lower part of the main sequence. In addition, according to the tabulation by Ratnatunga & Bahcall (1985), we expect negligible contamination by Galactic foreground stars in the main sequence of both CMDs. Furthermore, according to the work of Metcalfe et al. (2001) on the Hubble Deep Fields, the number of background faint galaxies that may affect the mass functions is expected to be smaller than the reported uncertainties () in each mass bin for stars brighter than V 25 mag.
The reddening toward the area of the “field” was estimated with the use of the available multi-band observations, by constructing the 2-Color Diagram of this area. We find that the region is characterized by an absorption of 1 mag. The corresponding reddening depends on the applied reddening curve . Starting with Olson (1975) and Turner (1976), many studies have been made to establish an accurate value of the ratio of the total absorption in , , to the color excess, : . A generally accepted value is (Koornneef 1983). This value is comparable with that found by Mihalas & Binney (1981: ) and by Leitherer & Wolf (1984), who found a similar empirical reddening curve (). We adopt the value (e.g. Taylor 1986). Consequently the corresponding reddening toward the region of the “field” is found to be 0.3. Isochrone fitting on the CMD (Fig. 6), though, gave a smaller color excess, comparable to the one toward LH 52, as it was also found from isochrone fitting.
In order to estimate the field contamination in the area of LH 52 we rescale the number of stars per magnitude bin in the “field”, so that we can evaluate the number of LMC field stars that have to be subtracted in each bin of the mass function derived from the original CMD of LH 52. In order to normalize the stellar numbers per bin in the “field” to the corresponding numbers in the field covered by the area of LH 52, we compare the numbers of stars in several magnitude ranges for faint main-sequence stars in both CMDs. The most complete stellar sample (completeness 50%) was selected, and the compared numbers are corrected for incompleteness. We found that the contribution of the LMC field to the CMD of LH 52 varies from 40% up to 90% of the background field population observed in the “field”. Specifically, the mean ratio of the number of faint main-sequence stars in the “field” over the one in the area of LH 52 is , taking into account the uncertainties due to number counts. This ratio will be taken under consideration later for the appropriate normalization of the numbers of stars per mass bin in the MF of the “field”, which will be used for the subtraction of the background field from the MF of the area of LH 52. It is worth noting that, since the sub-giant branch seen in both the CMD of the “ field and the one of LH 52 characterize mostly the background population, we made the same comparison for the numbers of stars in the sub-giant branch. We found that the ratio of the number of these stars in the “field” over the one in the area of LH 52 is , comparable to the one given above. In summary, the MF presented in the following section has been corrected for completeness and contamination by LMC field stars. We have investigated possible contamination by galactic field stars and faint galaxies, and in both cases found their contributions to be negligible.
4.3 Stellar populations in the observed fields
Previous HST studies on the population of the LMC field have investigated the star formation history of the galaxy. Consequently, our results of the study of the “field” may complement the previous ones. Gallagher et al. (1996) used WFPC2 to observe a patch of the outer disk of the LMC. They constructed the - and -equivalents CMD for more than 2,000 stars down to 25 mag and they used stellar population models to constrain the star formation history within the past 3 Gyr. The distribution of sub-giant stars indicate that a pronounced peak in the star formation rate occurred in this region about 2 Gyr ago. If lower main-sequence stars in the LMC have moderate metallicities, then the age for most LMC disk stars is less than about 8 Gyr. Elson, Gilmore & Santiago (1997) presented HST/WFPC2 photometry, which extends down to 25 mag, for a region in the inner disk of the LMC and they confirmed the previous result indicating that an intense star formation event in the disk of the galaxy occurred a few times 109 yrs ago. A more recent study by Castro et al. (2001) focused on seven fields 5∘ away from the LMC center, observed also in - and -equivalents with WFPC2. Their deep photometry ( 26 mag) and the use of isochrones showed that an old population ( 10 Gyr) exists in all fields. These authors verified the presence of enhanced star formation, which took place 2 to 4 Gyr ago, in the fields localized in the north to north-west regions. The CMD of the “field” shows indications that verify these results. In Fig. 6 (right panel) we present this CMD with four indicative isochrone models overplotted. The models of the Padova group in the HST/WFPC2 magnitude system (Girardi et al. 2002) were used. From the isochrone fits in Fig. 6 is indeed shown that this field is characterized by a significant star formation event that took place 1 - 3 Gyr ago. In addition, the sub-giant region of the CMD is very well traced by models of older age ( 15 Gyr).
The CMD of LH 52 area gives the impression that this is an area of mixed populations. This is expected since the field on LH 52 would not only include a star-forming association, but also a contribution of the general LMC field. There are several facts, which favor the conclusion that the observed part of the association LH 52, which is covered by our first WFPC2 field, is a star-forming region. It is related to a HII region named DEM L 189a (Davies, Elliot & Meaburn 1976) or N 48B (Henize 1956), which seems to coincide with the small diffuse nebula seen in Fig. 2 (left) on the limit between WF3 and WF4 frames of the WFPC2. From the observations presented here, it can be seen that this nebula is possibly excited by one single bright star, on which it is centered. The general area of the association is characterized by several bright nebulae. Will et al. (1996) performed UV and optical spectroscopy on bright blue stars located in this area and they derived an age of 5 - 10 Myr. They classified seven stars as B-type and they found three O stars. All of those stars are located outside our WFPC2 field, with the O-stars being far away. One X-ray source was identified by ROSAT in the area covered by our WFPC2 field, which is also characterized by the presence of one MSX (8 m) and an IRAS source. Furthermore, a CO over-density found with NANTEN (Yamagughi et al. 2001) located to the northwest of our field. Hence, taking under consideration also the existence of OB stars found by Will et al. (1996) and of bright upper MS UV-emitters detected by HCB95, one can conclude that possibly the whole area of LH 52, and consequently the observed region, is in fact a location, where star formation is taking place. Under these circumstances one cannot exclude the possibility of the existence of pre-main sequence (PMS) stars in our CMD, since the reddening toward this region is low, so that faint and cool objects could be easily detected in the optical.
Several studies in our galaxy have revealed PMS populations in the regions of stellar associations. Specifically, Massey, Johnson & Degioia-Eastwood (1995) argue that the regions of the OB associations of the Galaxy show evidence of PMS stars with masses between 5 - 10 M⊙ and ages 1 Myr, while 95 low-mass PMS stars with an age of 5 Myr were discovered in the Upper Scorpius OB association by Preibisch & Zinnecker (1999). The young stellar content of the galactic starburst NGC 3603 has been investigated with ground-based NIR observations by Brandl et al. (1999) and more recently Stolte et al. (2004) who detected PMS stars with masses down to 0.1 M⊙ and an age in the core region of NGC 3603 between 0.3 - 1 Myr. Similar studies in the LMC concentrated on the starburst region of 30 Doradus. Brandl et al. (1996) performed adaptive optics NIR observations of the central region of 30 Doradus (R 136) and they detected 108 “extremely red sources”, which are most likely PMS stars of low or intermediate mass. A red population with masses down to 1.35 M⊙, well traced by PMS isochrones, was also discovered in the CMD of R 136 by Sirianni et al. (2000) with the use of HST/WFPC2 data, though no variable extinction was taken into account (Andersen 2004). In addition, Brandner et al. (2001) observed 30 Doradus with HST/NICMOS and they found no evidence for a lower mass cutoff for pre-main sequence stars in the area. Concerning the LMC field, Panagia et al. (2000) have identified several hundreds pre-main-sequence stars through their H emission in the field around Supernova 1987A and they found that most of them have masses in the range 1 - 2 M⊙ and ages between 1 - 2 and 20 Myr. These authors suggest that some star formation is still ongoing in this field.
Similar investigations on stellar associations in the LMC are still lacking. The low reddening toward their regions and the small crowding in their areas imply that LMC associations should be considered among the best tracers of extra-galactic PMS populations. We used the grid of bolometric corrections presented by Keller, Bessell & Da Costa (2000) for populations in the LMC to construct the H-R diagrams (HRD) of the general stellar populations found in both WFPC2 fields presented here. It is interesting to note that in the diagram of the LH 52 area we could trace faint red sources with PMS isochrone models for 2.5 - 20 Myr from Siess et al. (2000). Still, this cannot be considered as a detection of PMS stars in regions of associations. Since PMS stars occupy a different place in the NIR CMD than MS stars, they are expected to be easily distinguishable in LMC associations from their background field. Hence, high-resolution NIR observations toward such regions are needed for the definite detection of PMS stars and the construction of their MF. Consequently for the construction of the optical MF here, we treat all the detected faint stars in both fields as evolved MS stars.
5 Mass Functions of the System and of the Field
5.1 Construction of the IMF
The distribution of stellar masses formed in a given volume of space in a stellar system is known as the Present Day Mass Function (PDMF) of the system. The Initial Mass Function (IMF) of the system can then be constructed, assuming that all stars were born simultaneously, after disentangling the evolutionary effects of the stars. There are various parameterizations of the IMF (see e.g. Kroupa 2002). A commonly used parameterization is the one proposed by Scalo (1986), where the IMF is characterized by the logarithmic derivative , called index:
Here is the IMF and is its slope. It can be derived from the linear relation of and . Reference value for the IMF slope is index as found by Salpeter (1955) for the solar neighborhood (, for a mass range 0.4 /M⊙ 10). For measuring this quantity for a single stellar system one can assume that all stars in the system are the product of star formation, which spans over time-scales of few Myrs. This is more or less true, especially for young systems like stellar associations. Thus, assuming that all stars in an association were born within the last 10 Myr (which should be the case for LH 52) one can refer to the system’s MF as its IMF.
The MF of a stellar system is constructed by counting stars in mass intervals. This can be achieved by two methods: (1) By translating their luminosities into masses using mass-luminosity relations (e.g. de Grijs et al. 2002) and then constructing the distribution of the derived masses and (2) by directly counting stars between evolutionary tracks according to their positions in the HRD (e.g. Massey et al. 1995). It is almost certain that the second method is more straightforward, because no transformation of luminosities to masses is required, while for the first method there is a definite dependence on the isochrone models used for the transformation of luminosities to masses. Still, this dependence results only to a systematic offset of the overall masses in comparison to the second method (de Grijs et al. 2002). Gouliermis et al. (2004) presented their results on the mass segregation effect in four Magellanic Clouds clusters and their mass functions and they argue that there is also a dependence on the theoretical models for the second method. These authors compared the MF slopes derived with both methods for their clusters and they found that in general both counting methods seem equally adequate for the construction of the MF giving comparable results (their figure 7).
We verified this result by constructing the MF of the LH 52 area with both methods. For the first method the MF was determined adopting a mass-luminosity relation derived from theoretical evolutionary models. We used the latest Padova theoretical isochrones in the HST/WFPC2 STmag system (Girardi et al. 2002). These models were originally developed by Girardi et al. (2000) and they were transformed to the HST/WFPC2 pass-bands as described in Salasnich et al. (2000). For the second method, transformation of our measured colors and magnitudes into temperatures and luminosities was made through interpolation into a grid of synthetically derived colors and bolometric corrections presented by Keller, Bessell & Da Costa (2000). Preliminary results on the second method have been already presented by Gouliermis, Brandner & Henning (2004). The evolutionary tracks presented by Schaerer et al. (1993) were used for counting stars in the HRD. An excellent agreement on the main sequence between these tracks from Geneva and earlier isochrones from Padova (Fagotto et al. 1994) has been found. In all models the LMC metallicity (Z=0.008) was taken into account. The counted stellar numbers were corrected for incompleteness and were normalized to a surface of 1 kpc2 for both methods. We computed the slope of the MF constructed with each method and we found that it does not differ considerably, being the same within the errors, for the same mass ranges. This coincidence gives confidence that the use of only one method for constructing the IMF will be sufficient.

5.2 The Mass Function of the observed fields
We derived the MF of the MS stars in the LH 52 area and the “field”, by selecting them from the corresponding stellar samples and using the mass-luminosity relation provided by the theoretical models of Girardi et al. (2002) for the determination of their initial masses. The stars were counted in logarithmic (base ten) mass intervals. The counted numbers were corrected for incompleteness and normalized to a surface of 1 kpc2. The MF of both areas is given in Fig. 7. The errors reflect the Poisson statistics of the counting process and they are suitably corrected and normalized. In this figure it is shown that the MF slope toward the low-mass end seems to be different from the one toward the intermediate-mass range, with the MF being steeper toward the lower masses. The limit of M⊙ may be considered as a reasonable threshold separating the two mass ranges having different slopes. This phenomenon of different MF slopes between mass ranges with 2 M⊙ and 2 M⊙ is more prominent in the case of LH 52 area, while the MF of the “field”, as seen in Fig. 7, could be considered as a single slope distribution. Considering that each observed area represents a region of different context in the LMC (the first being a star-forming region and the second an empty field), these results support the suggestion of a top heavy MF for typical star-forming regions in the LMC.
One may consider that, with the use of a mass-luminosity relation for the construction of the MF, uncertainties may occur if there is an age distribution among the stars in the areas of interest. Then the use of a single isochrone may not be adequate for a mass-luminosity conversion. We tested this argument by constructing the MF of both fields with the use of two different indicative isochrones, representative of the MS populations observed in the fields (for 6.6 and 7.8). The first choice is based on the fact that the area of LH 52 includes a very young population, as shown in the CMDs of Fig. 6, while the second is taken as the younger limit of the older population observed in both the CMDs of Fig. 6, taking into account the fact that the transformation of luminosities to masses does not differ at all with the use of older models for main-sequence stars. The constructed MF is shown in Fig. 8. As shown earlier, a single-age scenario for both regions is not justified. Still, the use of a single model is a simplification justified by the fact that the correspondence of luminosities to masses is not age sensitive for the main sequence, especially for the fainter stars. Indeed, we found that for the low-mass stars the slopes of the MF are almost identical for both models, while for the intermediate-mass stars ( 2 M⊙) they are very close to each other, within their uncertainties. In Figs. 7 and 8 the arrows indicate the 50% completeness limits for each sample.
Taking under consideration that the two areas were observed within different programs they do not have the same exposure times in the common bands and thus, as shown earlier, their completeness functions are different. Consequently for the comparison of the MF slopes we cannot use the whole mass range for the LH 52 area, which has better completeness. This is also applicable to the field subtraction described later. The MF of the LH 52 area was constructed for masses down to 0.6 M⊙ and it is complete (50% completeness) down to the limit of 0.7 M⊙, while the area of the “field” reaches the 50% completeness limit at 0.9 M⊙. We present the MF slopes of the areas for the mass ranges with 2 M⊙ (low-mass range) and 2 M⊙ (intermediate-mass range) in Table 2. In this table we also present the slopes as they are found for the whole of the complete mass range of each sample and we give the estimated slopes of the MF, as it is constructed with the use of the mass-luminosity relations derived from both isochrone models.

From the values of Table 2 it can be seen that the MF of the “field” is systematically steeper than the one of the LH 52 area for the same mass ranges. This finding is in line with the results by Massey and collaborators (see e.g. Massey 1990; 1993), who found that the MF slope of the massive stars in the general LMC field is steeper than the slope of the OB associations. It was also found to be comparable to the one of our Galaxy. The slopes given in Table 2 are comparable to the PDMF slopes derived for the Galactic field by Chabrier (2003) for 1 M⊙ (his table 1). Chabrier (2003) has also found a trend of the MF slope to become shallower for higher-mass ranges in line with our results. The fact that the general LMC field, which is represented by our “field” has indeed a steeper MF slope than the one of the LH 52 field is possibly connected to the fact that the latter includes an association. This difference in the MF slope between the LH 52 area and the “field” is verified for every selected mass range shown in Table 2. A reasonable explanation is the fact that the “field” seems to cover a large number of low-mass stars, while the area of LH 52 has a definite larger number of more massive MS stars, as it is discussed earlier for the CMDs of the fields. Indeed, as it is shown in Figs. 7 and 8 the low-mass range of the MF up to about 1.25 M⊙ is covered mostly by the “field”, while the LH 52 area has more highly populated bins of larger masses, which leads to a top-heavy MF as discussed earlier.
A general conclusion based on the slopes in Table 2 is that in all cases, except for the intermediate-mass range in the LH 52 area, the MF does not follow the Salpeter law, but being steeper. Massey et al. (1995) found that the slope of the IMF of the LMC field stars is very steep, , for stars with masses 2 M⊙. This slope is in very good agreement with “field” for its whole mass range ( 1 - 7 M⊙). If we assume that there is no change of the MF slope at masses around 2 M⊙, this slope for the LMC field stars stays unchanged down to 1 M⊙. On the other hand assuming that indeed the MF slope changes at 2 M⊙, then we see that the MF of the LMC general field is very steep at the low-mass range, it becomes more shallow (close to the Salpeter’s) at the intermediate-mass range, and becomes steep again for the massive stars. Our results seem to favor this scheme. It should be noted that, as seen from the slopes of Table 2, the intermediate-mass range MF slope for the LH 52 area coincides with Salpeter’s value, for all three selected mass ranges and for both mass-luminosity relations.
So far we use the term “Mass Function” to describe the observed distribution of stellar masses in both WFPC2 fields. The reason is that the general LMC field, which dominates both regions, is found to include stars old enough for intermediate-mass stars to have evolved from the main sequence. On the contrary, the lower-mass main-sequence stars, which we detect in our CMDs are expected to remain in their initial positions until today. Under these circumstances the constructed mass distributions for both areas represent their PDMF for their entire mass range, while for the low-mass stars we can refer to it as the IMF.
| Mass Range | LH 52 area | “field” | ||
|---|---|---|---|---|
| (M⊙) | ||||
| Small Masses | ||||
| 0.7 - 2.0 | 4.35 0.15 | 4.37 0.16 | - | - |
| 0.9 - 2.0 | 4.51 0.20 | 4.53 0.22 | 6.57 0.40 | 5.54 0.21 |
| Intermediate Masses | ||||
| 2.0 - 6.0 | 1.24 0.46 | 1.50 0.24 | 2.03 0.28 | 2.27 0.31 |
| 2.0 - 7.0 | 1.11 0.37 | - | 2.08 0.20 | - |
| 2.0 - 9.0 | 1.16 0.26 | - | - | - |
| Whole Mass Range | ||||
| 0.7 - 6.0 | 2.48 0.23 | 2.54 0.18 | - | - |
| 0.9 - 6.0 | 2.20 0.24 | 2.33 0.20 | 3.66 0.35 | 3.69 0.23 |
| 0.7 - 7.0 | 2.31 0.22 | - | - | - |
| 0.9 - 7.0 | 2.03 0.23 | - | 3.39 0.31 | - |
| 0.7 - 9.0 | 2.11 0.19 | - | - | - |
| 0.9 - 9.0 | 1.87 0.18 | - | - | - |
5.3 The Initial Mass Function of the Association LH 52
The MF of the LH 52 area is affected by the presence of the stellar population of the general field of the galaxy. This was shown earlier in the CMD of the area, where an underpopulated sub-giant branch, which seems to be mixed with the population belonging to the association, points to a contribution from the general LMC field. In order to disentangle this contribution and to construct the MF of the stellar system in the LH 52 area (the association itself) we use the observations of the “field”, which we treat as a representative sample of the general LMC field. Thus, we subtract the contributing number of “field” stars per mass bin from the corresponding in the LH 52 area. The remaining numbers are used for the construction of the MF of the association. Specifically, the number of low-mass main-sequence stars in different mass ranges (taking completeness into account) of both CMDs is being used to normalize the MF of the “field” to the expected distribution if the LH 52 area would contain only the field population. The derived completeness corrected, field subtracted MF of the association LH 52 is shown in Fig. 9. Since the system is found to be very young this MF is actually the IMF (see also §5.1) of the southwestern part of the association LH 52, which is covered by the first HST/WFPC2 field presented here. In Fig. 9 we plot the IMF, as it is constructed after the field subtraction, assuming three different ratios of the number of faint main-sequence stars in the “field” over the area on LH 52 for the estimation of the contribution of the general LMC field.
Field subtraction is one of the major uncertainties in the determination of the MF of a stellar system. In §4.2 we note that the mean percentage of the stars detected in the “field” that has to be used for the field subtraction is 58% ( 7%). We performed this subtraction considering the two extremes of the expected range of the field contribution (37% and 91% of the stars in the “field”) in order to estimate the uncertainty in the slope of the IMF of LH 52 due to this subtraction. The corresponding IMFs have been overplotted with different symbols in Fig. 9, and their slopes derived from the corresponding linear fits, are given. All linear fits applied for the evaluation of the IMF slope are not weighted. It should be noted that, as shown in Fig. 9, larger percentage of the contribution of the field to the IMF of the association leads to fewer low-mass bins. This is a reasonable result, since, as shown earlier, the low-mass population in both observed fields seems to belong mostly to the general background field. The field subtraction is valid for masses larger than 0.9 M⊙, since this is the mass limit, where the stellar sample of the “field” is complete (50% completeness). Consequently we are able to estimate the IMF slope of the system for masses 1 M⊙ (or larger, depending on the assumption for the the field subtraction).

The derived slope of the association was found to be comparable to a Salpeter IMF, but with a trend to be shallower, depending on the assumed field contribution. Specifically its value is found to lay between the limits of 0.90 and 1.37 (Fig. 9), which result in a IMF slope for LH 52 for the mass range given above. This slope is in line with the average value of the IMF slopes of the associations in the Milky Way (), but somewhat more shallow than the one of the Magellanic Clouds (), found by Massey, Johnson & Degioia-Eastwood (1995) for stars with masses 7 M⊙. It is also in agreement with the global Galactic disk IMF slope as derived by Chabrier (2003) for 1 M⊙. These facts suggest that the IMF of stellar associations has more or less the same slope for intermediate- and high-mass stars. From Fig. 9 it can be seen that, after the field subtraction, the IMF slope seems to be constant through the whole mass range and does not change significantly for different mass ranges. However we estimated the IMF slope of the association for the two mass ranges separated by the limit of 2 M⊙, for reasons of comparison with the results in the observed fields. We found that if the mean contribution by the field is assumed ( 58%) then the IMF slope for the low- ( 1 - 2 M⊙) and for the intermediate-mass range ( 2 - 7 M⊙) remains unchanged with a value between 1.07 and 1.08. On the other hand, if a modest contribution by the field is assumed ( 37%), then the low-mass IMF has a steep slope of , much different from the one for the intermediate-mass range, which was found . If a high contribution by the field is assumed ( 91%), then we can only estimate the IMF slope for the intermediate-mass range (M 2 M⊙), which is the one given in Fig. 9 (). From these values one can conclude that the stars with masses larger than 2 M⊙ determine the total IMF slope of the association. This is in line with our results so far, which imply that the general LMC field is responsible for the low-mass population observed in both fields, while the MF of the LH 52 area is mostly affected by the existence of more massive stars, members of the association. Under these circumstances there are clear indications that the IMF of a star forming stellar association in the LMC is a “top-heavy” IMF, due to its intermediate-mass stellar members, but the uncertainties are too large for this to be a definite conclusion.
6 Summary and Discussion
In this paper we studied the MF, using HST/WFPC2 observations, of two stellar fields located on the boundary of the super-shell LMC 4, which is surrounded by a large number of star-forming stellar associations. The first field targets the southwestern part of the known large association LH 52, which resides (with LH 53) on the border of LMC 4 with the shell LMC 5 (Fig. 1). The second field is located in the empty area between two smaller associations (LH 54 and LH 55) towards the south of LMC 4 (we refer to it as the “field”) and it accounts for the general background field of the LMC, which deserves an equally thorough investigation. Both areas are populated by a large number of faint stars with masses down to the sub-solar regime. The CMD of the LH 52 field, though, reach a much brighter upper MS limit, while for the “field” there is a lack of MS stars brighter than 18 mag. Its brighter population is mostly characterized by a prominent sub-giant branch.
We construct the MF of the stellar populations detected in both fields, taking into account several considerations concerning the sources of uncertainty in the derived slopes. The MF is constructed with two methods for counting stars in mass intervals. For the first we use a mass-luminosity relation for transforming luminosities into masses and for the second we transform colors and magnitudes into temperatures and luminosities, and we count stars between evolutionary tracks according to their positions in the HR-Diagram. We verify, as it was previously found, that both methods give comparable results concerning the slope of the constructed MF. As far as the mass-luminosity relation concerns, we test the possibility that the use of theoretical models of different ages may result in the construction of much different MF, and in consequence may give different results for the corresponding slope. We found that as far as the MS population concerns, there are no significant changes in the slopes of the constructed MF, though the upper mass limit depends on the selected mass-luminosity relation.
The large majority of the observed low-mass stars with 1 2 M⊙ in both fields seems to be a feature of the general field of the LMC. The MF of these stars resembles very well their IMF, since they are not expected to have left the MS, within the life-span of the LMC general field, as it is revealed from the CMD of the “field” (§4.3). The slope of this MF is found to be very steep, between and and systematically much steeper than the one of the intermediate-mass range (2 7 M⊙). This implies that the contribution of the low-mass MS stars to the MF is higher than expected, if it is assumed that the MF follows the same slope for masses smaller than 2 M⊙. The general LMC field has an intermediate-mass MF slope around , which is steeper than the corresponding one of the LH 52 area. The latter is found to be very close to Salpeter’s value with between and (Table 2), comparable to the typical MF slope previously found for the massive stars in associations of the LMC (; Massey et al. 1995). The MF slope for the whole mass range (1 7 M⊙) in both fields falls between the above limits, with the one of the “field” being definitely steeper than the one on the association LH 52.
The slope of the field MF was found previously to be steeper (of the order of to ) than of the stellar associations in the LMC and the Galaxy, for the most massive stars with 7 M⊙ (Massey, Johnson & Degioia-Eastwood 1995). This was verified for stars with smaller masses down to 2 M⊙ more recently by Gouliermis et al. (2002), who investigated photometrically the stellar content and the MF of three stellar associations and their fields located on the edges of LMC 4. These authors found that the MF slope of the association LH 95 for intermediate-mass stars is somewhat steeper than Salpeter’s (1955) with and, indeed, more shallow than in the surrounding general field of LMC (). The latter result is further supported by the larger number statistics of our investigation here. We verify that the MF of the general field of the LMC is steeper than the MF of the area, where a stellar association is located and of the IMF of the association, corrected for the field contribution, also toward lower masses down to 1 M⊙.
We use the MF of the “field” for correcting the field contamination in the observed area of the association LH 52. Thus, we construct the field-subtracted, incompleteness-corrected, main-sequence MF of the southwestern part of the association itself. This MF is actually the IMF of the system, since it is considered to be very young. Its construction was possible for masses down to about 1 M⊙, due to the completeness limitations in the “field”. We find that the slope of the IMF of the association is comparable to, but more shallow than a typical Salpeter IMF. This is due to the large number of more massive stars in the area, which implies that this IMF may be considered as a top-heavy IMF. This result is in agreement with the one by Hill et al. (1994), according to which the shallower slope of the association IMF suggests that not only the star formation rate is higher in associations, but the local conditions favor the formation of higher mass stars. The IMF slope of LH 52 is found here to be for masses M 1 M⊙ (if 37% of the “field” is assumed to contaminate the population of LH 52), for masses M 1.5 M⊙ (assuming that 58% of the “field” population contributes to the area on LH 52), and for a shorter mass range (M 2 M⊙) (if the field contamination of the LH 52 area corresponds to 91% of the stars in the “field”). These values are very close to what previously was found by HCB95 for the same association (, for 3.5 M⊙).
The MF of the intermediate-mass stars observed by Gouliermis et al. (2002) in the area of the association LH 95 (including the contribution of the LMC field) was found with a slope comparable to our results on both observed fields in the same mass range (Table 2). These values agree with the slopes found for 14 associations in the Magellanic Clouds by Hill, Madore & Freedman (1994; for 9 M⊙). The field subtracted IMF of the associations LH 95 and LH 52 themselves, though, are more shallow and in line with the ones presented previously by Massey et al. (1995; ). The latter authors note that the differences in the estimated IMF slopes between their study and the one by Hill et al. is due to the inability of photometry alone (with no spectroscopy) to treat the hottest (and most massive) stars. Here we stress the importance of the field contamination of the IMF of an association, especially toward smaller masses. The difference in the IMF slope due to the field contribution, was already noted by Parker et al. (2001) for the association LH 2. These authors state that “it is possible that even in the case of an universal IMF, the variability of the density of field stars may play an important role in creating the observed differences between calculated IMFs for OB associations”. Our results support this suggestion.
Concerning the universality of the IMF, Hunter (1995) has tabulated IMF slopes and their appropriate stellar mass ranges for stellar systems in the Local Group, showing that the slope of the IMF of stellar associations is lying within the same limits of 1.0 0.1 and 1.7 0.2. The IMF of these studies has been determined for stars more massive than 25 M⊙ only, and for stars with masses larger than 7 M⊙. Hunter et al. (1997) note that no statistically significant variation can be seen among the slopes, but the uncertainties are fairly high. They conclude that for young star clusters and associations the IMF is independent of the galactic characteristics and the mass range and that the star formation process is truly local, independent of the galaxy in which it is located. Sirianni et al. (2000) studied the low-end IMF of R 136 and they found an agreement of their IMF slope with earlier investigations for masses larger that 3 M⊙, but they report that the IMF shows a definite flattening below 2 M⊙. According to these authors, these findings add to the conclusion of Scalo (1998) that, at least for stars less massive than 1 M⊙, the IMF is not uniform. A flattening of the IMF could also be indicated for masses below 1 M⊙ by Sirianni et al. (2002) in HST/WFPC2 observations of the cluster NGC 330 in the SMC. Yet, as these authors state, “since the photometric completeness in that mass range is always less than 50%, one cannot assess the reliability of this intriguing conclusion, which would require deeper photometry”.
Our investigation shows that, as far as the general field of the LMC concerns, the MF slope depends on the mass range, being very steep for stars with masses smaller than 2 M⊙, and very much different for larger masses (Figs. 7 & 8). On the other hand the IMF of the star-forming stellar association, as seen in Fig. 9 after the field subtraction, seems to follow the same slope for the whole observed mass range. So, within the 50% completeness of our data, we did not identify any flattening of the IMF for stars with 2 M⊙. This result clearly suggests that the IMF of a young stellar system in the LMC may be considered to be the same through the whole of its detected mass range. In addition, in our data we could not identify any lower mass cutoff in the IMF for the detected MS stars, in line with the results by Brandner et al. (2001), who found no evidence for a lower mass cutoff in the IMF for pre-main sequence stars in the vicinity of 30 Doradus in the LMC.
Some final remarks that can be additionally drawn from the study presented here are: 1) HST observations with WFPC2 on associations in the LMC reveal their sub-solar stellar masses with reasonable completeness, due to lack of crowding. 2) In consequence the IMF of these systems can be successfully constructed down to the detected low-mass end, in the optical, due to low reddening. 3) Stellar associations cover length-scales larger than typical star clusters, and thus, wide field imaging is required for the study of a typical extra-galactic stellar association at its extend. Hence, the Advanced Camera for Surveys would be the most appropriate instrument for such studies to be carried on.
References
- (1) Ambartsumian V. A. 1947, in Stellar Evolution and Astrophysics, Armenian Acad. of Sci. (German transl., 1951, Abhandl. Sowjetischen Astron., 1, 33)
- (2) Andersen, M. 2004, in The Initial Mass Function 50 years later, eds. E. Corbelli, F. Palla, & H. Zinnecker (ASSL: Kluwer Academic Publishers), in press
- (3) Blaauw, A. 1964, ARA&A, 2, 213
- (4) Brandl, B., Sams, B. J., Bertoldi, F., et al. 1996, ApJ, 466, 254
- (5) Brandl, B., Brandner, W., Eisenhauer, F., Moffat, A. F. J., Palla, F., & Zinnecker, H. 1999, A&A, 352, L69
- (6) Brandner W., Grebel, E. K., Barbá, R. H., et al. 2001, AJ, 122, 858
- (7) Castro, R., Santiago, B. X., Gilmore, G. F., Beaulieu, S., & Johnson, R. A. 2001, MNRAS, 326, 333
- (8) Chabrier, G. 2003, PASP, 115, 763
- (9) Davies, R. D., Elliot, K. H., & Meaburn, J. 1976, MmRAS, 81, 89
- (10) de Boer, K. S., Braun, J. M., Vallenari, A., & Mebold, U. 1998, A&A, 329, L49
- (11) de Grijs, R., Gilmore, G. F., Mackey, A. D., et al. 2002, MNRAS, 337, 597
- (12) de Zeeuw, P. T., Hoogerwerf, R., de Bruijne, J. H. J., Brown, A. G. A., & Blaauw, A. 1999, AJ, 117, 354
- (13) Dolphin, A. E. 2000a, PASP, 112, 1383
- (14) Dolphin, A. E. 2000b, PASP, 112, 1397
- (15) Dolphin, A. E. & Hunter, D. A. 1998, AJ, 116, 1275
- (16) Elson, R. A. W., Gilmore, G. F., & Santiago, B. X. 1997, MNRAS, 289, 157
- (17) Efremov, Yu. N., & Elmegreen, B. G. 1998a, MNRAS, 299, 588
- (18) Efremov, Yu. N., & Elmegreen, B. G. 1998b, MNRAS, 299, 643
- (19) Fagotto, F., Bressan, A., Bertelli, G., & Chiosi, C. 1994, A&AS, 105, 39
- (20) Fischer, Ph., Pryor, C., Murray, S., Mateo, M., & Richtler, T. 1998, AJ, 115, 592
- (21) Gallagher, J. S., Mould, J. R., de Feijter, E., et al. 1996, ApJ, 466, 732
- (22) Garmany, C. D., Massey, Ph., & Parker, J. W. 1994, AJ, 108, 1256
- (23) Geha, M. C., Holtzman, J. A., Mould, J. R., et al. 1998, AJ, 115, 1045
- (24) Girardi, L., Bressan, A., Bertelli, G., & Chiosi, C. 2000, A&AS, 141, 371
- (25) Girardi, L., Bertelli, G., Bressan, A., et al. 2002, A&A, 391, 195
- (26) Gouliermis, D., Kontizas, M., Korakitis, R., Morgan, D. H., Kontizas, E., & Dapergolas, A. 2000, AJ, 119, 1737
- (27) Gouliermis, D., Keller, S. C., de Boer, K. S., et al. 2002, A&A, 381, 862
- (28) Gouliermis, D., Kontizas, M., Kontizas, E., & Korakitis, R. 2003, A&A, 405, 111
- (29) Gouliermis, D., Keller, S. C., Kontizas, M., Kontizas, E., & Bellas-Velidis, I. 2004, A&A, 416, 137
- (30) Gouliermis, D., Brandner, W., & Henning, Th. 2004, in The Initial Mass Function 50 years later, eds. E. Corbelli, F. Palla, & H. Zinnecker (ASSL: Kluwer Academic Publishers), in press
- (31) Grebel, E. K., & Chu, Y.-H. 2000, AJ, 119, 787
- (32) Henize, K. G. 1956, ApJS, 2, 315
- (33) Hill, J. K., Isensee, J. E., Cornett, R. H., et al. 1994, ApJ, 425, 122
- (34) Hill, R. J., Madore, B. F., & Freedman, W. L. 1994, ApJ, 429, 204
- (35) Hill, R. S., Cheng, K.-P., Bohlin, R. C., et al. 1995, ApJ, 446, 622 (HCB95)
- (36) Hodge, P. W. 1986, in Luminous Stars and Associations in Galaxies, ed. C. de Loore, A. Willis, & P. Laskarides (Dordrecht: Reidel), IAU Symp., 116, 369
- (37) Hunter, D. A. 1995, Revista Mexicana de Astronomia y Astrofisica Conference Series, 3, 1
- (38) Hunter, D. A., Light, R. M., Holtzman, J. A., et al. 1997, ApJ, 478, 124
- (39) Keller, S. C., Bessell, M. S., & Da Costa, G. S. 2000, AJ, 119, 1748
- (40) Kim, S., Staveley-Smith, L., Sault, R. J., Kesteven, M. J., McConnell, D., & Freeman, K. C. 1997, PASA, 14, 119
- (41) Kim, S., Dopita, M. A., Staveley-Smith, L., & Bessell, M. 1999, AJ, 118, 2797
- (42) Koornneef, J. 1983, A&A, 128, 84
- (43) Kroupa, P. 2002, Science, 295, 82
- (44) Leitherer, C. & Wolf, B. 1984, A&A, 132, 151
- (45) Lucke, P. 1972, Ph.D. thesis, Univ. Washington
- (46) Lucke, P., & Hodge, P. W. 1970, AJ, 75, 171
- (47) Massey, P. 1990, ASP Conf. Ser. 7: Properties of Hot Luminous Stars, 30
- (48) Massey, P. 1993, ASP Conf. Ser. 35: Massive Stars: Their Lives in the Interstellar Medium, 168
- (49) Massey, P., Silkey, M., Garmany, C. D., & Degioia-Eastwood, K. 1989, AJ, 97, 107
- (50) Massey, Ph., Lang, C. C., Degioia-Eastwood, K. & Garmany, C. D. 1995, ApJ, 438, 188
- (51) Massey, Ph., Johnson, K. E. & Degioia-Eastwood, K. 1995, ApJ, 454, 151
- (52) Meaburn, J. 1980, MNRAS, 192, 365
- (53) Metcalfe, N., Shanks, T., Campos, A., McCracken, H. J., & Fong, R. 2001, MNRAS, 323, 795
- (54) Mihalas, D. & Binney, J. 1981, Galactic Astronomy (San Francisco: Freeman)
- (55) Oey, M. S. & Massey, P. 1995, ApJ, 452, 210
- (56) Olsen, K. A. G., Kim, S., & Buss, J. F. 2001, AJ, 121, 3075
- (57) Olson, B. I. 1975, PASP, 87, 349
- (58) Panagia, N., Gilmozzi, R., Macchetto, F., Adorf, H.-M., & Kirshner, R. P. 1991, ApJL, 380, L23
- (59) Panagia, N., Romaniello, M., Scuderi, S., & Kirshner, R. P. 2000, ApJ, 539, 197
- (60) Parker, J. W., & Garmany, C. D. 1993, AJ, 106, 1471
- (61) Parker, J. W., Zaritsky, D., Stecher, T. P., Harris, J., & Massey, P. 2001, AJ, 121, 891
- (62) Preibisch, T. & Zinnecker, H. 1999, AJ, 117, 2381
- (63) Ratnatunga, K. U. & Bahcall, J. N. 1985, ApJS, 59, 63
- (64) Salasnich, B., Girardi, L., Weiss, A., & Chiosi, C. 2000, A&A, 361, 1023
- (65) Salpeter, E. E. 1955, ApJ, 121, 161
- (66) Scalo, J. N. 1986, Fundam. Cosmic Phys. 11, 1
- (67) Scalo, J. 1998, ASP Conf. Ser. 142: The Stellar Initial Mass Function (38th Herstmonceux Conference), 201
- (68) Schaerer, D., Meynet, G., Maeder, A., & Schaller, G. 1993, A&AS, 98, 523
- (69) Siess L., Dufour E. and Forestini M. 2000, A&A, 358, 593
- (70) Sirianni, M., Nota, A., Leitherer, C., et al. 2000, ApJ, 533, 203
- (71) Sirianni, M., Nota, A., De Marchi, G., Leitherer, C., & Clampin, M. 2002, ApJ, 579, 275
- (72) Smecker-Hane, T., Cole, A. A., Gallagher, J. S. III, Stetson, P. B. 2002, ApJ, 566, 239
- (73) Stolte, A., Brandner, W., Brandl, B., Zinnecker, H., Grebel, E. K. 2004, AJ, 128, 765
- (74) Taylor, B. J. 1986, ApJS, 60, 577
- (75) Turner, D. G. 1976, AJ, 81, 1125
- (76) Westerlund, B. E. 1997, The Magellanic Clouds (Cambridge Univ. Press)
- (77) Will, J.-M., Bomans, D. J., Vallenari, A., Schmidt, J. H. K., de Boer, K. S. 1996, A&A, 315, 125
- (78) Will, J.-M., Bomans, D. J., & Dieball, A. 1997, A&AS, 123, 455