New Brown Dwarfs and an Updated Initial Mass Function in Taurus11affiliation: Based on observations performed at Las Campanas, MMT, and Whipple Observatories. The MMT Observatory is a joint facility of the Smithsonian Institution and the University of Arizona. This publication makes use of data products from the Two Micron All Sky Survey, which is a joint project of the University of Massachusetts and the Infrared Processing and Analysis Center/California Institute of Technology, funded by the National Aeronautics and Space Administration and the National Science Foundation.
Abstract
By combining infrared photometry from the Two-Micron All-Sky Survey with new optical imaging and spectroscopy, I have performed a search for young low-mass stars and brown dwarfs in two regions encompassing a total area of 4 deg2 in the Taurus star-forming region ( Myr). From this work, I have discovered 15 new members of Taurus. In addition, I present seven new members outside of these areas from the initial stage of a survey of all of Taurus. These 22 objects exhibit spectral types of M4.5-M9.25 and masses of 0.3-0.015 according to the theoretical evolutionary models of Baraffe and Chabrier, seven of which are likely to be brown dwarfs. Emission in H, He I, Ca II, [O I], and [S II] and excess emission in optical and near-infrared bands among some of these objects suggest the presence of accretion, outflows, and circumstellar disks. These results add to the body of work – initiated by the first detections of brown dwarf disks by Comerón and coworkers in 1998 and Luhman in 1999 – indicating that disks around young brown dwarfs are relatively common. The results from the 4 deg2 survey have been combined with previous studies of Taurus to arrive at an initial mass function for a total area of 12.4 deg2. As in the previous IMFs for Taurus, the updated IMF peaks at a higher mass (0.8 ) than the mass functions in IC 348 and Orion (0.1-0.2 ). Meanwhile, the deficit of brown dwarfs in Taurus appears to be less significant (-1.8) than found in earlier studies () because of a slightly higher brown dwarf fraction in the new IMF for Taurus and a lower brown dwarf fraction in the new spectroscopic IMF for the Trapezium from Slesnick and coworkers. The spatial distribution of the low-mass stars and brown dwarfs discovered in the two new survey areas closely matches that of the more massive members. Thus, on the degree size scales ( pc) probed to date, there is no indication that brown dwarfs form through ejection.
1 Introduction
The Taurus star-forming region is an important target for searches for young low-mass stars and brown dwarfs. Relative to most known star-forming regions, Taurus exhibits low gas and stellar density, providing an opportunity to test for variations in the low-mass initial mass function (IMF) with star-forming conditions. In addition, as one of the nearest major star-forming regions (140 pc), the substellar members of Taurus are among the brightest young brown dwarfs in the sky, and thus are prime targets for detailed studies of the birth of brown dwarfs.
Initial success in discovering members of Taurus down to the hydrogen burning limit was made through deep imaging of one of its most compact stellar aggregates, L1495E, at X-ray, optical, and near-infrared (IR) wavelengths (Strom & Strom, 1994; Luhman & Rieke, 1998). Subsequently, wide-field optical imaging has proven effective in uncovering members at substellar masses and across wide areas of the region (Briceño et al., 1998; Martín et al., 2001), particularly when combined with near-IR photometry from the Two-Micron All-Sky Survey (2MASS) (Luhman, 2000; Briceño et al., 2002; Luhman et al., 2003a). Additional brown dwarfs in Taurus have been identified through observations of the multiple system GG Tau (White et al., 1999) and continuum sources (White & Basri, 2003). From this work, 15 Taurus members have been found with spectral types later than M6, which correspond to substellar masses on an Hertzsprung-Russell (H-R) diagram with the evolutionary models of Baraffe et al. (1998) and Chabrier et al. (2000).
These surveys have produced the first constraints on the low-mass IMF in Taurus. Luhman (2000) derived an IMF for an area of 0.7 deg2 toward four of the densest aggregates that was characterized by a peak at 0.8 and a deficit of brown dwarfs relative to the Trapezium Cluster in Orion (Luhman et al., 2000; Hillenbrand & Carpenter, 2000; Muench et al., 2002). Briceño et al. (2002) and Luhman et al. (2003a) surveyed an additional 7.7 deg2 and for the combined area of 8.4 deg2 measured an IMF in which the ratio of the number of brown dwarfs to the number of stars was again lower than in the Trapezium, this time by a factor of two. Luhman et al. (2003b) found that this brown dwarf fraction for Taurus did agree with the value in the young cluster IC 348, while the peak mass differed between Taurus (0.8 ) and IC 348 (0.1-0.2 ). The distinctive shapes of the IMFs in Taurus and IC 348 were reflected in the distributions of spectral types, which peaked at K7 and M5, respectively, representing unambiguous, model-independent evidence for a significant variation of the IMF. Through recent spectroscopy of a large number of brown dwarf candidates in the Trapezium Cluster, Slesnick et al. (2004) have identified a substantial population of faint sources that have relatively early spectral types indicative of stars rather than brown dwarfs. They suggested that these contaminating sources have resulted in overestimates of the brown dwarf fraction in the Trapezium in previous studies of the cluster, which were based almost exclusively on photometry. After correcting for these contaminants, Slesnick et al. (2004) measured a brown dwarf fraction for the Trapezium that was a factor of greater than that in Taurus. The theoretical implications of these IMF measurements in Taurus have been investigated in these surveys (Luhman, 2000; Briceño et al., 2002; Luhman et al., 2003b) and in subsequent work (Kroupa & Bouvier, 2003b; Delgado-Donate et al., 2004; Goodwin et al., 2004).
To continue to improve the number statistics of the IMF measurements in Taurus, to sample a larger fraction of the region, and to find additional targets for studies of brown dwarf formation, I have surveyed two new regions in Taurus encompassing a total area of 4 deg2. In this paper, I describe and imaging of these regions (§ 2.1) and optical spectroscopy of candidate members (§ 2.2), which are selected from a combination of this optical photometry and data from 2MASS (§ 3.1). I then measure the spectral types of these candidates and determine their status as field stars or Taurus members (§ 3.2), discuss the physical properties of the confirmed members (§ 3.3), and evaluate the completeness of the survey (§ 3.4). For all known Taurus members in the new survey area, I estimate extinctions, luminosities, and effective temperatures, and construct an H-R diagram (§ 4.1). Using the theoretical evolutionary models, I infer individual masses for these sources and derive an IMF from the combination of the previously studied 8.4 deg2 regions (Field 1) and these new 4 deg2 regions (Field 2) (§ 4.2). Finally, I examine the implications of this new measurement of the IMF in Taurus for recent theoretical predictions of the IMF of stars and brown dwarfs (§ 5).
2 Observations
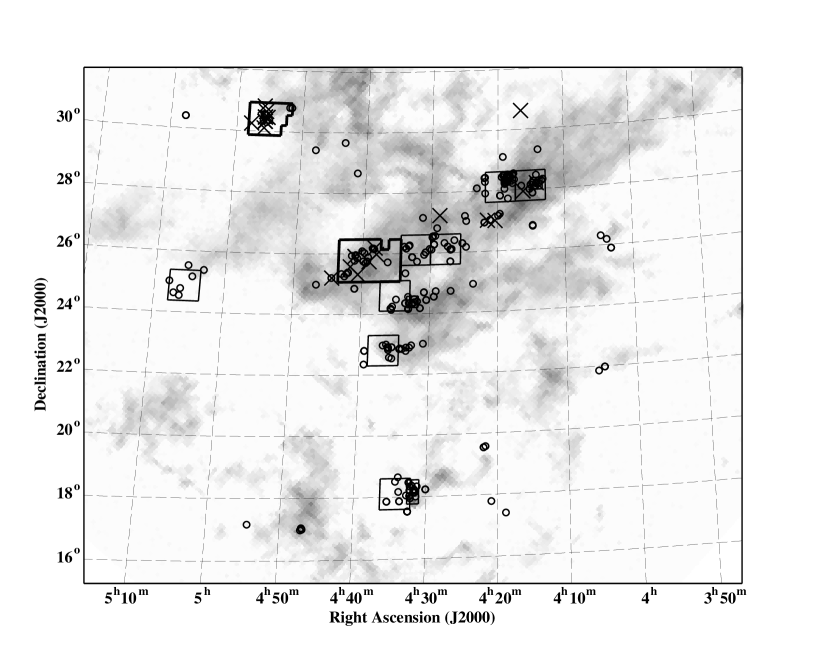
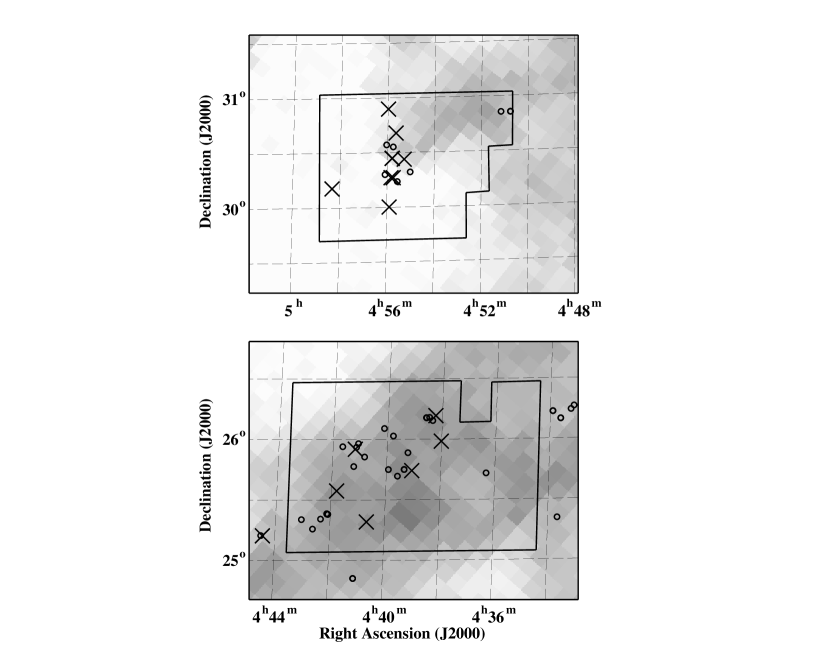
The regions in Taurus previously imaged at and by Briceño et al. (1998), Luhman (2000), Briceño et al. (2002), and Luhman et al. (2003a) are indicated in Figures 1 and 2, which encompass a total area of 8.4 deg2. For the new imaging in this study, I selected two areas toward known groups of young stars, which are shown in those maps. The north and south regions are centered at , and , (J2000) and cover 1.32 and 2.84 deg2, respectively. Henceforth in this work, I refer to these regions in the old and new surveys as Field 1 and Field 2. In addition, I will present spectra from an initial sample of candidates drawn from a survey across 225 deg2 encompassing all of the Taurus star-forming region, which will be referenced as the 225 deg2 survey.
2.1 Photometry
Images of the two areas in Field 2 were obtained with the four shooter camera at the Fred Lawrence Whipple Observatory 1.2 m telescope on 2002 December 6-11. The instrument contained four CCDs separated by and arranged in a grid. After binning during readout, the plate scale was pixel-1. The fields were divided into grids in right ascension and declination where the grid cells were separated by . At each cell, two positions separated by in right ascension and declination were observed. At each position, images were obtained with exposure times of 30 and 900 s at and 20 and 600 s at . The images were bias subtracted, divided by dome flats, registered, and combined into one image at each band and exposure time. During one of the photometric nights, additional short exposures were obtained in a grid of pointings separated by . These exposures overlapped with all of the pointings in the full maps and thus enabled checking of the photometric calibration.
Photometry and image coordinates of the sources in these data were measured with DAOFIND and PHOT under the IRAF package APPHOT. Aperture photometry was extracted with a radius of five pixels. The background level was measured in an annulus around each source and subtracted from the photometry, where the inner radius of the annulus was five pixels and the width was one pixel. The photometry was calibrated in the Cousins system by combining data for standards across a range of colors (Landolt, 1992) with the appropriate aperture and airmass corrections. The data were calibrated by assuming for A-type standard stars. This type of calibration at is sufficient since the analysis in this study relies only on the relative precision of the photometry. To compare this photometry to data from another instrument, one would need to calibrate the latter in the manner applied to these data and to account for any differences in the filter and instrument transmission profiles. Saturation in the short exposures occurred near magnitudes of 11-12 in both filters. The completeness limits of the long exposures were and . The plate solution was derived from coordinates measured in the 2MASS Point Source Catalog for stars that appeared in the optical images and were not saturated. During the course this data reduction, I discovered an arithmetic error in the photometric calibration of the data from Luhman (2000) such that those measurements were too bright by 0.55 magnitudes. This error had no affect on any of the analysis in that study since the photometry was used only for computing , and only the relative values of these colors were relevant.
2.2 Spectroscopy
I performed low-resolution optical spectroscopy on 49 candidate members of Taurus. The selection of these sources is described in § 3.1. Table 1 summarizes the observing runs and instrument configurations for these data. In Tables 2 and 3, I indicate the night on which each star was observed. On 2003 December 14, I also obtained a spectrum of Haro 6-32, which is a previously known member of Taurus within the areas surveyed in this study and lacking a published spectral type. The spectroscopy of this sample was performed with the Inamori Magellan Areal Camera and Spectrograph (IMACS) on the Magellan I telescope at Las Campanas Observatory and the Red Channel spectrograph at the MMT Observatory. Each spectrum was collected with the slit rotated to the parallactic angle. The exposure times ranged from 120 to 1800 s. After bias subtraction and flat-fielding, the spectra were extracted and calibrated in wavelength with arc lamp data. The spectra were then corrected for the sensitivity functions of the detectors, which were measured from observations of spectrophotometric standard stars. For some of the objects observed with Red Channel on the MMT, noticeable fringing remains in the final spectra at long wavelengths, as seen in Figures 3 and 4. The spectra with IMACS on Magellan exhibit a gap in wavelength coverage at 6640-6740 Å that is produced by the boundary between two adjacent CCDs.
3 New Members of Taurus
3.1 Selection of Candidate Members
A nearby population of young stars and brown dwarfs will exhibit colors and absolute photometry that are distinct from those of most field stars. Therefore, color-magnitude diagrams composed of optical and near-IR photometry are useful tools for distinguishing candidate members of a young cluster from field stars. However, the presence of variable extinction increases the contamination of background stars in the regions of these diagrams inhabited by members and prevents reliable mass estimates for candidate members because reddened high-mass members and unreddened low-mass members can have the same optical color and magnitude. To better separate young objects from field stars and to improve the ability to estimate masses of candidates in such diagrams, the photometry in these diagrams can be corrected for reddening. Therefore, I have constructed extinction-corrected diagrams of versus and versus from the optical photometry in this work and near-IR data from the 2MASS Point Source Catalog, where the reddenings toward individual stars are estimated in the manner described by Luhman (2004). I then use these diagrams to identify candidate young stars and brown dwarfs in the Taurus fields surveyed in this work. This dereddening method requires no knowledge of spectral types or membership and can be applied uniformly to photometry to better separate cluster members from field stars in a color-magnitude diagram. More accurate extinctions for the confirmed cluster members will be estimated in § 4.1 by incorporating the spectral type measurements.
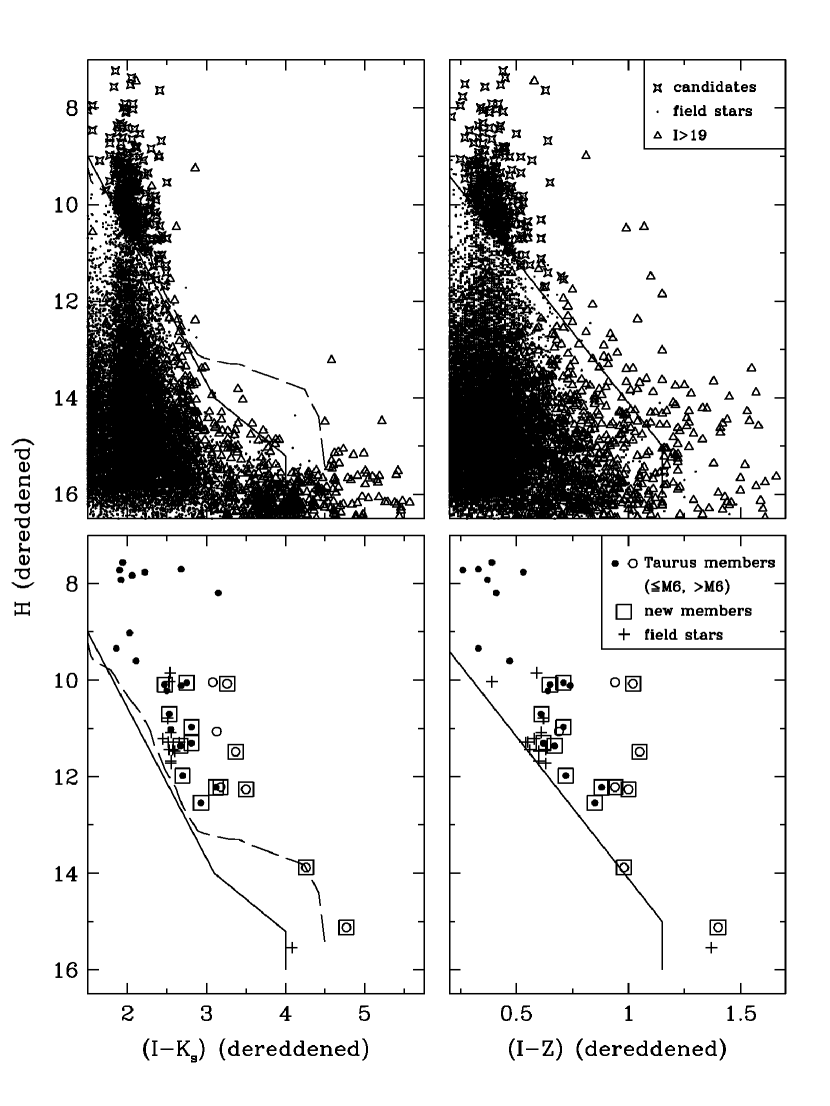
When the known members of Taurus are placed on a H-R diagram, most of them appear above the model isochrone for an age of 10 Myr from Baraffe et al. (1998) (§ 4.1). In the diagram of versus in Figure 5, I plot the 10 Myr isochrone from Baraffe et al. (1998) for masses of 0.015 to 1 at a distance modulus of 5.76 (Wichmann et al., 1998). This isochrone was converted to photometric magnitudes from predicted effective temperatures and bolometric luminosities in the manner described by Luhman et al. (2003a). I have defined a boundary below this isochrone to separate candidate members of Taurus and probable field stars, as shown in Figure 5. For versus , I defined a similar boundary below the lower envelope of the sequence of known members in the fields observed by Luhman (2000). I am primarily interested in identifying candidates at lower reddenings that could fall within the extinction limit that will be used to define the IMF sample for this survey (§ 4.2). As a result, I consider only sources with in Figure 5. For spectroscopy, I selected the 28 objects that appeared above both of these boundaries, were not previously known members, and had dereddened (M4) and accurate photometry (). Sources with cannot be reliably identified as field stars or candidate members based these color-magnitude diagrams because of the photometric uncertainties. Nevertheless, I did include one object just beyond this magnitude limit which appeared well to the right of the boundaries in Figure 5 and thus was a promising candidate. The impact of the unobserved candidates at and the sources with on the completeness of this survey is discussed in § 3.4. Two of these objects in my spectroscopic sample were previously identified as candidate low-mass members of Taurus through detections of -band excess emission. Those near-IR data were collected by Itoh et al. (1996) and the astrometry and photometry for the two candidates, ITG 2 and 34, were reported by Itoh et al. (1999).
The boundaries used in separating candidate members from probable field stars in Figure 5 were also applied to the data from Briceño et al. (2002), after shifting the boundary to match the color system in that work. In this way, I identified four remaining candidates from that study that lacked spectroscopy, all of which were near the selection boundaries and thus were marginal candidates. These four stars were included in my spectroscopic sample. Finally, I have recently begun a search for young low-mass star and brown dwarfs across 225 deg2 encompassing all of the Taurus star-forming region. These candidates were selected with data from the USNO-B1 and Two-Micron All-Sky Survey (2MASS) catalogs. The selection criteria for these candidates will be described in a future work when the survey is completed. I include here the spectroscopy of the first 17 candidates from that survey. These sources can be identified in Tables 2 and 3 by their lack of photometry. One of these objects, IRAS 04414+2506, was previously identified as a candidate member of Taurus by Kenyon et al. (1994) on the basis of its mid-IR excess emission.
3.2 Classification of Candidate Members
I measure spectral types and assess membership for the 49 candidate Taurus members in my spectroscopic sample by applying the methods of classification described in my previous studies of Taurus and other young populations (Luhman, 1999, 2004; Luhman et al., 2003a, b). In this way, I classify 27 candidates as field stars. Astrometry and photometry for these sources are listed in Table 2. The spectra for the 22 remaining candidates are shown in Figures 3 and 4. These data exhibit evidence of youth, and thus membership in Taurus, in the form of the weak K I and Na I absorption features that are characteristic of pre-main-sequence objects (Martín et al., 1996; Luhman, 1999), as illustrated in Figure 6 in a comparison of a young star and a field dwarf from my sample. These objects are clearly not field giants according to various spectral features in these data, such as CaH (Kirkpatrick et al., 1997). The youth of several of these sources is further indicated by the presence of strong emission in H that is above the levels observed for active field dwarfs (Gizis et al., 2000, 2002). In addition, the membership of five objects is independently established by the presence of reddening in their spectra and their positions above the main sequence for the distance of Taurus, which indicate that they cannot be field dwarfs in the foreground or the background of the cloud, respectively. Astrometry, photometry, spectral types, and evidence of membership for these 22 new members of Taurus are provided in Table 3. For a few sources that exhibited evidence of veiling in their spectra, such as 2MASS J04414825+2534304, J04411078+2555116, and J04141188+2811535, the spectral types are based primarily on the reddest absorption bands (8000 Å) where the excess continuum emission should be weakest.
The membership and youth of the 22 new sources presented in this study are conclusively established by the criteria listed in Table 3. Future measurements of additional diagnostics such as Li are not required for confirmation of membership since that is already determined in this work. This also applies to many of the other young late-type objects discovered in previous surveys of star-forming regions. For instance, Barrado y Navascués et al. (2004) allegedly “confirmed” the youth and membership of LS-RCrA 1 through measurements of Li, gravity-sensitive K I, and a radial velocity. However, the youth of this source was not in question given the intensity of the H emission and other permitted lines, presence of emission in H2 and forbidden transitions, and strength of the gravity-sensitive Na I and K I in the discovery data from Fernández & Comerón (2001). Similarly, Barrado y Navascués (2004) obtained high-resolution spectra of three sources discovered by Briceño et al. (2002). Although multiple lines of evidence were used to firmly establish the youth and membership of these objects by Briceño et al. (2002), Barrado y Navascués (2004) referred to them as “candidate” members and proceeded to “confirm” their membership through the detection of Li absorption. Indeed, Barrado y Navascués (2004) failed to explain in any way why the evidence of membership presented by Briceño et al. (2002) was insufficient. These claims of “confirmation” by Barrado y Navascués et al. (2004) and Barrado y Navascués (2004) are misleading and overstated since they imply the presence of an uncertainty in the nature of the sources in the original discovery papers when no such uncertainty existed.
3.3 Properties of New Members
3.3.1 Disks, Accretion, and Outflows
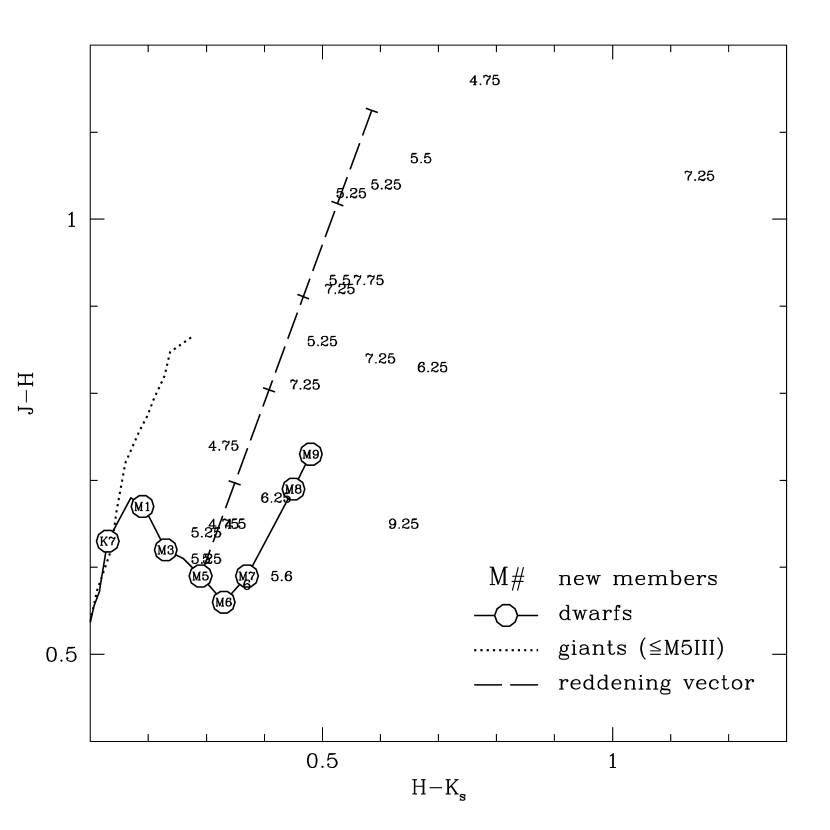
In this section, I examine the available data for the 22 new members of Taurus for signatures of circumstellar disks, accretion, and outflows. I begin by plotting these sources in the diagram of versus in Figure 7 to check for the presence -band excess emission from circumstellar material. For comparison, I include the sequences of dwarfs and giants from Leggett (1992) and Bessell & Brett (1988) for spectral types of M9 V and M5 III, respectively. As shown in Figure 7, most of the 22 new members have colors that agree well with reddened values of dwarfs at the spectral types in question. This result indicates that dwarf colors are good approximations of the intrinsic colors of young late-type objects, as found previously by Luhman (1999) and Briceño et al. (2002). Meanwhile, a few of these sources do exhibit significant -band excess ( mag), namely 2MASS J04381486+2611399 (M7.25), J04141188+2811535 (M6.25), and J04161210+2756385 (M4.75). The excess for the first object is particularly large. Although 2MASS J04574903+3015195 (M9.25) also appears to have an excess in Figure 7, I do not consider this excess significant because the photometry has large uncertainties at the faint levels of this source. These detections of K-band excess emission, particularly for the brown dwarf 2MASS J04381486+2611399, provide further evidence that young brown dwarfs have circumstellar disks, as first indicated by the detections of IR excess emission from substellar objects by Comerón et al. (1998) and Luhman (1999).
As seen in Figures 3 and 4, some of the new Taurus members exhibit H emission at high levels ( Å) as well as emission in He I and Ca II. Strong H emission and the presence of He I and Ca II emission are suggestive of intense accretion when observed in young stars (Muzerolle et al., 1998; Beristain et al., 2001). In addition, during the spectral classifications, I found that blue continuum veiling appeared to be present in the spectra of 2MASS J04414825+2534304 (M7.75), J04411078+2555116 (M5.5), and J04141188+2811535 (M6.25), all of which also show very strong emission in H. As an example, in Figure 8 I compare the spectrum of one of these sources, 2MASS J04141188+2811535, to the spectrum of another Taurus member, 2MASS J04552333+3027366, with the same spectral type as inferred from the VO band strengths at wavelengths beyond 8000 Å. This comparison clearly reveals the presence of excess emission that increasingly dilutes the photospheric absorption features at shorter wavelengths, which is direct evidence of intense accretion. Detailed analysis of the accretion in these objects will be provided through high-resolution spectroscopy by Muzerolle et al. (2004).
In Figure 9, I present detections of emission in [O I] in three young brown dwarfs, 2MASS J04442713+2512164, J04381486+2611399, and J04414825+2534304. Emission in [S II] is also found in the first two sources. Emission in forbidden transitions is typical of Herbig-Haro objects, Class I sources, and some T Tauri stars, where the emission is believed to arise predominantly in jets and outflows (Kenyon et al., 1998). These three new brown dwarfs are the coolest known young objects with emission in forbidden lines. Previous discoveries of forbidden line emission in slightly earlier objects have been made by Fernández & Comerón (2001) and Muzerolle et al. (2003).
3.3.2 Spatial Distribution
I now discuss the locations and spatial distribution of the 22 new members of Taurus discovered in this study.
Seven of the new members are from the 225 deg2 survey and thus are scattered across the region, as indicated in Figure 1. 2MASS J04202555+2700355 (M5.25), 04213459+2701388 (M5.5), and 04284263+2714039 (M5.25) are between L1495 and L1529. 2MASS J04442713+2512164 (M7.25) is just beyond the eastern border of the southern area in Field 2, while 2MASS J04163048+3037053 (M4.5) is north of L1495. 2MASS J04141188+2811535 (M6.25) is in a area observed by Briceño et al. (1998) and Luhman (2000). A field from Briceño et al. (2002) also contains this source, as well as 2MASS J04161210+2756385 (M4.75). These two objects were not discovered in those surveys because they were just above the saturation limits of the optical photometry. The implications of those saturation limits for the completeness of the previous surveys in Taurus are discussed in § 3.4.
The remaining 15 new members are within Field 2. Figure 2 compares the positions of these new members and the previously known members, which correspond to the low- and high-mass members, respectively. These results provide useful constraints on theories for the formation of brown dwarfs. For instance, Reipurth & Clarke (2001), Boss (2001), and Bate et al. (2002) have suggested that brown dwarfs could form as protostellar sources whose accretion is prematurely halted by ejection from multiple systems. The resulting spatial distributions of the ejected brown dwarfs might differ from those of the stellar members. Alternatively, if brown dwarfs and stars form in the same manner, then they should exhibit similar spatial distributions. Kroupa & Bouvier (2003a) and Kroupa & Bouvier (2003b) have investigated these scenarios in detail through dynamical modeling of Taurus-like aggregates of stars and brown dwarfs. In the model in which stars and brown dwarfs form in the same manner, they found that most of the brown dwarfs indeed shared the same spatial distributions as the stars and a high binary fraction, while a small tail of higher velocity ( km s-1) brown dwarfs were distributed more widely than the stars and were predominantly single. In comparison, the ejection model also produces widely distributed single brown dwarfs, but they are the dominant population among the brown dwarfs and thus exhibit a shallow density distribution (Kroupa & Bouvier, 2003a). Based on their interpretation of measurements of the IMF in Taurus, the Trapezium, and the field, Kroupa & Bouvier (2003b) tended to favor the ejection model (§ 5). However, Briceño et al. (2002) found no statistically significant differences in the distribution of the high- and low-mass members of Taurus. Similarly, I find that the spatial distribution of the new low-mass members closely matches that of the previously known, more massive young stars, as demonstrated in Figure 2. Thus, the available data are better reproduced by the model in which stars and brown dwarfs have a common formation mechanism (Kroupa & Bouvier, 2003a) than the ejection model (Kroupa & Bouvier, 2003b). A definitive test of the two models will require measurements of the density distribution of young brown dwarfs on larger size scales. Nevertheless, from the surveys of Taurus to date, there is no evidence for different spatial distributions between stars and brown dwarfs.
Finally, I note that two of the new members, 2MASS J04554801+3028050 (M5.6) and J04554757+3028077 (M4.75), are separated by only . Considering the very low stellar density in Taurus, these objects are likely to be components of a binary system rather than unrelated members.
3.4 Completeness of Census
To evaluate the completeness of my survey for new members in Field 2 in Figure 2, I consider the diagram of versus in Figure 10. The completeness limits of the 2MASS photometry are taken to be the magnitudes at which the logarithm of the number of sources as a function of magnitude departs from a linear slope and begins to turn over (, ). In Figure 10, I have plotted the 10 Myr isochrone from Baraffe et al. (1998) for and 4. I selected this isochrone because most members of Taurus fall above it on the H-R diagram (§ 4.1). As demonstrated in Figure 10, the IR photometric data should be complete for members with and , with the exception of close companions. In Figure 10, I have omitted the field stars identified with spectroscopy as well as objects that are probable field stars by their location below the boundaries in Figure 5. The remaining IR sources consist of confirmed members in the bottom panel and objects that lack spectroscopic data in the top panel. The latter are divided into candidate members from Figure 5, stars with uncertain optical photometry (), and sources detected only in the IR data. The data in the top panel of Figure 10 indicate that the current census in Field 2 is complete for -0.2 and . The upper limit of this mass range is a reflection of the fact that only candidates with dereddened (M4) were included in the spectroscopic sample (§ 3.1). At colors bluer than this threshold, which corresponds to and types of M4, there remains a large number of candidate members and thus the current census is incomplete based on this survey alone. Completeness at these higher masses is determined by the previous wide-field searches for young stars in Taurus through signatures of youth such as emission in H and X-rays (Strom & Strom (1994); Briceño et al. (1999), references therein), which quote completeness limits of M4. However, because of the difficulties in precisely quantifying completeness in those surveys, that completeness limit is only a rough estimate, and the applicable range of extinctions is undetermined. In summary, the combination of those previous surveys with the deeper search in this work should provide a fairly complete census of Taurus members at and at most masses above , although some incompleteness may exist at -0.6 (M2-M4). Just as this survey is incomplete for low-mass members with high extinction (), it is not sensitive to objects that are seen in scattered light (e.g., edge-on disks).
As mentioned in § 3.1, I have included in this study the spectroscopy of an initial set of candidates from a 225 deg2 survey of Taurus, from which seven new members have been found. Because this survey has not finished, I do not evaluate its completeness here. However, the new members produced thus far do have implications for the completeness of the previous surveys by Briceño et al. (1998), Luhman (2000), and Briceño et al. (2002). Two of the new members from the 225 deg2 search are within the areas considered in those studies (§ 3.3.2), and yet were not found in that work. These two sources were missed because they are slightly brighter than the saturation limits of in images of Briceño et al. (1998), Luhman (2000), and Briceño et al. (2002). Meanwhile, with spectral types of M4.75 and M6.25, these objects are just below the completeness limit of M4 in the older wide-field surveys discussed earlier in this section. Thus, for a narrow range of spectral types (M4-M6), the census of members from Briceño et al. (1998), Luhman (2000), and Briceño et al. (2002) was incomplete. In comparison, the 225 deg2 survey is sensitive to members at M4-M9, and so it uncovered two members at M4-M6 missed in those studies. The presence of only two undiscovered members indicates that the incompleteness was minor in the previous surveys. The new survey in this work does not suffer from incompleteness at M4-M6 since its saturation limits are brighter (), which allows the detection and identification of all candidates in this range of types.
4 The Taurus Stellar Population
For all known members of Taurus within Field 1, photometry, spectral types, extinctions, effective temperatures, and bolometric luminosities were compiled by Briceño et al. (2002) and Luhman et al. (2003a). Those data were then used to construct an H-R diagram, estimate individual masses with evolutionary models, and generate an IMF from an extinction-limited sample. In this section, I repeat these steps for Field 2 from this work and present a combined IMF for Fields 1 and 2. The new members found outside of these fields from the 225 deg2 survey are also included in this analysis up to the point of placing them on the H-R diagram, but they will not be added to the IMF as that survey is not finished and thus lacks well-defined completeness (§ 3.4).
4.1 H-R Diagram
I have estimated extinctions, effective temperatures, and bolometric luminosities from the spectral types and photometry for all known members of Taurus in Field 2 and for the additional new members found in the 225 deg2 survey. These data are listed in Tables 3 and New Brown Dwarfs and an Updated Initial Mass Function in Taurus11affiliation: Based on observations performed at Las Campanas, MMT, and Whipple Observatories. The MMT Observatory is a joint facility of the Smithsonian Institution and the University of Arizona. This publication makes use of data products from the Two Micron All Sky Survey, which is a joint project of the University of Massachusetts and the Infrared Processing and Analysis Center/California Institute of Technology, funded by the National Aeronautics and Space Administration and the National Science Foundation. for the new and previously known members, respectively. I have employed the procedures described by Briceño et al. (2002) with the following modification. Briceño et al. (2002) measured extinctions from optical spectral only for late-type sources that lacked optical photometry. In this work, I have adopted the extinction implied by the optical spectra for all members in my spectroscopic sample. Following Luhman (2004), this reddening is quantified by the color excess between 0.6 and 0.9 µm, denoted as in Figures 3 and 4. These excesses have been converted to with the relation , which is derived from the extinction laws of Cardelli et al. (1989) and Rieke & Lebofsky (1985) for as in Luhman (2004). The combined uncertainties in , , and BCJ (, 0.03, 0.1) correspond to errors of in the relative values of log . When an uncertainty in the distance modulus is included (), the total uncertainties are . The previously known members contain six pairs with separations less than . As in my previous work in Taurus, each of these pairs is treated as one source and appears as a single entry in Table New Brown Dwarfs and an Updated Initial Mass Function in Taurus11affiliation: Based on observations performed at Las Campanas, MMT, and Whipple Observatories. The MMT Observatory is a joint facility of the Smithsonian Institution and the University of Arizona. This publication makes use of data products from the Two Micron All Sky Survey, which is a joint project of the University of Massachusetts and the Infrared Processing and Analysis Center/California Institute of Technology, funded by the National Aeronautics and Space Administration and the National Science Foundation., resulting in a total of 29 sources in this list. Because seven of these members lack spectral classifications, extinctions, temperatures, and luminosities are not estimated for them.
The 44 members in Tables 3 and New Brown Dwarfs and an Updated Initial Mass Function in Taurus11affiliation: Based on observations performed at Las Campanas, MMT, and Whipple Observatories. The MMT Observatory is a joint facility of the Smithsonian Institution and the University of Arizona. This publication makes use of data products from the Two Micron All Sky Survey, which is a joint project of the University of Massachusetts and the Infrared Processing and Analysis Center/California Institute of Technology, funded by the National Aeronautics and Space Administration and the National Science Foundation. with temperature and luminosity estimates have been placed on the H-R diagram in Figure 11. Sources that will be included and excluded from the IMF in § 4.2 are plotted in the middle and bottom panels, respectively. For reference, the top panel of Figure 11 shows the known Taurus members that have and that are within Field 1, which comprise the IMF sample from Luhman et al. (2003a). As in that previous IMF sample, most of the Taurus members in Field 2 appear above the 10 Myr isochrone of Baraffe et al. (1998) and Chabrier et al. (2000). However, whereas the previous sample has a median age of 1-1.5 Myr, the members in Field 2 seem to have older ages. When members in the northern and southern areas in Field 2 are plotted separately, the southern sources have the same median age as the previous IMF sample while the northern members exhibit a median age of 3 Myr. For instance, all of the members in Field 2 that are above the 1 Myr isochrone are in the southern area. The southern region is adjacent to some of the previously surveyed areas, so it is not surprising that their ages agree. Meanwhile, the northern area is far from the other fields in question and on the edge of the star-forming region. Thus, the members in that field could indeed have a different age than the bulk of Taurus. Two of the new members, 2MASS J04163048+3037053 and J04381486+2611399, appear near the 30 Myr isochrone and thus are anomalously faint for their spectral types. Similar sources have been found in previous surveys of Taurus, IC 348, Orion, and Chamaeleon (Briceño et al., 2002; Luhman et al., 2003a, b; Slesnick et al., 2004; Luhman, 2004). The apparent subluminous nature of these sources may be the result of occultation by circumstellar structures, which allows only scattered light to reach the observer. One of these sources, 2MASS J04381486+2611399, is probably a brown dwarf according to its spectral type of M7.25, and exhibits forbidden line emission and a large -band excess (§ 3.3.1). Other examples of subluminous late-type objects are LS-RCrA 1 and KPNO-Tau 12 (Fernández & Comerón, 2001; Luhman et al., 2003a).
4.2 The Initial Mass Function
I now measure the IMF for Fields 1 and 2. I begin with the IMF for Field 1 from Luhman et al. (2003a), which consisted of the 92 known members in that area with extinctions of . The two new members found in this work that were missed in that survey (§ 3.4) have and thus are added to that sample. As discussed in § 3.4, the census of members in Fields 1 and 2 should be complete within this extinction limit for , except for possible incompleteness at 0.3-0.6 . Therefore, I select the known Taurus members within an extinction limit of in Field 2 and add them to the IMF from Field 1. Among the seven members in Table New Brown Dwarfs and an Updated Initial Mass Function in Taurus11affiliation: Based on observations performed at Las Campanas, MMT, and Whipple Observatories. The MMT Observatory is a joint facility of the Smithsonian Institution and the University of Arizona. This publication makes use of data products from the Two Micron All Sky Survey, which is a joint project of the University of Massachusetts and the Infrared Processing and Analysis Center/California Institute of Technology, funded by the National Aeronautics and Space Administration and the National Science Foundation. that lack spectral classifications, five sources are not included in the IMF because their near-IR colors are indicative of . The other two members are CIDA-7 and HV Tau C. CIDA-7 was not placed on the H-R diagram because of uncertainty in the M2-M3 classification by Briceño et al. (1999). Since the colors of CIDA-7 indicate an extinction of , it should be included in the IMF. Therefore, I adopt a spectral type of M2.5, which corresponds to a mass of with the evolutionary models of Baraffe et al. (1998). Because HV Tau C has an edge-on disk (Monin & Bouvier, 2000), it is omitted from the IMF sample for the reasons described by Briceño et al. (2002). After applying these criteria, I arrive at a sample of 33 members in Field 2 which are added to the sample of 94 sources in Field 1. Histograms of the combined IMF sample are shown in terms of spectral types and masses in Figures 12 and 13. The masses for these objects have been inferred from the theoretical evolutionary models of Baraffe et al. (1998) and Chabrier et al. (2000) for and the models of Palla & Stahler (1999) for because they provide the best agreement with observational constraints (Luhman et al., 2003b).
Following Briceño et al. (2002) and Luhman et al. (2003b), I quantify the relative numbers of brown dwarfs and stars and the relative numbers of low-mass and high-mass stars with these ratios:
5 Implications of New Taurus IMF
Measurements of mass functions in Taurus and other star-forming regions can be used to test the predictions of models for the formation of stars and brown dwarfs. In this section, I first summarize recent observational work in star-forming regions and then examine the implications of these data for theoretical models.
5.1 Recent IMF Measurements
5.1.1 Brown Dwarfs
As reviewed in § 1, recent spectroscopic surveys of Taurus (Briceño et al., 2002; Luhman et al., 2003a) and IC 348 (Luhman et al., 2003b) have reported brown dwarf fractions that are a factor of two lower than the values derived from luminosity function modeling in the Trapezium Cluster in Orion (Luhman et al., 2000; Hillenbrand & Carpenter, 2000; Muench et al., 2002). However, upon spectroscopy of a large sample of brown dwarf candidates in the Trapezium, Slesnick et al. (2004) found a population of faint objects with stellar masses, possibly seen in scattered light, which had contaminated previous photometric IMF samples and resulted in overestimates of the brown dwarf fraction in this cluster. After Slesnick et al. (2004) corrected for this contamination, in the Trapezium was a factor of higher than the value in Taurus from Luhman et al. (2003a). This difference would be reduced further () if the new measurement of in this work is adopted. However, as discussed in the previous section, the estimates of in Taurus could be overestimates as well because of possible incompleteness at masses of 0.3-0.6 . In summary, according to the best available data, the brown dwarf fractions in Taurus and IC 348 are lower than in the Trapezium, but by a factor (1.4-1.8) that is smaller than that reported in earlier studies.
5.1.2 Stars
In logarithmic units where the Salpeter slope is 1.35, the IMFs for IC 348 and the Trapezium Cluster rise from high masses down to a solar mass, rise more slowly down to a maximum at 0.1-0.2 , and then decline into the substellar regime (Luhman et al., 2003b; Muench et al., 2002, 2003; Slesnick et al., 2004). In comparison, the IMF for Taurus rises quickly to a peak near 0.8 and steadily declines to lower masses (Briceño et al. (2002); Luhman et al. (2003a); Figure 13). The distinctive shapes of the IMFs in IC 348 and Taurus are reflected in the distributions of spectral types, which should comprise good observational proxies of the IMFs (Luhman et al. (2003b); Figure 12). These significant differences between Taurus and the other two clusters remain regardless of the degree of incompleteness in the Taurus IMF at 0.3-0.6 .
At stellar masses, Kroupa et al. (2003) found that the IMF for unresolved systems from their standard model was nearly identical to the IMF for Taurus from Luhman et al. (2003a) and the IMF for the Orion from Muench et al. (2002). As a result, they concluded that these IMFs for Taurus and Orion “can be considered very similar if not identical” and “only in the substellar mass regime may the observations indicate different mass functions”. However, this is clearly not the case. As described above, the IMF for Taurus differs significantly from that of IC 348, which in turn closely matches the IMF for the Trapezium at stellar masses (Muench et al., 2002, 2003; Slesnick et al., 2004). This difference between Taurus and IC 348 has been shown to be highly statistically significant (Luhman et al., 2003b). As an additional illustration of the obvious differences in the IMFs between Taurus and the two other clusters, the Trapezium IMF from Muench et al. (2002) is shown with the mass functions of Taurus and IC 348 in Figure 13. The distinct nature of the IMF in Taurus is also evident in the distribution of spectral types in Figure 12, as pointed out by Luhman et al. (2003b).
5.2 Model Predictions for the IMF
A simple theoretical explanation for the above variations in the IMF was offered along with the data by Briceño et al. (2002) and Luhman et al. (2003b). These authors suggested that the lower brown dwarf fraction and higher peak mass in Taurus relative to the Trapezium could reflect differences in the typical Jeans masses of the two regions. Other possible sources for these variations are investigated in this section.
5.2.1 Ejection
Kroupa & Bouvier (2003b) simulated the brown dwarf fractions in the Trapezium and Taurus under the assumption that the brown dwarfs form through ejection with the same one-dimensional velocity dispersion, , in each region. This model predicted that ejected brown dwarfs remain in the Trapezium for km s-1 and escape a field in Taurus for km s-1. At km s-1, the simulated brown dwarf fractions in the Trapezium and in Taurus fields agreed with the measurements available at that time. As a result, Kroupa & Bouvier (2003b) suggested that the lower brown dwarf fraction in the Taurus aggregates relative to the Trapezium may be due to the formation of brown dwarfs via ejection, and that a distributed population of predominantly single brown dwarfs may exist outside of the fields surveyed in Taurus. To account for a “disconcerting discrepancy” between the brown dwarf fractions in star-forming regions () and the galactic field (), Kroupa & Bouvier (2003b) also examined a variation of this model in which the ejection process is not identical in all regions. In this scenario, brown dwarfs and stars form in roughly equal numbers in Taurus, but most of the brown dwarfs escape to sufficient distances that they are missed by current surveys. Meanwhile, brown dwarfs are produced at a quarter of the rate of stars in the Trapezium, most of which are retained in the cluster and thus counted in observations. This model would indicate that the brown dwarfs in the field are predominantly formed in low-density regions like Taurus. In search of further support for the ejection model for brown dwarf formation, Kroupa & Bouvier (2003b) and Kroupa et al. (2003) contended that brown dwarfs do not share the same general formation history of stars because their binary properties are not a natural extension of those of low-mass stars.
Two aspects of these hypotheses from Kroupa & Bouvier (2003b) and Kroupa et al. (2003) warrant discussion:
First, Kroupa & Bouvier (2003b) referred to a deficiency of brown dwarfs in star-forming regions relative to the field, but this deficiency is not supported by the available data. They quoted brown dwarf fractions of 0.25 and 1 for star-forming regions and the field, referencing the various studies of the Trapezium and the analysis of field data by Chabrier (2002). However, a comparison of substellar mass functions of young clusters and the field in terms of power-law slopes is preferable to a comparison of brown dwarf fractions because the fractions reported for clusters apply to a brown dwarfs at -0.08, whereas the field fraction from Chabrier (2002) includes the entire mass range for brown dwarfs. Furthermore, the brown dwarf fraction for the field depends on the functional form and the lower limit of the substellar IMF, both of which must be adopted as they are unconstrained by the field data. Indeed, Chabrier (2003) found that the log-normal IMF from Chabrier (2002) implied more brown dwarfs by a factor of three than observed in recent field surveys. He offered several plausible explanations, and an additional possibility is simply that the log-normal functional form used to fit the stellar sources is not appropriate for the substellar regime. When substellar mass functions are instead compared in terms of power-law slopes (Salpeter is 1.35), the latest constraints in the field from Chabrier (2002) () and Allen et al. (2004) () are consistent with the mildly negative slopes exhibited by the data for star-forming regions, such as in Figure 13.
Second, the conclusion by Kroupa et al. (2003) and Kroupa & Bouvier (2003b) that separate formation mechanism are reflected in distinct binary properties for stars and brown dwarfs is based on a questionable interpretation of the published data. In their Figure 5, Kroupa et al. (2003) plotted binary fraction as a function of mass as measured in multiplicity surveys of field stars. They interpreted the data as indicating one value for stars and a much lower value for brown dwarfs. However, if those data are allowed to speak for themselves, they indicate a declining fraction with primary mass among the stars from G (57%) to K (45%) to early and mid M (42%). This trend is even more pronounced after adding the data for M dwarfs (35%) from the 8 pc sample of Reid & Gizis (1997). Kroupa et al. (2003) excluded the data of Reid & Gizis (1997) from their analysis because of incompleteness, referencing Henry et al. (1997). In doing so, Kroupa et al. (2003) did not account for the effort expended in the years since that study in obtaining a complete census of single and companion stars in the solar neighborhood (Reid et al., 2003a, b). These latest surveys indicate only minor incompleteness (%) in the current 8 pc sample, which has not changed significantly from the sample considered by Reid & Gizis (1997). For types later than M8, the observed binary fraction of % (Reid et al., 2001; Bouy et al., 2003; Burgasser et al., 2003; Close et al., 2003; Gizis et al., 2003) can be reasonably described as a natural extension of the decreasing binary fraction with primary mass evident among field stars, particularly given that those measurements of objects later than M8 apply only to separations beyond AU and thus represent lower limits. Indeed, a decrease in binary fraction with primary mass of this kind is expected from simple random pairing from the same mass function without the presence of different formation mechanisms at high and low masses (Kroupa et al., 1993). Considering the continuous decrease in binary fraction with primary mass and the fact that the late-M, L, and T samples consist of both low-mass stars and brown dwarfs, there is no evidence among these data for distinct binary properties among brown dwarfs that would indicate a formation mechanism separate from that of stars.
When interpreting the observed IMF of brown dwarfs in Taurus and the Trapezium, in addition to ejection models, Kroupa et al. (2003) also examined a scenario in which stars and brown dwarfs form in the same manner. Through their simulations, they found that if populations at the densities of Taurus and the Trapezium are initially given the same initial brown dwarf fractions, that disruption of binaries in the latter over time could produce an excess of free-floating brown dwarfs relative to the low-density Taurus aggregates, whose companion brown dwarfs remain bound and undisturbed. Kroupa et al. (2003) therefore suggested that the observed differences in brown dwarf fractions between Taurus and the Trapezium may not reflect variations in the IMF. This is a distinct possibility, particularly given the reduced difference in brown dwarf fractions for these two regions from the latest measurements. However, the analysis of Kroupa et al. (2003) considered only the Trapezium and Taurus and did not attempt to match observations in other clusters such as IC 348, which has a similar observed brown dwarf fraction as Taurus even with a stellar density that is higher by two orders of magnitude.
5.2.2 Fragmentation
In an attempt to account for the IMF variations between Taurus and Orion, Goodwin et al. (2004) performed hydrodynamical simulations of the collapse and fragmentation of Taurus-like cores. The IMF produced by their model of Taurus could be characterized by a log-normal distribution centered at just under a solar mass plus a flat distribution below 0.5 . Most of the objects in the former population remained in multiple systems within cores, while the latter sources were predominantly ejected from the cores. These ejected objects consisted of both brown dwarfs and stars with mass-independent velocities of 1-2 km s-1, resulting in similar spatial distributions at stellar and substellar masses. Both the IMF and spatial distribution of stars and brown dwarfs produced by this model are in reasonable agreement with the measurements for Taurus. Goodwin et al. (2004) concluded that the high value of the peak mass in Taurus was a reflection of the properties of cores in the region, which is essentially the same as the explanation from Briceño et al. (2002) and Luhman et al. (2003b). Those authors suggested that the different average Jeans masses between Taurus and denser clusters resulted in the shift in peak mass, which in the model of Goodwin et al. (2004) appears in the form of the adopted core mass function.
Other recent hydrodynamical simulations have made predictions regarding the IMF of stars and brown dwarfs as well. In a model of the fragmentation of a turbulent cloud, Bate et al. (2003) derived an IMF that was characterized by a power law at high masses and a flattening (in logarithmic units) somewhere below a solar mass into the substellar regime, which is consistent with the observations of star-forming regions. Variations of the IMF have been explored in the subsequent simulations of Delgado-Donate et al. (2004), who considered the formation of stellar groups for different turbulent velocity fields. They found that the predicted substellar IMF was dependent on the adopted turbulent field, but the stellar IMF was not. Thus, while this model might account for differences in the brown dwarf fractions among the Trapezium, IC348, and Taurus, the predicted invariance of the stellar IMF is not observed, at least between Taurus and other regions. In contrast, in the turbulent model of Padoan & Nordlund (2002), the peak mass of the IMF does change with the level of turbulence, which is in better agreement with the data.
5.2.3 Photoevaporation
Through measurements of UV excesses with , Robberto et al. (2004) derived accretion rates for a sample of stars in the center of the Trapezium, which they found to be systematically lower than rates estimated for members of Taurus. They attributed this difference in accretion rates to the accelerated evaporation of circumstellar disks that results from the ionizing radiation from the Trapezium OB stars. Robberto et al. (2004) suggested that such suppression of accretion in the Trapezium might be responsible for the excess of brown dwarfs in the Trapezium relative to the Taurus. This hypothesis remains plausible when IC 348 is considered, which is another population that lacks photo-ionizing stars and exhibits a lower brown dwarf fraction than the Trapezium. Kroupa & Bouvier (2003b) and Whitworth & Zinnecker (2004) have provided qualitative theoretical support for the viability of this scenario.
5.2.4 Magnetic Tension
A new theoretical discussion of a possible origin of the IMF has been presented by Shu et al. (2004). In their model of star formation, magnetic tension in cloud cores helps define the final masses of stars and brown dwarfs. While reviewing the available observational constraints for their predictions, they suggested that the observed IMFs in Taurus and denser clusters are the same, citing Kenyon & Hartmann (1995) for the Taurus data. As a result, they did not investigate in detail whether their model could account for the variations in the peak mass found in newer measurements of Taurus (Briceño et al., 2002; Luhman et al., 2003a) and denser star-forming clusters (Hillenbrand & Carpenter, 2000; Muench et al., 2002, 2003; Luhman et al., 2003b; Slesnick et al., 2004). Shu et al. (2004) did predict that the peak mass and relative numbers of stars and brown dwarfs could change with star-forming conditions, and so it remains possible that this model could reproduce the observed variations in the IMF discussed in this work.
6 Conclusions
Searches for young low-mass stars and brown dwarfs in Taurus have covered a steadily increasing fraction of this low-density, dispersed star-forming region (Strom & Strom, 1994; Briceño et al., 1998; Luhman & Rieke, 1998; Luhman, 2000; Martín et al., 2001; Briceño et al., 2002; Luhman et al., 2003a). I have presented a new installment in this series of surveys, the results of which are summarized as follows:
-
1.
By combining new and images with near-IR photometry from 2MASS for two regions encompassing a total area of 4 deg2, I have constructed extinction-corrected color-magnitude diagrams and used them to select candidate members. I also have drawn an initial sample of candidates from a survey of 225 deg2 encompassing all of the Taurus star-forming region. Through spectroscopy of these two sets of candidates, I have established that 22 of these sources are new bonafide members of Taurus with spectral types of M4.5-M9.25, corresponding to masses of 0.3-0.015 according to the theoretical evolutionary models of Baraffe et al. (1998) and Chabrier et al. (2000). The mass estimates for seven of these new members are below the hydrogen burning mass limit.
-
2.
Several of the new members exhibit signatures of accretion, outflows, and circumstellar material in the form of emission in permitted lines (H, He I, Ca II) and blue continuum, forbidden transitions ([O I], [S II]), and the near-IR bands. This sample includes the least massive objects known to show forbidden line emission, which indicates that processes such as outflows that are common for young stars also occur among young brown dwarfs.
- 3.
-
4.
For the known members of Taurus within the new 4 deg2 area, I have estimated extinctions, effective temperatures, and bolometric luminosities and have used these results to place the members on the H-R diagram and estimate individual masses with evolutionary models. I have constructed an IMF from an extinction-limited sample of known members () in the area totaling 12.4 deg2 that has been surveyed here and in the previous studies cited above. This IMF peaks at a higher mass (0.8 ) than the mass functions in IC 348 and Orion (0.1-0.2 ), which is in agreement with the results from the earlier surveys of Taurus. Because of a slightly higher brown dwarf fraction in the latest IMF for Taurus and a lower brown dwarf fraction in the new spectroscopic IMF for the Trapezium from Slesnick et al. (2004), Taurus now appears less deficient in brown dwarfs relative to the Trapezium than previously reported (-1.8 versus ). Meanwhile, the brown dwarf fraction in Taurus is similar to that observed for IC 348.
-
5.
The spatial distribution of the new low-mass stars and brown dwarfs closely matches that of the more massive members, which is consistent the results of previous surveys of Taurus.
-
6.
Contrary to statements of Kroupa et al. (2003) and Kroupa & Bouvier (2003b), published data show no evidence for either 1) a difference in the relative numbers of brown dwarfs and stars between the field and star-forming regions or 2) a discontinuity in the binary fraction between stars and brown dwarfs in the field.
-
7.
Based on the previous two conclusions, I find no evidence to support the hypothesis that brown dwarfs form through ejection.
-
8.
Some fragmentation models appear to reproduce the variation in the IMF peak mass observed between Taurus and other star-forming clusters like the Trapezium and IC 348 (Padoan & Nordlund, 2002). Meanwhile, the excess of brown dwarfs in the Trapezium relative to IC 348 and Taurus may result from the suppression of accretion by disk photoevaporation for sources near the Trapezium’s OB stars, as recently proposed by Robberto et al. (2004).
References
- Allen et al. (2004) Allen, P. R., Koerner, D. W., & Reid, I. N. 2004, ApJ, submitted
- Baraffe et al. (1998) Baraffe, I., Chabrier, G., Allard, F., & Hauschildt, P. H. 1998, A&A, 337, 403
- Barrado y Navascués (2004) Barrado y Navascués, D. 2004, A&A, 422, 631
- Barrado y Navascués et al. (2004) Barrado y Navascués, D., Mohanty, S., & Jayawardhana, R. 2004, ApJ, 604, 284
- Bate et al. (2002) Bate, M. R., Bonnell, I. A., & Bromm, V. 2002, MNRAS, 332, L65
- Bate et al. (2003) Bate, M. R., Bonnell, I. A., & Bromm, V. 2003, MNRAS, 339, 577
- Beristain et al. (2001) Beristain, G., Edwards, S., & Kwan, J. 2001, ApJ, 551, 1037
- Bessell & Brett (1988) Bessell, M. S., & Brett, J. M. 1988, PASP, 100, 1134
- Boss (2001) Boss, A. 2001, ApJ, 551, L167
- Bouy et al. (2003) Bouy, H., Brandner, W., Martín, E. L., Delfosse, X., Allard, F., & Basri, G. 2003, AJ, 126, 1526
- Briceño et al. (1999) Briceño, C., Calvet, N., Kenyon, S., & Hartmann, L. 1999, AJ, 118, 1354
- Briceño et al. (1998) Briceño, C., Hartmann, L., Stauffer, J., & Martín, E. L., 1998, AJ, 115, 2074
- Briceño et al. (2002) Briceño, C., Luhman, K. L., Hartmann, L., Stauffer, J. R., & Kirkpatrick, J. D. 2002, ApJ, 580, 317
- Burgasser et al. (2003) Burgasser, A. J., Kirkpatrick, J. D., Reid, I. N., Brown, M. E., Miskey, C. L., & Gizis, J. E. 2003, ApJ, 586, 512
- Cardelli et al. (1989) Cardelli, J. A., Clayton, G. C., & Mathis, J. S. 1989, ApJ, 345, 245
- Chabrier (2002) Chabrier, G. 2002, ApJ, 567, 304
- Chabrier (2003) Chabrier, G. 2003, PASP, 115, 763
- Chabrier et al. (2000) Chabrier, G., Baraffe, I. Allard, F., & Hauschildt, P. H. 2000, ApJ, 542, 464
- Close et al. (2003) Close, L. M., Siegler, N., Freed, M., & Biller, B. 2003, ApJ, 587, 407
- Comerón et al. (1998) Comerón, F., Rieke, G. H., Claes, P., Torra, J., & Laureijs, R. J. 1998, A&A, 335, 522
- Delgado-Donate et al. (2004) Delgado-Donate, E. J., Clarke, C. J., & Bate, M. R. 2004, MNRAS, 347, 759
- Fernández & Comerón (2001) Fernández, M., & Comerón, F. 2001, A&A, 380, 264
- Gizis et al. (2000) Gizis, J. E., Monet, D. G., Reid, I. N., Kirkpatrick, J. D., Liebert, J., & Williams, R. J. 2000, AJ, 120, 1085
- Gizis et al. (2002) Gizis, J. E., Reid, I. N., & Hawley, S. L. 2002, AJ, 123, 3356
- Gizis et al. (2003) Gizis, J. E., Reid, I. N., Knapp, G. R., Liebert, J., Kirkpatrick, J. D., Koerner, D. W., & Burgasser, A. J. 2003, AJ, 125, 3302
- Goodwin et al. (2004) Goodwin, S. P., Whitworth, A. P., & Ward-Thompson, D. 2004, A&A, 419, 543
- Hartigan et al. (1995) Hartigan, P., Edwards, S., & Ghandour, L. 1995, ApJ, 452, 736
- Hartigan et al. (1994) Hartigan, P., Strom, K. M., & Strom, S. E. 1994, ApJ, 427, 961
- Henry et al. (1997) Henry, T. J., Ianna, P. A., Kirkpatrick, J. D., & Jahreiss, H. 1997, AJ, 114, 388
- Hillenbrand & Carpenter (2000) Hillenbrand, L. A., & Carpenter, J. M. 2000, ApJ, 540, 236
- Itoh et al. (1996) Itoh, Y., Tamura, M., & Gatley, I. 1996, ApJ, 465, L129
- Itoh et al. (1999) Itoh, Y., Tamura, M., & Nakajima, T. 1999, AJ, 117, 1471
- Kenyon et al. (1994) Kenyon, S. J., Gómez, M., Marzke, R. O., & Hartmann, L. 1994, ApJ, 107, 2153
- Kenyon & Hartmann (1995) Kenyon, S. J., & Hartmann, L. 1995, ApJS, 101, 117
- Kenyon et al. (1998) Kenyon, S. J., Brown, D. I., Tout, C. A., & Berlind, P. 1998, AJ, 115, 2491
- Kirkpatrick et al. (1997) Kirkpatrick, J. D., Henry, T. J., & Irwin, M. J. 1997, AJ, 113, 1421
- Kroupa & Bouvier (2003a) Kroupa, P., & Bouvier, J. 2003a, MNRAS, 346, 343
- Kroupa & Bouvier (2003b) Kroupa, P., & Bouvier, J. 2003b, MNRAS, 346, 369
- Kroupa et al. (2003) Kroupa, P., Bouvier, J., Duchêne, G., & Moraux, E. 2003, MNRAS, 346, 354
- Kroupa et al. (1993) Kroupa, P., Tout, C. A., & Gilmore, G. 1993, MNRAS, 262, 545
- Landolt (1992) Landolt, A. U. 1992, AJ, 104, 340
- Leggett (1992) Leggett, S. K. 1992, ApJS, 82, 351
- Luhman (1999) Luhman, K. L. 1999, ApJ, 525, 466
- Luhman (2000) Luhman, K. L. 2000, ApJ, 544, 1044
- Luhman (2004) Luhman, K. L. 2004, ApJ, 602, 816
- Luhman et al. (2000) Luhman, K. L., et al. 2000, ApJ, 540, 1016
- Luhman & Rieke (1998) Luhman, K. L., & Rieke, G. H. 1998, ApJ, 497, 354
- Luhman et al. (2003a) Luhman, K. L., Briceño, C., Stauffer, J. R., Hartmann, L., Barrado y Navascués, D., & Nelson, C. 2003a, ApJ, 590, 348
- Luhman et al. (2003b) Luhman, K. L., Stauffer, J. R., Muench, A. A., Rieke, G. H., Lada, E. A., Bouvier, J., & Lada, C. J. 2003b, ApJ, 593, 1093
- Martín (2000) Martín, E. L. 2000, AJ, 120, 2114
- Martín et al. (2001) Martín, E. L., Dougados, C., Magnier, E., Ménard, F., Magazzù, A., Cuilandre, J.-C., & Delfosse, X. 2001, ApJ, 561, L195
- Martín et al. (1996) Martín, E. L., Rebolo, R., & Zapatero Osorio, M. R. 1996, ApJ, 469, 706
- Monin & Bouvier (2000) Monin, J.-L., & Bouvier, J. 2000, A&A, 356, L75
- Muench et al. (2002) Muench, A. A., Lada, E. A., Lada, C. J., & Alves, J. 2002, ApJ, 573, 366
- Muench et al. (2003) Muench, A. A., et al. 2003, AJ, 125, 2029
- Muzerolle et al. (1998) Muzerolle, J., Hartmann, L., & Calvet, N. 1998, AJ, 116, 455
- Muzerolle et al. (2003) Muzerolle, J., Hillenbrand, L., Calvet, N., Briceño, C., & Hartmann, L. 2003, ApJ, 592, 266
- Muzerolle et al. (2004) Muzerolle, J., et al. 2004, in preparation
- Padoan & Nordlund (2002) Padoan, P., & Nordlund, Å. 2002, ApJ, 576, 870
- Palla & Stahler (1999) Palla, F., & Stahler, S. W. 1999, ApJ, 525, 772
- Reid & Gizis (1997) Reid, I. N., & Gizis, J. E. 1997, AJ, 113, 2246
- Reid et al. (2001) Reid, I. N., Gizis, J. E., Kirkpatrick, J. D., & Koerner, D. W. 2001, AJ, 121, 489
- Reid et al. (2003a) Reid, I. N., et al. 2003a, AJ, 125, 354
- Reid et al. (2003b) Reid, I. N., et al. 2003b, AJ, 126, 3007
- Reipurth & Clarke (2001) Reipurth, B. & Clarke, C. 2001, AJ, 122, 432
- Rieke & Lebofsky (1985) Rieke, G. H., & Lebofsky, M. J. 1985, ApJ, 288, 618
- Robberto et al. (2004) Robberto, M., Song, J., Mora Carrillo, G., Beckwith, S. V. W., Makidon, R. B., & Panagia, N. 2004, ApJ, 606, 952
- Schmidt-Kaler (1982) Schmidt-Kaler, T. 1982, in Landolt-Bornstein, Group VI, Vol. 2, ed. K.-H. Hellwege (Berlin: Springer), 454
- Shu et al. (2004) Shu, F. H., Li, Z.-Y., & Allen, A. 2004, ApJ, 601, 930
- Slesnick et al. (2004) Slesnick, C. L., Hillenbrand, L. A., & Carpenter, J. M. 2004, ApJ, 610, 1045
- Steffen et al. (2001) Steffen, A. T., et al. 2001, AJ, 122, 997
- Strom & Strom (1994) Strom, K. M., & Strom, S. E. 1994, ApJ, 424, 237
- White & Basri (2003) White, R. J., & Basri, G. 2003, ApJ, 582, 1109
- White & Ghez (2001) White, R. J., & Ghez, A. M. 2001, ApJ, 556, 265
- White et al. (1999) White, R. J., Ghez, A. M., Reid, I. N., & Schultz, G. 1999, ApJ, 520, 811
- Whitworth & Zinnecker (2004) Whitworth, A. P., & Zinnecker, H. 2004, A&A, 427, 299
- Wichmann et al. (1998) Wichmann, R., Bastian, U., Krautter, J., Jankovics, I., & Ruciński, S. M. 1998, MNRAS, 301, L39
| Grating | Resolution | |||
|---|---|---|---|---|
| Night | Date | Telescope + Instrument | (lines mm-1) | (Å) |
| 1 | 2003 Dec 14 | MMT + Red Channel | 270 | 10 |
| 2 | 2003 Dec 15 | MMT + Red Channel | 270 | 10 |
| 3 | 2004 Jan 9 | Magellan I + IMACS | 200 | 8 |
| 4 | 2004 Jan 10 | Magellan I + IMACS | 200 | 8 |
| 2MASS | (J2000)aa2MASS Point Source Catalog. | (J2000)aa2MASS Point Source Catalog. | bbThis work and Briceño et al. (2002). | aa2MASS Point Source Catalog. | aa2MASS Point Source Catalog. | aa2MASS Point Source Catalog. | Night |
|---|---|---|---|---|---|---|---|
| J04110699+2836226 | 04 11 06.99 | 28 36 22.6 | 0.72 | 0.39 | 12.13 | 2 | |
| J04135549+2823058 | 04 13 55.50 | 28 23 05.9 | 0.75 | 0.35 | 11.16 | 2 | |
| J04173190+2840295 | 04 17 31.91 | 28 40 29.5 | 0.83 | 0.42 | 11.91 | 2 | |
| J04174047+2809529 | 04 17 40.47 | 28 09 53.0 | 15.47 | 1.36 | 0.57 | 10.67 | 2 |
| J04184767+2834011 | 04 18 47.67 | 28 34 01.2 | 13.51 | 1.19 | 0.47 | 9.65 | 2 |
| J04185791+2830520 | 04 18 57.92 | 28 30 52.0 | 1.43 | 0.59 | 10.70 | 1 | |
| J04205343+2913401 | 04 20 53.44 | 29 13 40.1 | 0.65 | 0.37 | 12.60 | 4 | |
| J04215823+2657147 | 04 21 58.23 | 26 57 14.7 | 0.93 | 0.49 | 12.14 | 2 | |
| J04261082+2620442 | 04 26 10.82 | 26 20 44.3 | 13.83 | 0.96 | 0.38 | 10.43 | 2 |
| J04305971+1804237 | 04 30 59.72 | 18 04 23.7 | 0.95 | 0.38 | 10.28 | 1 | |
| J04314495+2327555 | 04 31 44.96 | 23 27 55.5 | 0.90 | 0.50 | 11.48 | 2 | |
| J04331329+2606298 | 04 33 13.29 | 26 06 29.9 | 0.78 | 0.42 | 11.38 | 2 | |
| J04340640+2609471 | 04 34 06.41 | 26 09 47.1 | 14.27 | 1.27 | 0.48 | 10.08 | 2 |
| J04344110+2701259 | 04 34 41.10 | 27 01 26.0 | 0.75 | 0.37 | 11.11 | 2 | |
| J04390241+2536203 | 04 39 02.41 | 25 36 20.3 | 12.48 | 0.64 | 0.30 | 9.79 | 1 |
| J04391868+2537325 | 04 39 18.68 | 25 37 32.5 | 15.54 | 0.90 | 0.44 | 11.77 | 1 |
| J04392527+2539476 | 04 39 25.27 | 25 39 47.6 | 16.24 | 1.23 | 0.60 | 11.22 | 1 |
| J04400458+2527313 | 04 40 04.59 | 25 27 31.3 | 17.86 | 1.42 | 0.73 | 12.05 | 4 |
| J04401534+2522106 | 04 40 15.35 | 25 22 10.7 | 14.77 | 1.12 | 0.57 | 10.13 | 1 |
| J04402642+2613482 | 04 40 26.42 | 26 13 48.3 | 15.37 | 0.92 | 0.53 | 11.47 | 1 |
| J04411028+2539342 | 04 41 10.28 | 25 39 34.2 | 14.46 | 0.82 | 0.41 | 11.15 | 1 |
| J04411955+2536174 | 04 41 19.55 | 25 36 17.5 | 18.88 | 0.72 | 0.74 | 14.80 | 4 |
| J04422817+2524357 | 04 42 28.18 | 25 24 35.7 | 14.46 | 0.79 | 0.41 | 11.18 | 1 |
| J04422824+2535246 | 04 42 28.24 | 25 35 24.7 | 14.34 | 0.74 | 0.46 | 11.07 | 1 |
| J04425686+2610546 | 04 42 56.87 | 26 10 54.7 | 13.69 | 0.58 | 0.32 | 11.12 | 1 |
| J04425863+2515295 | 04 42 58.64 | 25 15 29.6 | 13.70 | 0.67 | 0.34 | 10.86 | 1 |
| J04425891+2519061 | 04 42 58.91 | 25 19 06.2 | 13.91 | 0.57 | 0.32 | 11.35 | 2 |
| Membership | ||||||||||||||
|---|---|---|---|---|---|---|---|---|---|---|---|---|---|---|
| 2MASS | (J2000)aa2MASS Point Source Catalog. | (J2000)aa2MASS Point Source Catalog. | Spectral TypebbUncertainties are subclass unless noted otherwise. | EvidenceccMembership in Taurus is indicated by and a position above the main sequence for the distance of Taurus (“”), strong emission lines (“e”), or Na I and K I strengths intermediate between those of dwarfs and giants (“NaK”). | ddTemperature scale from Luhman et al. (2003b). | eeThis work. | eeThis work. | aa2MASS Point Source Catalog. | aa2MASS Point Source Catalog. | aa2MASS Point Source Catalog. | In IMF?ffIndicates whether each object is included in the IMF in Figure 13 (§ 4.2). | Night | ||
| J04141188+2811535 | 04 14 11.88 | 28 11 53.5 | M6.250.5 | ,NaK,e | 2962 | 0.28 | 0.015 | 0.83 | 0.69 | 11.64 | yes | 2 | ||
| J04161210+2756385 | 04 16 12.10 | 27 56 38.6 | M4.75 | ,NaK | 3161 | 0.56 | 0.054 | 1.16 | 0.78 | 10.34 | yes | 2 | ||
| J04163048+3037053 | 04 16 30.49 | 30 37 05.3 | M4.5 | NaK | 3198 | 0.21 | 0.011 | 0.65 | 0.35 | 12.62 | no | 4 | ||
| J04202555+2700355 | 04 20 25.55 | 27 00 35.5 | M5.25 | ,NaK,e | 3091 | 0.56 | 0.029 | 0.86 | 0.50 | 11.51 | no | 2 | ||
| J04213459+2701388 | 04 21 34.60 | 27 01 38.9 | M5.5 | ,NaK | 3058 | 0.49 | 0.065 | 0.93 | 0.53 | 10.44 | no | 2 | ||
| J04284263+2714039 | 04 28 42.63 | 27 14 03.9 | M5.25 | NaK | 3091 | 0.14 | 0.040 | 1.04 | 0.61 | 10.46 | no | 2 | ||
| J04380083+2558572ggITG2. | 04 38 00.84 | 25 58 57.2 | M7.25 | NaK | 2838 | 0.17 | 0.060 | 14.71 | 1.27 | 0.92 | 0.53 | 10.10 | yes | 1 |
| J04381486+2611399 | 04 38 14.86 | 26 11 39.9 | M7.25 | NaK,e | 2838 | 0.00 | 0.0018 | 17.84 | 1.09 | 1.05 | 1.15 | 12.98 | yes | 1 |
| J04390396+2544264 | 04 39 03.96 | 25 44 26.4 | M7.25 | NaK,e | 2838 | 0.07 | 0.020 | 15.63 | 1.22 | 0.81 | 0.47 | 11.37 | yes | 1 |
| J04403979+2519061 | 04 40 39.79 | 25 19 06.1 | M5.25 | ,NaK | 3091 | 0.70 | 0.087 | 14.80 | 1.05 | 1.03 | 0.55 | 10.24 | yes | 1 |
| J04411078+2555116hhITG34. | 04 41 10.79 | 25 55 11.7 | M5.5 | ,NaK,e | 3058 | 0.70 | 0.024 | 16.24 | 0.99 | 1.07 | 0.67 | 11.45 | yes | 1 |
| J04414825+2534304 | 04 41 48.25 | 25 34 30.5 | M7.75 | NaK,e | 2752 | 0.28 | 0.0092 | 17.03 | 1.24 | 0.93 | 0.58 | 12.22 | yes | 1 |
| J04442713+2512164iiIRAS 04414+2506 from Kenyon et al.(1994). | 04 44 27.13 | 25 12 16.4 | M7.25 | NaK,e | 2838 | 0.00 | 0.028 | 0.84 | 0.60 | 10.76 | no | 2 | ||
| J04552333+3027366 | 04 55 23.33 | 30 27 36.6 | M6.25 | NaK | 2962 | 0.00 | 0.013 | 15.55 | 1.02 | 0.68 | 0.42 | 11.97 | yes | 2 |
| J04554046+3039057 | 04 55 40.46 | 30 39 05.7 | M5.25 | NaK | 3091 | 0.07 | 0.021 | 14.71 | 0.76 | 0.64 | 0.30 | 11.77 | yes | 1 |
| J04554535+3019389 | 04 55 45.35 | 30 19 38.9 | M4.75 | NaK | 3161 | 0.00 | 0.068 | 13.19 | 0.65 | 0.65 | 0.33 | 10.46 | yes | 1 |
| J04554757+3028077 | 04 55 47.57 | 30 28 07.7 | M4.75 | NaK | 3161 | 0.00 | 0.098 | 13.01 | 0.75 | 0.74 | 0.33 | 9.98 | yes | 3 |
| J04554801+3028050 | 04 55 48.01 | 30 28 05.0 | M5.6 | NaK | 3044 | 0.00 | 0.012 | 15.20 | 0.87 | 0.59 | 0.43 | 12.15 | yes | 3 |
| J04554969+3019400 | 04 55 49.70 | 30 19 40.0 | M6 | NaK | 2990 | 0.00 | 0.016 | 15.02 | 0.88 | 0.58 | 0.37 | 11.86 | yes | 1 |
| J04555288+3006523 | 04 55 52.89 | 30 06 52.3 | M5.25 | NaK | 3091 | 0.00 | 0.054 | 13.70 | 0.74 | 0.61 | 0.30 | 10.73 | yes | 1 |
| J04555636+3049374 | 04 55 56.37 | 30 49 37.5 | M5 | NaK | 3125 | 0.10 | 0.044 | 13.85 | 0.69 | 0.61 | 0.30 | 11.09 | yes | 1 |
| J04574903+3015195 | 04 57 49.03 | 30 15 19.5 | M9.25 | NaK | 2350 | 0.00 | 0.0011 | 19.25 | 1.40 | 0.65 | 0.64 | 14.48 | yes | 1 |
| ID | (J2000)aa2MASS Point Source Catalog except for HV Tau C, whose coordinates relative to HV Tau AB are from White & Ghez (2001). | (J2000)aa2MASS Point Source Catalog except for HV Tau C, whose coordinates relative to HV Tau AB are from White & Ghez (2001). | Spectral Type | Ref | Adopt | bbTemperature scale from Schmidt-Kaler (1982) (M0) and Luhman et al. (2003b) (M0). | Ref | aa2MASS Point Source Catalog except for HV Tau C, whose coordinates relative to HV Tau AB are from White & Ghez (2001). | aa2MASS Point Source Catalog except for HV Tau C, whose coordinates relative to HV Tau AB are from White & Ghez (2001). | aa2MASS Point Source Catalog except for HV Tau C, whose coordinates relative to HV Tau AB are from White & Ghez (2001). | In IMF?ccIndicates whether each object is included in the IMF in Figure 13 (§ 4.2). | ||||
|---|---|---|---|---|---|---|---|---|---|---|---|---|---|---|---|
| LkCa 14 | 04 36 19.09 | 25 42 59.0 | M0 | 1 | M0 | 3850 | 0.00 | 0.65 | 0.62 | 0.13 | 8.58 | yes | |||
| GM Tau | 04 38 21.34 | 26 09 13.7 | C,M6.5 | 1,2 | M6.5 | 2935 | 1.15 | 0.047 | 15.04 | 3 | 1.22 | 0.95 | 10.63 | no | |
| DO Tau | 04 38 28.58 | 26 10 49.4 | M0 | 1 | M0 | 3850 | 0.66 | 1.1 | 1.24 | 11.30 | 1,3 | 1.23 | 0.94 | 7.30 | yes |
| HV Tau A+B | 04 38 35.28 | 26 10 38.6 | M1 | 1 | M1 | 3705 | 0.62 | 1.2 | 11.41 | 3 | 0.94 | 0.38 | 7.91 | yes | |
| HV Tau C | 04 38 35.49 | 26 10 41.5 | no | ||||||||||||
| IRAS 04361+2547 | 04 39 13.89 | 25 53 20.9 | 3.42 | 2.30 | 10.72 | no | |||||||||
| GN Tau A+B | 04 39 20.91 | 25 45 02.1 | C,M2.5 | 1,2 | M2.5 | 3488 | 1.17 | 0.72 | 12.73 | 3 | 1.30 | 0.83 | 8.06 | no | |
| IRAS 04365+2535 | 04 39 35.19 | 25 41 44.7 | 2.92 | 10.84 | no | ||||||||||
| CFHT-BD-Tau J043947.3+260139 | 04 39 47.48 | 26 01 40.8 | M7 | 4,5 | M7 | 2880 | 0.70 | 0.054 | 15.78 | 3 | 1.16 | 0.68 | 10.33 | yes | |
| IC2087IR | 04 39 55.75 | 25 45 02.0 | 15.91 | 3 | 2.62 | 1.78 | 6.28 | no | |||||||
| IRAS 04370+2559 | 04 40 08.00 | 26 05 25.4 | 17.06 | 3 | 2.16 | 1.38 | 8.87 | no | |||||||
| JH 223 | 04 40 49.51 | 25 51 19.2 | M2 | 1 | M2 | 3560 | 0.14 | 0.18 | 12.37 | 3 | 0.83 | 0.43 | 9.49 | yes | |
| Haro 6-32 | 04 41 04.24 | 25 57 56.1 | M5 | 3 | M5 | 3125 | 0.17 | 0.12 | 13.01 | 3 | 0.68 | 0.31 | 9.95 | yes | |
| ITG 33A | 04 41 08.26 | 25 56 07.5 | M3 | 6 | M3 | 3415 | 1.89 | 0.051 | 16.39 | 3 | 1.59 | 1.06 | 11.09 | no | |
| IRAS 04381+2540 | 04 41 12.68 | 25 46 35.4 | 3.01 | 2.60 | 11.54 | no | |||||||||
| IRAS 04385+2550 | 04 41 38.82 | 25 56 26.8 | M0 | 7 | M0 | 3850 | 1.13 | 0.18 | 1.59 | 14.50 | 1,3 | 1.73 | 0.92 | 9.20 | yes |
| LkHa 332/G2A+B | 04 42 05.49 | 25 22 56.3 | K7 | 1 | K7 | 4060 | 0.99 | 1.1 | 1.5 | 11.99 | 8 | 1.12 | 0.44 | 8.23 | yes |
| LkHa 332/G1A+B | 04 42 07.33 | 25 23 03.2 | M1 | 1 | M1 | 3705 | 1.33 | 1.7 | 1.91 | 12.58 | 9 | 1.18 | 0.46 | 7.95 | no |
| V955 Tau A+B | 04 42 07.77 | 25 23 11.8 | K7,K5 | 1,9 | K5 | 4350 | 0.90 | 1.0 | 1.30 | 13.33 | 9 | 1.21 | 0.66 | 7.94 | yes |
| CIDA-7 | 04 42 21.02 | 25 20 34.4 | M2-M3? | 10 | ? | 13.55 | 3 | 0.82 | 0.41 | 10.17 | yes | ||||
| DP Tau | 04 42 37.70 | 25 15 37.5 | M0.5 | 1 | M0.5 | 3778 | 0.41 | 0.20 | 1.14 | 12.43 | 1,3 | 1.31 | 0.93 | 8.76 | yes |
| GO Tau | 04 43 03.10 | 25 20 18.8 | M0 | 1 | M0 | 3850 | 0.77 | 0.37 | 1.32 | 12.26 | 1,3 | 0.94 | 0.44 | 9.33 | yes |
| UY Aur A+B | 04 51 47.38 | 30 47 13.5 | K7 | 1 | K7 | 4060 | 0.44 | 1.2 | 1.09 | 10.83 | 1 | 1.15 | 0.75 | 7.24 | yes |
| IRAS 04489+3042 | 04 52 06.68 | 30 47 17.6 | M2 | 7 | M2 | 3560 | 3.50 | 0.13 | 17.88 | 3 | 2.40 | 1.64 | 10.38 | no | |
| GM Aur | 04 55 10.98 | 30 21 59.5 | K7 | 11 | K7 | 4060 | 0.00 | 0.67 | 0.72 | 10.50 | 1 | 0.74 | 0.32 | 8.28 | yes |
| LkCa 19 | 04 55 36.96 | 30 17 55.3 | K0 | 1 | K0 | 5250 | 0.24 | 1.7 | 0.57 | 9.68 | 1 | 0.55 | 0.17 | 8.15 | yes |
| AB Aur | 04 55 45.83 | 30 33 04.4 | B9 | 1 | B9 | 10500 | 0.24 | 137 | 0.11 | 6.85 | 1 | 0.87 | 0.83 | 4.23 | yes |
| SU Aur | 04 55 59.38 | 30 34 01.6 | G2 | 1 | G2 | 5860 | 0.21 | 9.9 | 0.52 | 8.10 | 1 | 0.64 | 0.57 | 5.99 | yes |
| HBC 427 | 04 56 02.02 | 30 21 03.8 | K7,K5 | 1,12 | K5 | 4350 | 0.17 | 1.1 | 0.76 | 10.05 | 1 | 0.64 | 0.19 | 8.13 | yes |
References. — (1) Kenyon & Hartmann (1995); (2) White & Basri (2003); (3) this work; (4) Martín et al. (2001); (5) Briceño et al. (2002); (6) Martín (2000); (7) Kenyon et al. (1998); (8) Hartigan et al. (1994); (9) White & Ghez (2001); (10) Briceño et al. (1999); (11) Hartigan et al. (1995); (12) Steffen et al. (2001).