A Survey for Low-Mass Stars and Brown Dwarfs in the Cha and Cha Young Associations 11affiliation: Based on observations performed at Las Campanas Observatory. This publication makes use of data products from the Two Micron All Sky Survey and the Deep Near-Infrared Survey of the Southern Sky.
Abstract
I present the results of a search for new low-mass stars and brown dwarfs in the Cha and Cha young associations. Within radii of and surrounding Cha and Cha, respectively, I have constructed color-magnitude diagrams from DENIS and 2MASS photometry and have obtained spectra of the candidate low-mass members therein. The five candidates in Cha are classified as four field M dwarfs and one carbon star. No new members are found in this survey, which is complete for -0.15 according to the evolutionary models of Chabrier and Baraffe. Thus, an extended population of low-mass members is not present in Cha out to four times the radius of the known membership. Meanwhile, the three candidate members of Cha are classified as young stars, and thus likely members of the association, based on Li absorption and gravity-sensitive absorption lines. These new sources have spectral types of M2.25, M3.75, and M5.75, corresponding to masses of 0.45, 0.25, and 0.09 by the models of Chabrier and Baraffe. For one of these stars, intense H emission, forbidden line emission, and strong -band excess emission suggest the presence of accretion, an outflow, and a disk, respectively. This young star is also much fainter than expected for an association member at its spectral type, which could indicate that it is seen in scattered light. No brown dwarfs are detected in Cha down to the completeness limit of 0.015 . The absence of brown dwarfs in these associations is statistically consistent with the mass functions measured in star-forming regions, which exhibit only and brown dwarfs for stellar samples at the sizes of the Cha and Cha associations.
1 Introduction
Complete samples of members of nearby young associations are important for constraining the origin and evolution of these populations (Mamajek et al., 2000) and for providing targets for detailed studies of star and planet formation (Calvet et al., 2002). Over the last few years, two of the nearest known groups of young stars ( pc) have been found surrounding the late-B stars Cha (Mamajek et al., 1999) and Cha (Feigelson et al., 2003) through astrometric, X-ray, and optical observations. These associations exhibit similar ages in the range of 3-10 Myr (Mamajek et al., 1999; Lawson et al., 2001; Luhman & Steeghs, 2004; Feigelson et al., 2003) and may have formed in the same molecular cloud complex as the Sco-Cen OB association (Mamajek et al., 2000). Since the initial 13 members were presented by Mamajek et al. (1999), the known membership of Cha has grown to a total of 18 systems through spectroscopy of candidates selected from optical images and data from the USNO-B1 and Two-Micron All-Sky Survey (2MASS) catalogs (Lawson et al., 2002; Lyo et al., 2004; Song et al., 2004; Luhman & Steeghs, 2004). These sources extend out to a radius of and exhibit a hint of mass segregation in which the less massive members tend to reside on the outskirts of the association. The more recently identified group of stars near Cha consists of five systems within a radius of , one of which has at least five components (Feigelson et al., 2003).
To check for the presence of an extended low-mass population in Cha beyond the radius of the survey from Luhman & Steeghs (2004), I have performed a new search for low-mass stars and brown dwarfs out to . I have also conducted a similar survey of an area within of Cha. In this paper, I select candidate members of the two associations through color-magnitude diagrams composed of data from DENIS and 2MASS (§ 2), measure their spectral types and assess their youth (§ 3), evaluate the completeness of the surveys (§ 4), place the known members of Cha on the Hertzsprung-Russell (H-R) diagram (§ 5), and discuss the implications of this work (§ 6).
2 Selection of Candidate Members of Cha and Cha
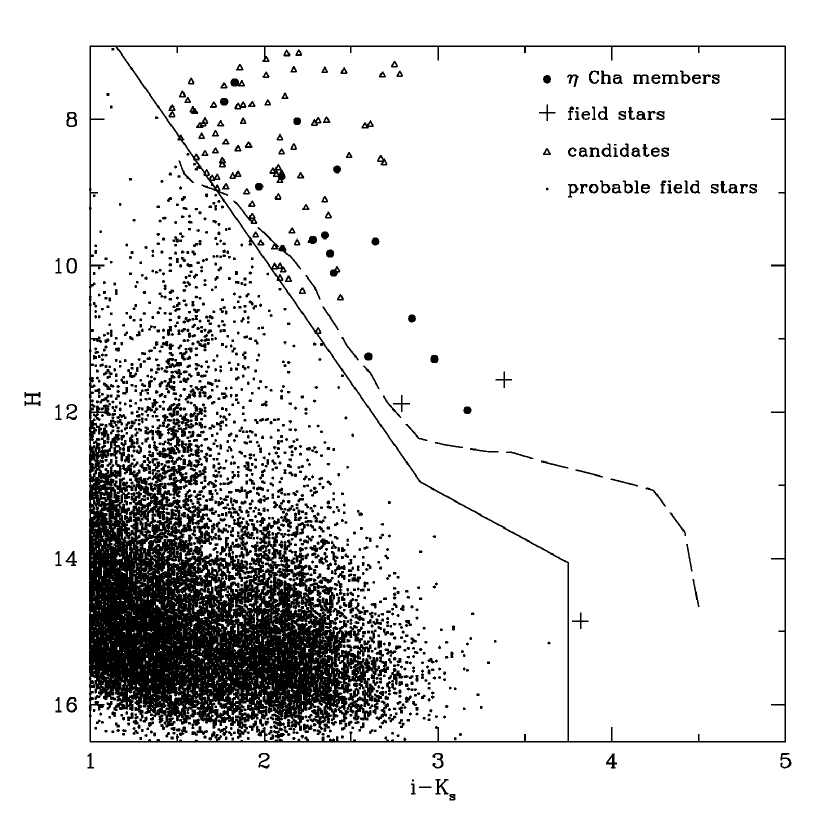
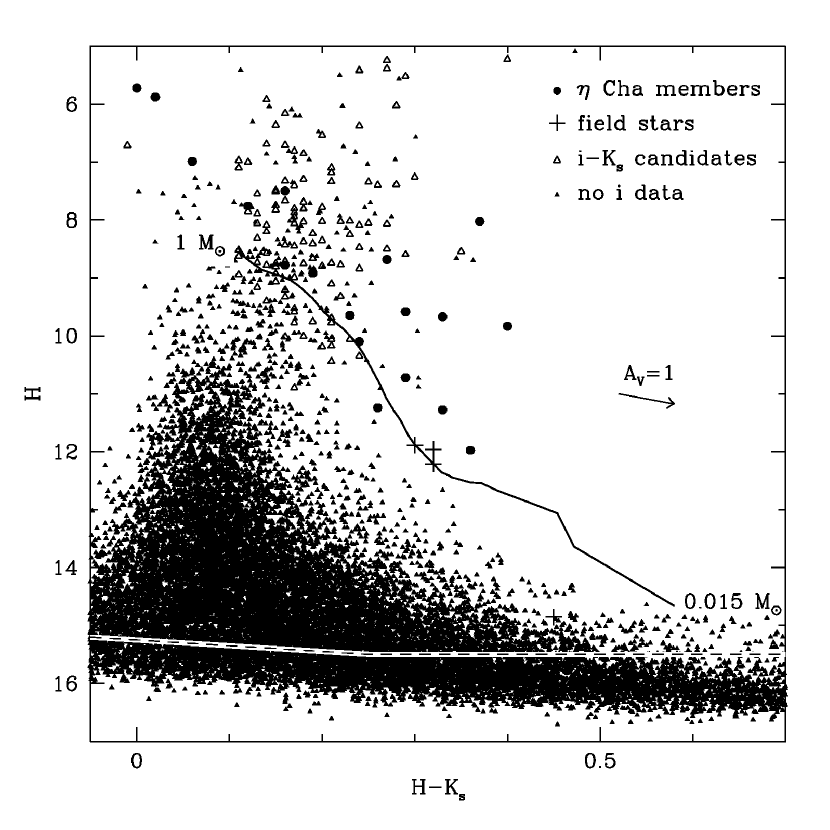
To search for new members of the Cha association, Luhman & Steeghs (2004) constructed a color-magnitude diagram of versus from the DENIS Second Release and the 2MASS Point Source Catalog, selected candidate members, and obtained spectroscopy to distinguish between field stars and bonafide members. They considered an area within a radius of centered at , (J2000). Two regions within that radius were not available from the DENIS Second Release, as illustrated in Figure 1. In this work, I repeat their analysis for a larger field with a radius of . Whereas Luhman & Steeghs (2004) used a diagram of versus only for evaluating completeness, I include it with versus in the selection of candidates because the and data from 2MASS are available for the entire survey field, unlike from the DENIS Second Release, which covers only half of the field. The diagrams of versus and versus are shown in Figures 2 and 3. Field stars identified with spectroscopy in previous studies are omitted from both diagrams. I plot the 10 Myr isochrone from Baraffe et al. (1998) for masses of 0.015 to 1 at a distance of 97 pc (Mamajek et al., 1999). This isochrone was converted to photometric magnitudes from predicted effective temperatures and bolometric luminosities in the manner described by Luhman et al. (2003a). In Figure 2, I include the boundary from Luhman & Steeghs (2004) for separating candidate members of Cha from likely field stars. In Figure 3, sources near the low-mass end of the isochrone that appear as galaxies in the Digitized Sky Survey have been excluded. Unlike Luhman & Steeghs (2004), I consider only candidates at low masses because the goal of this work is the detection of low-mass stars or brown dwarfs in the association beyond the previous search radius. In Figure 2, three candidate members have , corresponding to spectral types later than M4 and masses less than 0.2 for association members. The faintest and reddest candidate is well below the 10 Myr isochrone, and thus is a marginal candidate. The position of this star in Figure 3 is even more indicative of a field star, but it is nevertheless included in my spectroscopic sample. Meanwhile, the other two candidates appear as promising candidates in Figure 3, one of which is outside of the limits of the diagram at and . This source also exhibits an excess in versus . For the portion of the survey field unavailable at , the diagram of versus reveals two additional candidates at (typeM5, ), one at and and one at and .
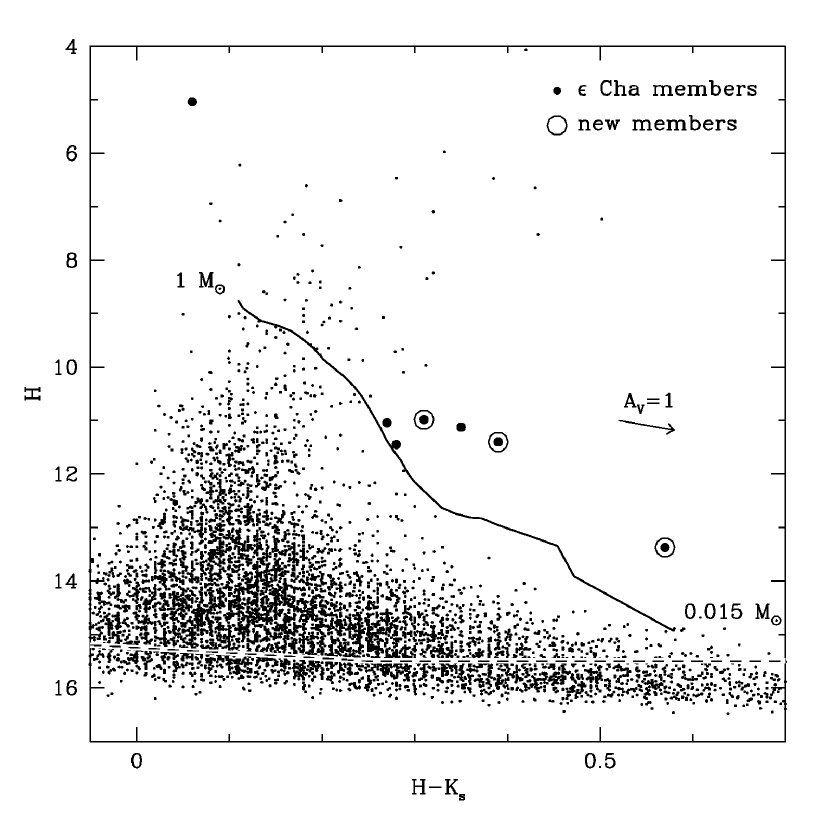
For my survey of the Cha association, I consider the area within a radius of surrounding the star Cha AB. This field is indicated in Figure 4, where I include the regions imaged with Chandra by Feigelson et al. (2003) and the known association members listed in that study. Because photometry from DENIS is unavailable for most of the survey field, I use only the diagram of versus from 2MASS for identifying candidate members, which is shown in Figure 5. Because of the crowded nature of the HD104237 multiple system, 2MASS measurements have large uncertainties for the D component and are unavailable for B, C, and E. In this work, I do not use the 2MASS data for D. I also exclude the data for A because of the possibility of contamination by D. In Figure 5, I plot the 10 Myr isochrone from Baraffe et al. (1998) for a distance of 114 pc, which is the average Hipparcos value for Cha AB and HD104237A. At colors of , three stars have positions in Figure 5 that are indicative of membership in the association, one of which also exhibits an excess in versus , as shown in Figure 6.
Table 1 summarizes long-slit spectroscopy of the five candidate members of Cha, the three candidate members of Cha, and the five late-type members of Cha from Feigelson et al. (2003). The observing and data reduction procedures are the same as those described by Luhman (2004). Low-resolution spectra of the eight candidates and the previously known members of Cha are displayed in Figure 7. High-resolution spectra near the Li line at 6707 Å for three of these candidates and the field M dwarf Gl 402 are shown in Figure 8.
3 Classification of Candidate Members
I measured spectral types and assessed membership for the eight candidate members of Cha and Cha by applying the methods of classification described by Luhman (2004) for a similar set of data in Chamaeleon I. Low-resolution spectra of the Cha candidates are shown in Figure 7. One of these stars exhibits the absorption in the CN bands that is a defining feature of carbon stars. This object is the Cha candidate with an excess in the and colors relative to M dwarfs. Red near-IR colors of this kind are typical of carbon stars (Lowrance et al., 2003). The other four candidates in Cha have M-type spectra. Three of these stars are clearly field M dwarfs rather than young M-type members of the association based on their strong Na I and K I absorption lines. These features in the spectrum of the other M-type star, 2MASS J08283329-7754014, are stronger than expected for a young source, but do not definitively establish it as a field dwarf. Therefore, I obtained a higher resolution spectrum to check for the presence of Li absorption, which is a signature of youth for M-type stars. Absorption in Li is absent in the spectrum of this star in Figure 8, demonstrating that it is a field dwarf. Astrometry, photometry, and spectral types for these Cha candidates are listed in Table 2.
Two of the three candidate members of Cha, sources 10 and 12 in Table A Survey for Low-Mass Stars and Brown Dwarfs in the Cha and Cha Young Associations 11affiliation: Based on observations performed at Las Campanas Observatory. This publication makes use of data products from the Two Micron All Sky Survey and the Deep Near-Infrared Survey of the Southern Sky., exhibit evidence of youth in the form of weak K I and Na I absorption lines and Li absorption, as shown in Figures 7 and 8. The K I and Na I transitions are not clear indicators of surface gravity at the spectral type of the third candidate, Cha 11. In addition, the signal-to-noise of the high-resolution spectrum of this source (not shown) is too low for a useful measurement of Li. However, the intensity of emission in H ( Å), the presence of emission in forbidden transitions ([O I], [O II], [N II]), and the presence of a -band excess in Figure 6 are signatures of accretion, outflows, and disks, respectively, and thus conclusively demonstrate the youth of this object. These properties, particularly the forbidden line emission, are rare for stars as old as this association ( Myr, § 5). Astrometry, photometry, spectral types, and evidence of membership for these three new young stars and the nine members of Cha from Feigelson et al. (2003) are compiled in Table A Survey for Low-Mass Stars and Brown Dwarfs in the Cha and Cha Young Associations 11affiliation: Based on observations performed at Las Campanas Observatory. This publication makes use of data products from the Two Micron All Sky Survey and the Deep Near-Infrared Survey of the Southern Sky..
4 Completeness of Survey
The mass completeness of my survey of Cha and Cha is easily evaluated with the diagrams of versus in Figures 3 and 5. In these diagrams, I include the completeness limits of the 2MASS photometry, which are taken to be the magnitudes at which the logarithm of the number of sources as a function of magnitude departs from a linear slope and begins to turn over (, ). The data in Figures 3 and 5 in conjunction with the 10 Myr isochrone from Baraffe et al. (1998) demonstrate that the survey of these associations is complete for , corresponding to and M5typeL0. Undiscovered members may exist at higher masses, except in the area in Cha considered by Luhman & Steeghs (2004) and in the Chandra fields from Feigelson et al. (2003); the former survey was complete for and the latter detected members down to the , which is the upper limit of the completeness in this work.
5 H-R Diagram for Cha
I now estimate effective temperatures and bolometric luminosities for the previously known members of Cha from Feigelson et al. (2003) and the three new young stars found in this survey, place these data on the H-R diagram, and use theoretical evolutionary models to infer masses and ages. In the following analysis, standard dwarf colors are taken from the compilation of Kenyon & Hartmann (1995) for types earlier than M0 and from the young disk populations described by Leggett (1992) for types of M0 and later. The IR colors from Kenyon & Hartmann (1995) are transformed from the Johnson-Glass photometric system to the CIT system (Bessell & Brett, 1988). Near-IR colors in the 2MASS and CIT photometric systems agree at a level of mag (Carpenter, 2001).
For the objects in my spectroscopic sample, extinctions have been estimated from the spectra in the manner described by Luhman (2004). I computed an extinction for Cha AB from the excess in relative to the dwarf value at its spectral type. For HD104237A, I adopted the extinction of from van den Ancker et al. (1998). Photometry and spectroscopy of the B and C components of HD104237 are not available because of their proximity to the primary. As a result, estimates of extinctions, temperatures, and luminosities are not possible for these two stars. Spectral types of M0 and earlier are converted to effective temperatures with the dwarf temperature scale of Schmidt-Kaler (1982). For spectral types later than M0, I use the temperature scale that was designed by Luhman et al. (2003b) to be compatible with the models of Baraffe et al. (1998) and Chabrier et al. (2000). Bolometric luminosities are estimated by combining a distance of 114 pc, bolometric corrections described in Luhman (1999), and a broad-band magnitude, preferably . However, because 2MASS measurements are uncertain or unavailable for the components of HD104237 (§ 2), I have computed luminosities from -band magnitudes for A (de Winter et al., 2001), D, and E (Feigelson et al., 2003). The contribution of the B component of Cha AB to the 2MASS magnitude has been subtracted before deriving the luminosity by adopting the magnitude difference of 0.67 measured at (Horch et al., 2001). The effective temperatures, bolometric luminosities, and adopted spectral types for the members of Cha are listed in Table A Survey for Low-Mass Stars and Brown Dwarfs in the Cha and Cha Young Associations 11affiliation: Based on observations performed at Las Campanas Observatory. This publication makes use of data products from the Two Micron All Sky Survey and the Deep Near-Infrared Survey of the Southern Sky..
The temperatures and luminosities for the members of Cha can be interpreted in terms of masses and ages with theoretical evolutionary models. After considering the available sets of models, Luhman et al. (2003b) concluded that those of Palla & Stahler (1999) for and Baraffe et al. (1998) and Chabrier et al. (2000) for provided the best agreement with observational constraints. The members of Cha from Feigelson et al. (2003) and the three new young stars from this work are plotted with these models on the H-R diagram in Figure 9. For the K and M type stars, these data and models imply an age of Myr. When the sequence in Figure 9 is compared to the one for Cha from Luhman & Steeghs (2004), no difference in age between the two associations is detectable below a solar mass. However, Feigelson et al. (2003) found that the early-type stars Cha A and HD104237A exhibit younger ages than the less massive members with the models of Siess et al. (2000). After updating the H-R diagram from Feigelson et al. (2003) with a new spectral type measurement for HD104237A, Grady et al. (2004) found that this star exhibits an older age on the isochrones of Siess et al. (2000) that is closer to the values exhibited by the low-mass members. Meanwhile, with the models adopted in this work, I find that that Cha A and HD104237A remain younger than the low-mass stars, even with the revised spectral type for HD104237A. Feigelson et al. (2003) have suggested that Cha A could be an unresolved binary, which would explain its elevated luminosity and young apparent age on the H-R diagram.
Among the three new young stars from this survey, Cha 10 and 12 have masses of 0.25 and 0.09 according to the H-R diagram in Figure 9. The spectral type of M2.25 for Cha 11 corresponds to a mass of 0.45 at the age of the association. However, the derived luminosity of this object is 30 times lower than expected for an association member at its spectral type, placing it below the main sequence. There are two possible explanations for the anomalously low luminosity estimate for Cha 11. It could be a young star at a distance of 0.5-1 kpc in the background of the Cha association or a member of Cha that is occulted by a circumstellar structure, in which case the observed photometry measures only scattered light and produces an underestimate of the luminosity. In the latter scenario, preferential occulting of the central star relative to the line emitting regions could also account for the fact that this star has the largest equivalent width of H emission among the known members and is the only one to show forbidden line emission. Indeed, the emission-line spectrum and photometry of Cha 11 closely resemble those of known edge-on disks (Jayawardhana et al., 2002).
6 Discussion
At the conclusion of a search for new members of the Cha association, Luhman & Steeghs (2004) noted that among the known members, the three least massive objects had the largest angular separations from the center of the association (), which suggested that undiscovered low-mass stars and brown dwarfs might be located beyond the radius of for their survey field. Similar results were presented independently by Lyo et al. (2004). In this work, I have presented a survey of a larger area out to that is complete for members at to 0.015. No new members have been found, indicating the absence of an extended low-mass population out to four times the radius of the association’s known members.
Feigelson et al. (2003) recently identified a new stellar group associated with the star Cha at a similar distance and age as the Cha cluster. They used optical and X-ray imaging to search for members of this association down to a limit of across an area of arcmin2, arriving at census containing five stellar systems. In this work, I have performed a search for new members of the Cha association over a larger field out to a radius of that is complete for low-mass star and brown dwarfs at to 0.015. This survey has uncovered three new young stars with spectral types of M2.25, M3.75, and M5.75 and masses of 0.45, 0.25, and 0.09 . The latter object was within the area searched by Feigelson et al. (2003) but was not found in that survey, probably because it was just below the detection limits of those optical and X-ray observations. The M2.25 star exhibits strong H emission, forbidden line emission, and a -band excess. In addition, this star is much fainter than expected for its spectral type, indicating that it is probably seen in scattered light. If optical photometry had been available for this survey of Cha and had been used in one of the color-magnitude diagrams for selection of candidate members, this object probably would have appeared subluminous, just as on the H-R diagram, and thus would have been rejected as a field star. Instead, the -band excess of this source made it sufficiently red in the one color-magnitude diagram considered here, versus , that it was selected as a candidate even at its suppressed magnitude. Any objects of this kind in the Cha field surveyed by Luhman & Steeghs (2004) at optical and IR bands probably would have been rejected as field stars. Finally, based on their youth and proximity to the association members from Feigelson et al. (2003), it appears likely that the three stars found in this survey are members of Cha. However, additional data, such as radial velocity measurements, would be useful for firmly establishing that they are members of the Cha group rather than part of a larger-scale population of young stars (Feigelson et al., 2003).
No brown dwarfs have been found in this survey of the Cha and Cha young associations. As Luhman & Steeghs (2004) concluded for their survey of a smaller field toward Cha, the absence of detected brown dwarfs in these associations is roughly consistent with the relative numbers of stars and brown dwarfs observed in nearby star-forming regions like Taurus and IC 348 (Briceño et al., 2002; Luhman et al., 2003a, b), which exhibit only and brown dwarfs above 0.02 in samples at at the sizes of those in Cha and Cha.
References
- Baraffe et al. (1998) Baraffe, I., Chabrier, G., Allard, F., & Hauschildt, P. H. 1998, A&A, 337, 403
- Bessell & Brett (1988) Bessell, M. S., & Brett, J. M. 1988, PASP, 100, 1134
- Briceño et al. (2002) Briceño, C., Luhman, K. L., Hartmann, L., Stauffer, J. R., & Kirkpatrick, J. D. 2002, ApJ, 580, 317
- Calvet et al. (2002) Calvet, N., D’Alessio, P., Hartmann, L., Wilner, D., Walsh, A., & Sitko, M. 2002, ApJ, 568, 1008
- Carpenter (2001) Carpenter, J. M. 2001, AJ, 121, 2851
- Chabrier et al. (2000) Chabrier, G., Baraffe, I. Allard, F., & Hauschildt, P. H. 2000, ApJ, 542, 464
- de Winter et al. (2001) de Winter, D., et al. 2001, A&A, 380, 609
- Feigelson et al. (2003) Feigelson, E. D., Lawson, W. A., & Garmire, G. P. 2003, ApJ, 599, 1207
- Grady et al. (2004) Grady, C. A., et al. 2004, ApJ, 608, 809
- Horch et al. (2001) Horch, E., Ninkov, Z., & Franz, O. G. 2001, AJ, 121, 1583
- Houk & Cowley (1975) Houk, N., & Cowley, A. P. 1975, University of Michigan Catalogue of Spectral Types, Vol. 1., University of Michigan, Ann Arbor
- Hu et al. (1989) Hu, J. Y., Thé, P. S., & de Winter, D. 1989, A&A, 208, 213
- Jayawardhana et al. (2002) Jayawardhana, R., Luhman, K. L., D’Alessio, P., & Stauffer, J. R. 2002, ApJ, 571, L51
- Kenyon & Hartmann (1995) Kenyon, S. J., & Hartmann, L. 1995, ApJS, 101, 117
- Lawson et al. (2001) Lawson, W. A., Crause, L. A., Mamajek, E. E., & Feigelson, E. D. 2001, MNRAS, 321, 57
- Lawson et al. (2002) Lawson, W. A., Crause, L. A., Mamajek, E. E., & Feigelson, E. D. 2002, MNRAS, 329, L29
- Leggett (1992) Leggett, S. K. 1992, ApJS, 82, 351
- Lowrance et al. (2003) Lowrance, P. J., Kirkpatrick, J. D., Reid, I. N., Cruz, K. L., & Liebert. J. 2003, ApJ, 584, L95
- Luhman (1999) Luhman, K. L. 1999, ApJ, 525, 466
- Luhman (2004) Luhman, K. L. 2004, ApJ, 602, 816
- Luhman et al. (2003a) Luhman, K. L., Briceño, C., Stauffer, J. R., Hartmann, L., Barrado y Navascués, D., & Nelson, C. 2003a, ApJ, 590, 348
- Luhman et al. (2003b) Luhman, K. L., Stauffer, J. R., Muench, A. A., Rieke, G. H., Lada, E. A., Bouvier, J., & Lada, C. J. 2003b, ApJ, 593, 1093
- Luhman & Steeghs (2004) Luhman, K. L., & Steeghs, D. 2004, ApJ, 609, 917
- Lyo et al. (2004) Lyo, A.-R, Lawson, W. A., Feigelson, E. D., & Crause, L. A. 2004, MNRAS, 347, 246
- Mamajek et al. (1999) Mamajek, E., Lawson, W. A., & Feigelson, E. D. 1999, ApJ, 516, 77
- Mamajek et al. (2000) Mamajek, E., Lawson, W. A., & Feigelson, E. D. 2000, ApJ, 544, 356
- Palla & Stahler (1999) Palla, F., & Stahler, S. W. 1999, ApJ, 525, 772
- Schmidt-Kaler (1982) Schmidt-Kaler, T. 1982, in Landolt-Bornstein, Group VI, Vol. 2, ed. K.-H. Hellwege (Berlin: Springer), 454
- Siess et al. (2000) Siess, L., Dufour, E., & Forestini, M. 2000, A&A, 358, 593
- Song et al. (2004) Song, I., Zuckerman, B., & Bessell, M. S. 2004, ApJ, 600, 1016
- van den Ancker et al. (1998) van den Ancker, M. E., de Winter, D., & Tjin A Djie, H. R. E., 1998, A&A, 330, 145
| Grating | Resolution | |||
|---|---|---|---|---|
| Date | Telescope + Instrument | l mm-1 | Å | IDaaIdentifications are from Table A Survey for Low-Mass Stars and Brown Dwarfs in the Cha and Cha Young Associations 11affiliation: Based on observations performed at Las Campanas Observatory. This publication makes use of data products from the Two Micron All Sky Survey and the Deep Near-Infrared Survey of the Southern Sky. for members of Cha and from the 2MASS Point Source Catalog for the remaining stars. |
| 2004 March 31 | Magellan II + LDSS-2 | 300 | 13 | J08214307-7931595,J08283329-7754014,J08581815-7824540 |
| J08595571-7753054,J09071397-7824073, Cha 1, 6-12 | ||||
| 2004 April 25 | Magellan I + IMACS | 600 | 2 | J08283329-7754014, Cha 10-12,Gl 402 |
| Field Star | ||||||||
|---|---|---|---|---|---|---|---|---|
| 2MASS | (J2000)aa2MASS Point Source Catalog. | (J2000)aa2MASS Point Source Catalog. | Spectral Type | EvidencebbStatus as a field star is indicated by a spectral classification as a carbon star (“sp”), absence of Li absorption (“Li”), or strong Na I and K I absorption (“NaK”). | ccSecond DENIS Release. | aa2MASS Point Source Catalog. | aa2MASS Point Source Catalog. | aa2MASS Point Source Catalog. |
| J08214307-7931595 | 08 21 43.07 | -79 31 59.5 | M5.5V | NaK | 0.56 | 0.32 | 11.65 | |
| J08283329-7754014 | 08 28 33.29 | -77 54 01.4 | M4.5V | Li | 0.56 | 0.32 | 11.89 | |
| J08581815-7824540 | 08 58 18.15 | -78 24 54.1 | M8.5V | NaK | 18.23 | 0.59 | 0.45 | 14.40 |
| J08595571-7753054 | 08 59 55.71 | -77 53 05.5 | C | sp | 13.93 | 1.31 | 1.00 | 10.55 |
| J09071397-7824073 | 09 07 13.97 | -78 24 07.4 | M5V | NaK | 14.38 | 0.57 | 0.30 | 11.59 |
Note. — Units of right ascension are hours, minutes, and seconds, and units of declination are degrees, arcminutes, and arcseconds.
| Other | Membership | ||||||||||||
|---|---|---|---|---|---|---|---|---|---|---|---|---|---|
| IDaa1 through 9 are designations from Feigelson et al. (2003). Identifications 10 through 12 are assigned in this work. | Names | (J2000)bb2MASS Point Source Catalog. | (J2000)bb2MASS Point Source Catalog. | Spectral TypeccMeasurement uncertainties for the spectral types from this work are and 0.25 subclass for K and M types, respectively. | Ref | Adopt | EvidenceddMembership in Cha is indicated by strong emission in H (“e”), Na I and K I strengths intermediate between those of dwarfs and giants (“NaK”), strong Li absorption (“Li”), X-ray emission (“x”), or proper motion (“”) or parallax (“”) measurements. | Ref | eeTemperature scale from Schmidt-Kaler (1982) (M0) and Luhman et al. (2003b) (M0). | bb2MASS Point Source Catalog. | bb2MASS Point Source Catalog. | bb2MASS Point Source Catalog. | |
| 1 | CXOU J115908.2-781232 | 11 59 07.98 | -78 12 32.2 | M5,M4.75 | 1,2 | M4.75 | x,Li,NaK | 1,1,2 | 3161 | 0.026 | 0.56 | 0.28 | 11.17 |
| 2 | Cha AB | 11 59 37.53 | -78 13 18.9 | B9 | 3 | B9 | , | 1 | 10500 | 108 | -0.03 | 0.06 | 4.98 |
| 3 | HD104237C | 12 00 03.60 | -78 11 31.0 | x | 1 | ||||||||
| 4 | HD104237B | 12 00 04.00 | -78 11 37.0 | K: | 1 | x | 1 | ||||||
| 5 | HD104237A | 12 00 05.12 | -78 11 34.7 | A0,A4,A7.5-A8 | 4,5,6 | A7.75 | x,,,e | 1 | 7648 | 29 | |||
| 6 | HD104237D | 12 00 08.30 | -78 11 39.6 | M3,M2-M3,M3.5 | 1,6,2 | M3.5 | x,Li | 1,(1,6) | 3342 | 0.15 | |||
| 7 | HD104237E | 12 00 09.32 | -78 11 42.5 | K2,K3,K5.5 | 1,6,2 | K5.5 | x,Li | 1,(1,6) | 4278 | 0.67 | |||
| 8 | USNO-B120144.7-781926 | 12 01 44.42 | -78 19 26.8 | M5 | 1,2 | M5 | Li,e,NaK | 1,(1,2),2 | 3125 | 0.037 | 0.55 | 0.35 | 10.78 |
| 9 | CXOU J120152.8-781840 | 12 01 52.52 | -78 18 41.4 | M5,M4.75 | 1,2 | M4.75 | x,Li,NaK | 1,1,2 | 3161 | 0.037 | 0.59 | 0.27 | 10.77 |
| 10 | 2MASS J12005517-7820296 | 12 00 55.17 | -78 20 29.7 | M5.75 | 2 | M5.75 | Li,NaK | 2 | 3024 | 0.024 | 0.56 | 0.39 | 11.01 |
| 11 | 2MASS J12014343-7835472 | 12 01 43.43 | -78 35 47.2 | M2.25 | 2 | M2.25 | e | 2 | 3524 | 0.0039 | 0.99 | 0.57 | 12.81 |
| 12 | 2MASS J12074597-7816064 | 12 07 45.98 | -78 16 06.5 | M3.75 | 2 | M3.75 | Li,NaK | 2 | 3306 | 0.042 | 0.57 | 0.31 | 10.67 |
Note. — Units of right ascension are hours, minutes, and seconds, and units of declination are degrees, arcminutes, and arcseconds.