The role of environment in triggering starburst galaxies: A sample of isolated galaxies
Abstract
The project AMIGA (Analysis of the interstellar Medium of Isolated GAlaxies) will provide a statistically significant sample of the most isolated galaxies in the northern sky. Such a control sample is necessary to assess the role of the environment in galaxy properties and evolution. The sample is based on the Catalogue of Isolated Galaxies (CIG, Karachentseva, 1973) and the database will include blue and near-infrared luminosities, far-infrared (FIR) emission, atomic gas (HI) emission, radio continuum, and, for a redshift limited subsample of about 200 galaxies, CO and H emission. The data will be released and periodically updated at http://www.iaa.csic.es/AMIGA.html. Here, we present the project and its status, as well as a preliminary analysis of the relation between star formation activity and the environment. We found a trend that the galaxies with asymmetric HI spectrum also tend to show an enhanced star formation, traced by a high value of , indicating that a perturbed gas kinematics and enhanced SF are related.
1 The link between environment and galaxy properties
It is commonly believed that the environment has an influence on galaxy properties and in particular on the star formation (SF) activity. For example, all known ultraluminous infrared galaxies are mergers, which shows that strong interactions can cause bursts of star formation. However, such a relation is not obvious for weaker interactions. Whereas some authors find an increase of SF in interacting galaxies (Larson & Tinsley 1978, Bushouse 1987, Xu & Sulentic 1991), other conclude that there is only a moderate increase which is furthermore restricted to the central regions of the galaxies (Bergvall et al. 2003). With respect to other galaxy properties the situation is similarly complex and contradictory. For example, it is unclear whether the molecular gas content is affected by gravitational interactions (see e.g. Braine & Combes 1993, Leon et al. 1998, Perea et al. 1997, Verdes-Montenegro et al. 1998, for different results).
This shows that although a relation between the environment and at least some galaxy properties is present, we are far from understanding the link and unable to quantify possible relations. Many of the uncertainties are due to the lack of a suitable reference sample. Such a sample should ideally include the most isolated galaxies and consist of a multiwavelength database enabling us to characterize the properties of star formation and the interstellar medium (ISM) in galaxies. In the project AMIGA (Analysis of the interstellar Medium of Isolated GAlaxies) our goal is to provide and analyse such a reference sample. In this contribution we will give a short description of the project and its status and present some preliminary results with respect to the relation between star formation activity and environment.
2 The AMIGA project: A sample of the most isolated galaxies
2.1 The sample
Our sample is based on the Catalogue of Isolated Galaxies (CIG, Karachentseva, 1973), including 1050 galaxies. We chose this catalog because it presents several strengths: (i) The large size of the catalog allows a statistically meaningful analysis, even when refining the sample in isolation and morpholgy or restricting the redshift range. (ii) The isolation criterium used by Karachentseva is clearly defined: it contains galaxies for which no similarly sized galaxies with diameter d, between 1/4 and 4 times diameter D of the CIG galaxy, lie within 20d. Within this definition, dwarf companions are not necessarily excluded. (iii) All morphological types are found in the CIG, allowing an analysis as a function of Hubble type. (iv) Finally, the CIG probes a large enough volume of space to allow us to sample the majority of the optical luminosity function, and it is 80-90% complete to m (Verdes-Montenegro et al. 2004).
2.2 Refinement of the sample
We are in the process of improving the CIG in several ways that take advantage of the Digitized Sky Surveys (POSS1 and POSS2).
-
•
Isolation revision: We reevaluate the degree of isolation based on red POSS1 images and a minimum physical diameter around each CIG galaxy of 0.5 Mpc (Verley et al., in preparation). The goals are to resolve close pairs, to identify missed and/or fainter (candidate) companions, and to quantify the isolation degree. We used estimates of the tidal strengths and of the local density in order to quantify the isolation degree. Both estimates give similar results. In the present paper, we will use the first estimator, defined as the ratio between the tidal force and binding force as an estimate for the interaction strength:
(1) where / is the (unknown) mass of the companion galaxy/CIG galaxy which we assume to be related to the linear galaxy diameter as (Dahari 1984). is the distance between the galaxies. Since we do not have redshift information for most of our candidate companions, we approximate by , the projected distance, and by the angular galaxy diameter . In spite of the lack of the redshift information, is expected to give a reasonable estimate of the tidal interaction strength in a statistical sense as can be seen from the following argument. If the candidate companion galaxy is in reality a background object we have underestimated the true distance but also underestimated the true size and mass. Both effects partly cancel out. Only in the case of the candidate companion being a foreground object is overestimated. Foreground objects are however rarer than background objects because of the smaller volume sampled by them. Nevertheless, it would be desirable to obtain the redshifts for the companion galaxies and in the future we will try to achieve this at least for a subsample.
-
•
Morphology revision: Galaxy classification data for CIG galaxies is nonuniform and often contradictory when comparing e.g. NED vs. LEDA vs. CIG. Based on POSS2 images it was possible to obtain reliable galaxy types for 80% of the sample (Sulentic et al., in preparation). The remaining 20% of the sample are being supplemented with archival data or new CCD images on 1-2m class telescopes.
-
•
Redshifts and distances: We have searched the literature and archives for redshifts and distances of CIG galaxies, revealing data for almost the entire sample (956/1050 galaxies).
-
•
Positions: The positions of the CIG galaxies were systematically revised using SExtractor on images from the Digitized Sky Survey and visually checking the results in cases of complex morphology. Differences between old and new positions of up to 38.9” were found with a mean of 2.4” (Leon & Verdes-Montenegro 2003).
2.3 The database
The goal of this project is to build a multiwavelength database for the CIG that will allow us to characterize the star formation activity and the properties of the different components of the interstellar medium, study the interplay between ISM and SF and the link between central activity (Seyfert, radio-galaxies) and the environment. In order to achieve this, we have obtained, either from archives, the literature or by own observations the following data:
-
•
The optical luminosity as a tracer of the visible light and the stellar content. Zwicky magnitudes are available for all CIG galaxies. We have corrected the Zwicky magnitudes for systematic errors reported by Kron & Shane (1976), Galactic dust extinction, internal dust extinction based on the revised morphologies and applied a k-correction.
-
•
We plan to derive the near-infrared luminosity from 2MASS data, available for 90% of the sample, as a measure of the old stellar population and a better tracer of the stellar mass.
-
•
H as a good tracer of recent star formation in places where extinction is not high. H images have been taken for about 150 galaxies and the reduction is in progress. These images will allow us to quantify the total present SF rate and to study its spatial distribution and morphology.
-
•
The far-infrared (FIR) emission, where most of the flux from newly formed stars is re-radiated. IRAS data is available for almost the entire sample. We have reprocessed the IRAS data using the tool SCANPI which allowed us to increase the detection rate, improve the signal-to-noise ratio for weak sources and derive more reliable fluxes for extended sources than the Point Source Catalog.
-
•
Atomic gas, HI, as a fundamental ingredient of the ISM and a very sensible tracer of interaction. Data for about 800 galaxies have been compiled partly from the literature and to a large extent from own observations with Effelsberg, Nancay and Arecibo (Espada et al., in preparation). The HI spectrum does not only provide the total mass of the atomic gas, but also allows us to measure its asymmetry. We are currently testing different parameters to quantify this asymmetry. In the present contribution, we use an asymmetry parameter which is defined as the ratio of the velocity integrated intensities below and above the mean velocity.
-
•
CO emission as a tracer of the molecular gas (H2) content, which represents the dense ISM and is the major building block for SF. Very few CO observations of CIG galaxies could be found in the literature. We have carried out observations for 183 galaxies with the IRAM 30m telescope, Five College Radio Telescope and the Nobeyama 45m telescope.
-
•
Radio-continuum emission as a useful tracer of the current SF rate and, through the deviation from the FIR-radio correlation, for the nuclear activity. It has the advantage that it is not affected by extinction. We reprocessed data from the VLA Sky Survey from which we obtained fluxes at 1.4 GHz for 343 galaxies and from surveys of the Westerbrok array (44 galaxies at 320 MHz) and from the Greenbank telescope (32 galaxies at 4.8 GHz) (Leon et al., in preparation).
It is impossible to carry out the H and CO observation for the whole sample because it is too time-consuming. Therefore we have restricted these observations to a redshift limited sample (recession velocities between 1500 and 5000 km/s) of about 200 galaxies. The data are being released and periodically updated at http://www.iaa.csic.es/AMIGA.html.
3 Star formation activity and the environment
In the following, we use the FIR luminosity as a tracer of the SF rate. Fig. 1 (left) shows the range of FIR luminosities of the sample spanning several orders of magnitude up to about . Also the values of the FIR-to-blue ratio extend over 2 orders of magnitudes. We found a morphological segregation in this distribuion with irregular galaxies being at the low luminosity end and early-type spirals at the high luminosity end.
We tested several “starburst indicators” commonly used in the literature to trace galaxies with an enhanced SF activiy. Heckman et al. (1990) suggested the IRAS flux ratio as a tracer for starburst galaxies. Dahlem et al. (2001) successfully used this tracer and found it to correlate reasonably with the radio continuum luminosity per SF area. Rossa & Dettmar (2003) found a similarly good correlation for a sample of edge-on galaxies between and . We tested these parameters for our sample, as well as an additional one, the FIR luminosity per atomic hydrogen mass, . In Fig. 1 (right) we show the comparision between two tracers, and (with a similar relation is found). We only plot data for galaxies with a signal-to-noise ratio 3 in both the 60 and 100 m fluxes, in which case the maximum error in is a factor of 50%. The relation between both quantities is slightly poorer than for the samples of Dahlem et al. (2001) and Rossa & Dettmar (2003), but still a trend is visible. A possible reason for this poorer correlation the relatively large measurement error in in our sample with many weak IRAS sources. Due to the small range spanned by , this parameter is a useful starburst tracer only for those galaxies with low errors in the 60 and 100 m data so that even small differences in are significant. In the following, we choose to use as an indicator for enhanced SF. (Similiar results are obtained with and, restricting the sample to high signal-to-noise data, also with ).


We compared to the tidal strength parameter , as defined in eq. (1). No correlation was found so far. However, this result might change in the future with our refinement of this parameter, e.g. by taking into account the redshift of candidate companions.
We do find, on the other hand, a trend when comparing to the asymmetry of the HI line. Fig. 2 (left) shows that galaxies with the most asymmetric HI lines (i.e. those with values strongly departing from 1 towards smaller and larger values) are those with high values of . This is emphasized in Fig. 2 (right) where we plot the distribution of the asymmetry parameter for galaxies with high and low . The distribution is clearly much broader for galaxies with . Here, 43% of the galaxies (34 out of 78) are outside the central two bins, whereas for galaxies with only 13% (13 out of 97) lie outside.

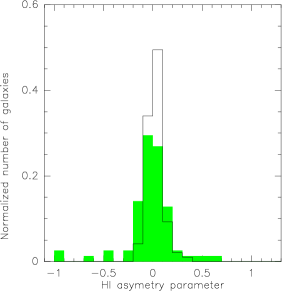
The HI is a sensible indicator for gravitational interaction. The asymmetric HI spectrum could therefore hint at a tidal interaction with a weak companion not easily visible, or below the sensitivity limit, in images of the Digitized Sky Survey. However, the asymmetric HI spectrum does not prove that an interaction is taking place. It could merely be an indicator for instabilities in the disk – whatever their causes are – that produce an asymmetric gas distributions and kinematics and might at the same time drive gas to the center of galaxies and enable an increase in the SF rate (see Combes, this volume).
References
- (1) Bervall, N., Laurikainen, E. Aalto, S., 2003, A&A, 405, 31
- (2) Braine, J., Combes, F., 1993, A&A, 269, 7
- (3) Bushouse, H. A., 1987, ApJ, 320, 49
- (4) Dahari, O., 1984, AJ, 89, 966
- (5) Dahlem, M., Lazendic, J.S., Haynes, R. F., Ehle, M., Lisenfeld, U., 2001, 374,42
- (6) Heckman, T. M., Armus, L., Miley, G.K., 1990, ApJS, 74, 833
- (7) Karachentseva, I., 1973, Comm. Spec. Ap. Obs, USSR 8, 1
- (8) Larson, R. B., Tinsley, B. M., 1978, ApJ, 219, 46
- (9) Leon, S., Verdes-Montenegro, L., 2003, A& A, 411, 391
- (10) Rossa, J., Dettmar, R.-J., 2003, A&A, 406, 505
- (11) Perea, J., del Olmo, A., Verdes-Montenegro, L., Yun, M.S., 1997, ApJ, 490, 166
- (12) Verdes-Montenegro, L., Yun, M.S., Williams, B.A., Huchtmeier, W.K., del Olmo, A., Perea, J., 2001, A&A, 377, 812
- (13) Verdes-Montenegro, L., Sulentic, J. W., Lisenfeld, U., Leon, Ss., Espada, D., García, Sabater, J., Verley, S., 2004, A& A, submitted
- (14) Xu, K.C., Sulentic, J.W., 1991, ApJ, 374, 407