Mapping WR 140 from infrared spectroscopy and imaging
Abstract
Observations of the 1.083-m He i line in WR 140 (HD 193793) show P-Cygni profiles which varied as the binary system went through periastron passage. A sub-peak appeared on the normally flat-topped emission component and then moved across the profile consistent with its formation in the wind-collision region. Variation of the absorption component provided constraints on the opening angle () of the wind-collision region. Infrared (2–10-m) images observed with a variety of instruments in 2001–04 resolve the dust cloud formed in 2001, and show it to be expanding at a constant rate. Owing to the high eccentricity of the binary orbit, the dust is spread around the orbital plane in a ‘splash’ and we compare the dust images with the orientation of the orbit.
Institute of Astronomy, Royal Observatory, Edinburgh, EH9 3HJ, U.K.
Joint Astronomy Centre, 660 N. A‘ohōkū Place, Hilo, HI 96720, U.S.A.
European Space Research and Technology Center (ESTEC), European Space Agency, Keplerlaan 1, AG NL-2200 Noordwijk, Netherlands
Physical Research Laboratory, Navrangpura, Ahmedabad, India 380009
1. Infrared spectroscopy and the 1.083-m He i P Cygni profile
The WC7+O4-5 binary WR 140 (HD 193793) is the archetypal episodic dust-forming Wolf-Rayet Colliding Wind Binary. It is particularly luminous in X-rays and was the first WR system to show non-thermal radio emission and episodic dust formation. Variations in its X-ray, radio and infrared properties were linked to its binary motion by Williams et al. (1990), and it has since been the subject of theoretical and observational studies of colliding-wind phenomena. As part of the campaign planned for the 2001 periastron passage, we observed a series of near-infrared spectra having resolutions using the United Kingdom Infrared Telescope (UKIRT), Hawaii, and the Mt Abu Infrared Telescope, India (Varricatt, Williams & Ashok 2004). The 1.083-m He i line was also observed at to look for colliding-wind effects (cf. Stevens & Howarth 1999). Previous observations of WR 140 (e.g. Eenens & Williams 1994) had shown flat-topped profiles for this line, but they were taken far from periastron. Our observation at , however, showed the appearance of a strong, blue-shifted sub-peak on the emission profile (Fig. 1), which we interpret as being formed in a shell of compressed WC7 stellar wind material flowing along the wind-collision region (WCR). The shape of the WCR can be approximated (e.g. Usov 1992., Lührs 1996) by a hollow cone symmetric about the axis joining the stars and having its apex towards the WC7 star, which has the higher mass-loss rate.
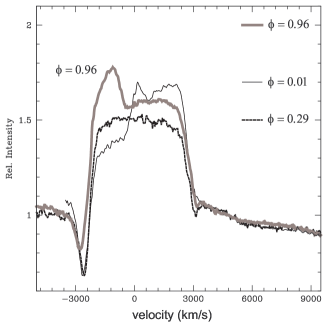
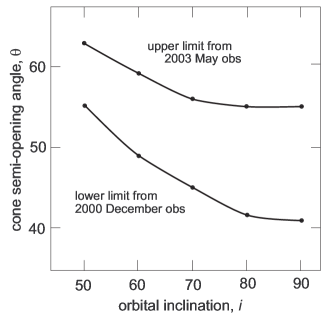
At , the system is near conjunction with the O star in front of the WC7 star, so we expect the compressed WC7 material to be flowing towards us. At the same time, we are viewing the two stars mostly through the wind of the O star, accounting for our observation (Fig. 1) that the absorption component of the He i line is weaker than at phases when the stars are observed through the He-rich WC7 stellar wind. At this phase, the angle between our sightline and the axis joining the two stars is smaller than the opening angle () of the wind-collision ‘cone’.
The value of varies round the orbit and can be calculated for the phases of our observations for a range of values of the inclination so we can use successive measurements of the strength of the absorption component to explore permitted values of and inclination. At the same time, we model the variation of the radial velocity (RV) of the subpeak, including its width, following Lührs (1997) but with the difference that, instead of treating the velocity of the compressed wind as a free parameter to be fit, we calculate it from those of the WC7 and O star winds and following Cantó, Raga & Wilkins (1996). This models the movement of the sub-peak to the red end of the profile by the time of our first post-periastron observation (, Fig. 1). At this time, the absorption component was strong because we observed both stars through the WC7 stellar wind. Two years later, by , the emission sub-peak had vanished as the stars had moved further apart, but the absorption component was still strong. This puts a useful upper limit on (Fig. 1). Modelling the RVs of the sub-peak indicates an orbital inclination , implying (Fig. 1) .
2. Infrared imaging of the dust emission
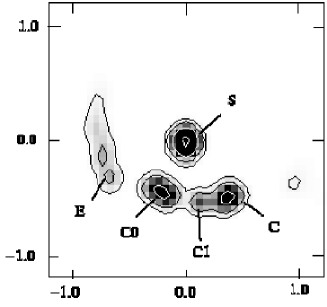
We imaged WR 140 in the infrared with four different instruments: PHARO +AO on the Hale telescope, INGRID+AO (NAOMI) on the William Herschel Telescope (WHT), and UIST and Michelle, both on UKIRT. The UKIRT observations were made at longer wavelengths, where the contrast between dust and stellar emission was greater, especially as the dust cooled, but the resolution is lower. Single stars were observed to determine the image psfs and the images of WR 140 were restored using maximum entropy methods. A test of the validity of our procedures is provided by two images of WR 140 (Fig. 2) observed at about the same time with two different instruments and reduced with different software packages. The basic structures are similar, with a ‘bar’ of dust emission to the south and another feature to the east. Similar structures are evident in all the images, e.g. a 3.99-m image observed with UIST in 2003 (Fig. 3).
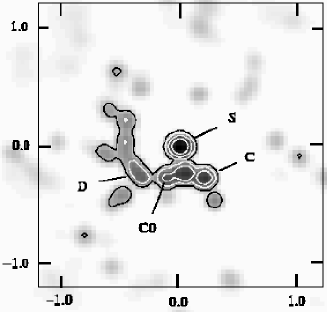
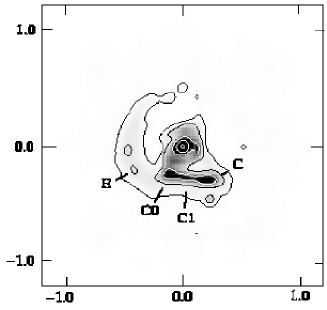
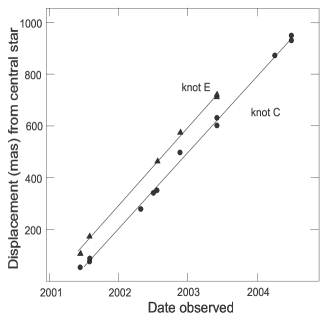
We can use the contemporaneous 3.6-m and 3.99-m UIST observations to measure the infrared colours of the emission features relative to that of the star, confirming that the the features are 0.4 mag. redder in [3.6]–[3.99] than the star, consistent with their being heated dust. We identified several knots of dust emission with those identified in the aperture-masking images observed in 2001 by Monnier, Tuthill & Danchi (2002) from the similarity of their position angles (P.A.) relative to the star, and use these and other knots to track the expansion of the dust cloud. The observations are summarized in Table 1, together with the P.A.s and radial distances () of the emission knot, ‘C’. These distances, together with those from the images of Monnier et al. and measured from the image given by Tuthill et al. (2003), and similar data for knot ‘E’ to the east, are plotted against date in Fig. 3, and show remarkably linear expansion.
| Instrument | Date | Phase | Scale | obs | P.A. | r |
|---|---|---|---|---|---|---|
| (mas) | (m) | (∘) | (mas) | |||
| Hale: PHARO+AO | 2001.68 | 0.073 | 25 | 2.2 | ||
| Hale: PHARO+AO | 2002.31 | 0.153 | 25 | 2.2 | 216 | 278 |
| WHT: INGRID+AO | 2002.51 | 0.178 | 26.3 | 2.27 | 219 | 341 |
| Hale: PHARO+AO | 2002.56 | 0.184 | 25 | 2.2 | 217 | 352 |
| UKIRT: UIST | 2002.89 | 0.226 | 16.5 | 3.6 | 217 | 498 |
| UKIRT: UIST | 2002.89 | 0.226 | 16.5 | 3.99 | 216 | 451 |
| UKIRT: UIST | 2003.42 | 0.293 | 16.5 | 3.6 | 210 | 630 |
| UKIRT: UIST | 2003.42 | 0.293 | 16.5 | 3.99 | 217 | 601 |
| UKIRT: Michelle | 2004.25 | 0.397 | 210 | 10.52 | 215 | 874 |
| UKIRT: UIST | 2004.49 | 0.426 | 16.5 | 3.99 | 214 | 948 |
| UKIRT: UIST | 2004.49 | 0.426 | 16.5 | 4.68 | 218 | 928 |
| Knot | P. M. | Proj. vel. | Date started | Phase started |
|---|---|---|---|---|
| (mas/y) | (km/s) | |||
| C | 2947 | 257563 | 2001.280.07 | 0.0230.009 |
| C0 | 24017 | 2108151 | 2001.340.21 | 0.0300.027 |
| D | 31318 | 2745158 | 2001.220.11 | 0.0150.014 |
| E | 3042 | 266414 | 2001.030.01 | 0.9910.002 |
The proper motions of selected knots from linear fits to the distances of selected knots are given in Table 2, together with projected velocities adopting the revised distance of 1.85 kpc (Dougherty et al., this meeting). These velocities are comparable to that (2470 km/s) of the compressed WC7 wind material responsible for the He i sub-peaks and presumably the gas in which the dust formed. The observation of relatively high projected velocities for three of the four well observed knots suggests either that they are clumps moving in the plane of the sky or, more probably, that they are limb-brightened edges of a hollow dust cloud and not physical clumps.
To model the dust-emission images, we assume that the dust moves radially along the projection of the WCR and therefore need to know the changing configuration of the WCR during dust formation. From the NIR light curves (Williams 1990), we infer that dust formation occurs for only of the period on either side of periastron. The high eccentricity of the orbit (Marchenko et al. 2003), however, means that the axis of the WCR moves through more than in this short time and, allowing for , that the dust is spread around three-quarters of the obital plane in a small fraction of the period. This will not give a dust ‘spiral’, nor a ‘jet’, but a ‘splash’. The orientation of this ‘splash’ on the sky using the orientation of the orbit from values of and derived by Dougherty et al. has the dust starting to the east and running clockwise round the star to finish to the south, making the southern ‘bar’ the most recently formed dust. The absence of significant dust emission to the NW, the projected axis at the time of periastron passage, suggests that dust formation is quenched at the very closest separation.
Acknowledgments.
We gratefully acknowledge the Service Observing Programmes of the Isaac Newton Group (WHT) and the Joint Astronomy Centre (UKIRT).
References
Cantó J., Raga A. C., Wilkin F.P., 1996, ApJ, 469, 729
Eenens P. R. J., Williams P. M., 1994, MNRAS, 269, 1082
Lührs S., 1997, PASP, 109, 504
Marchenko S. V., Moffat A. F. J., Ballereau D., Chauville J., Zorec J., Hill G. M., Annuk K., Corral L. J., Demers H., Eenens P. R. J., Panov K. P., Seggewiss W., Thomson J. R., Villar-Sbaffi A., 2003, ApJ, 596, 1295
Monnier J. D., Tuthill P. G., Danchi W. C., 2002, ApJ, 567, L137
Stevens I. R., Howarth, I. D. 1999, MNRAS, 302, 549
Tuthill P. G., Monnier J. D., Danchi, W. C., Turner N. H. 2003, in IAU Symp. 212, A Massive Star Odyssey, from Main Sequence to Supernova, ed. K. A. van der Hucht, A. Herrero & C. Esteban (San Francisco: ASP), 121
Usov V. V. 1992, ApJ, 389, 635
Varricatt W. P., Williams P. M., Ashok N. M. 2004, MNRAS, 351, 1307
Williams P. M., van der Hucht K. A., Pollock A. M. T., Florkowski D. R., van der Woerd H., Wamstecker W. M., 1990, MNRAS, 243, 662