Abstract
The Lambda Orionis Star Forming Region is a complex structure which includes the Col 69 (Lambda Orionis) cluster and the B30 & B35 dark clouds. We have collected deep optical photometry and spectroscopy in the central cluster of the SFR (Col 69), and combined with 2MASS IR data, in order to derive the Initial Mass Function of the cluster, in the range 50-0.02 . In addition, we have studied the H and lithium equivalent widths, and the optical-infrared photometry, to derive an age (52 Myr) for Col 69, and to compare these properties to those of B30 & B35 members.
keywords:
The Initial Mas Function – Low Mass Stars and Brown Dwarfs – Lambda Orionis clusterThe Collinder 69 cluster in the context of the Lambda Orionis SFR \articlesubtitleAn Initial Mass Function Down to the Substellar Domain

1 Introduction
One of the most prominent Star Forming Regions (SFRs) in Orion, albeit not very well studied, is the Head of Orion, the Lambda Orionis Star Forming Region (hereafter LOSFR). This area, about 50 sq.deg., is dominated by the O8 III star 1 Orionis. This star is located at the center of a ring of dust and molecules, which encloses the S264 HII region, a large number of IRAS sources, the LDB1588 & LDN1603 and Barnard 30 and Barnard 35 (B30 & B35) dark clouds, and the Lambda Orionis (also called Collinder 69) cluster –which is located just around the central star. Figure 1 shows this region, and includes the emission at 100 (from IRAS) and the distribution of stars of B spectral type.
Several groups have focused on different aspects of the LOSFR, such as the photometric properties of the high mass members (Murdin & Penston 1977), a H survey (Duerr, Imhoff & Lada 1982), the analysis of the IRAS data (Zhang et al. 1989) and a photometric and spectroscopic search (Dolan & Mathieu 1999, 2001, 2002, D&M hereafter). All this wealth of data has shown that young stars are clustered around the central part of the LOSFR (the Col 69 cluster) and the dark clouds B30 & B35, whereas a large number of IRAS sources are associated to the much denser clouds LDN1588 & LDN1603. The distance to this region is in between 38030 pc, as derived by Hipparcos, and 45050 pc (D&M). D&M also derived an age of about 6 Myr, which correspond to the turn-off age for the massive stars (4 Myr in the case of Murdin & Penston 1977). The region is also characterized by the low reddening in the central area, E=0.12 (Diplas & Savage 1994).
This SFR, due to its properties, is an excellent field to study different aspects of the stellar and substellar evolution, from brown dwarfs hunting to studies of the Initial Mass Function (IMF) and the effect of the environment, as well as different stellar properties. In this paper we focus on the Col 69 cluster and compare some of its properties to those of the B30 & B35 clouds.
2 Searching for additional low mass members of Col 69
2.1 Deep optical photometry
We have conducted a deep optical survey with the CFHT 12K mosaic camera (hereafter CFHT/12K), which covers a field of view of 4228 arcmin, and the and filters (Cousins). We centered the search on the star 1 Orionis. The details can be found in Barrado y Navascués et al. (2004a). The limiting and completeness magnitudes are (lim)=24.0 and (compl)=22.75 mag. For cluster members, the completeness is achieved at 20.2 mag, due to the limitations imposed by the filter.
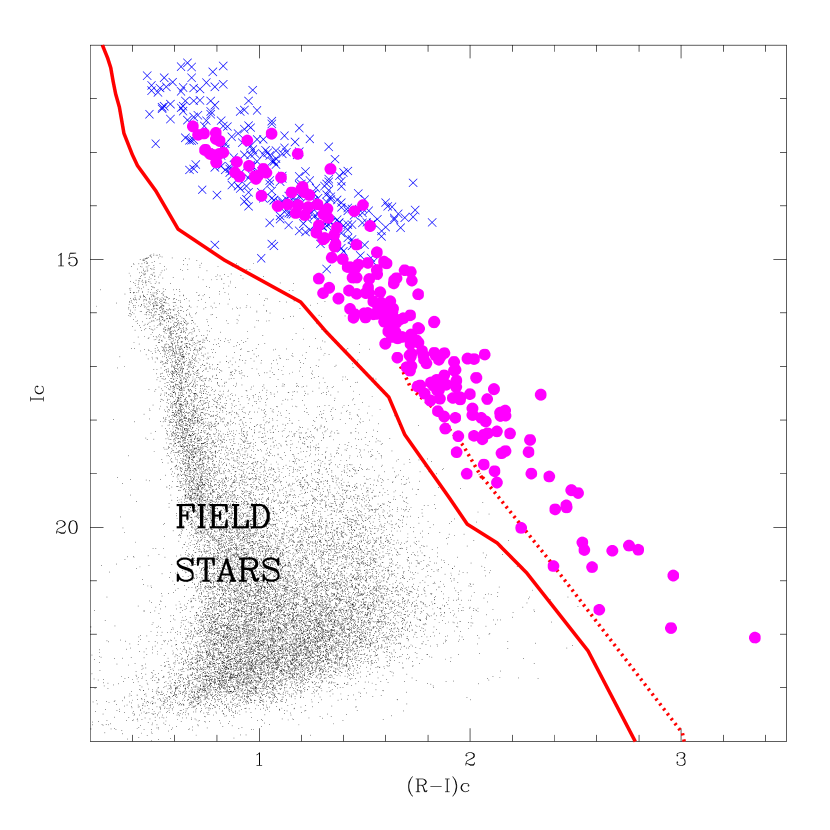
Figure 2 displays an optical Color-Magnitude (CMD) with our photometric data. In the figure, we have included the field stars as black dots, our selection of candidate members as purple solid circles and previously known members of the SFR as blue crosses (from D&M). We have incorporated a Zero Age Main Sequence –red solid line– and a 5 Myr isochrone from Baraffe et al. (1998) –red dotted line. They were shifted to the assumed distance of the Col 69 cluster, 400 pc –(m-M)0=8.010– and its color excess E()=0.12, which translates into E=0.084 and =0.223 (following Rieke & Lebofsky 1985). We have selected 170 candidate members with magnitudes in the interval =12.52–22.06 mag. A more detailed CMD can be found in Figure 3, where we represent our selected candidate members (purple symbols) with those selected by D&M (blue crosses for the area around the star 1 Orionis, green crosses for those closer to B30 and B35). In all cases, large circles denote objects with H emission well above the saturation limit (see section 3.1 and Figure 11). In principle, based on Baraffe et al. (2003) models (the so called COND models), we would have reached 0.01 if the faintest object is indeed a bona fide member of the cluster.

2.2 Follow-up: 2MASS photometry
We have mined the 2MASS database (All Sky release, Cutri et al. 2003) in order to complement our optical data with near infrared photometry. Due to the limiting magnitude of that survey, we were only able to get these data for objects brighter than about =19.1 mag. In any case, we have used these data to classify the objects initial selected as candidate members into probable members and possible members, and probable and possible non-members. See Table 2 of Barrado y Navascués et al. (2004a).
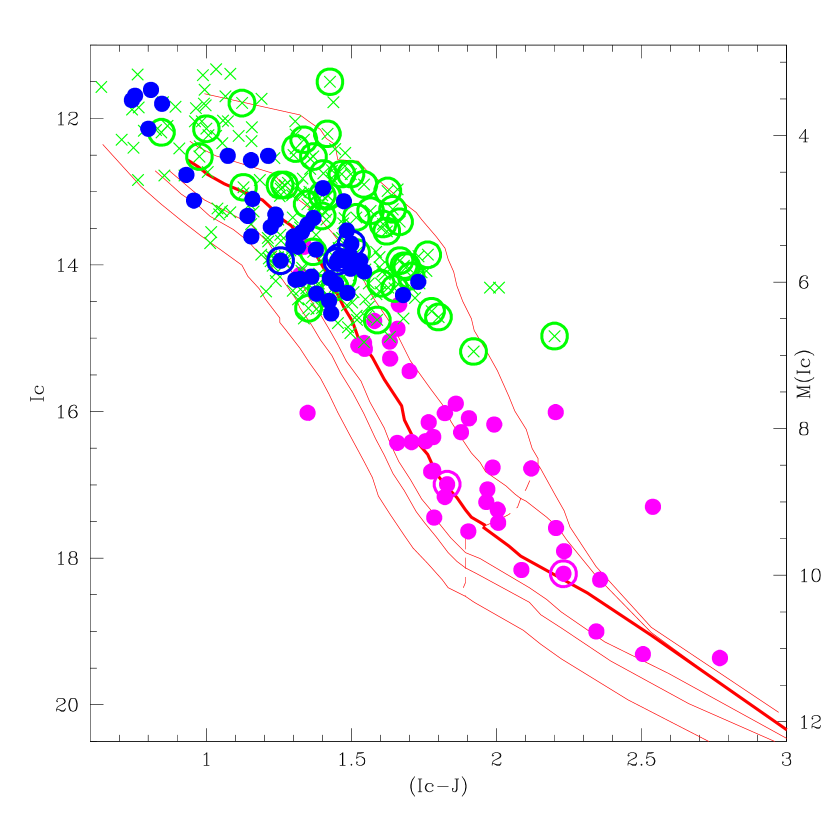
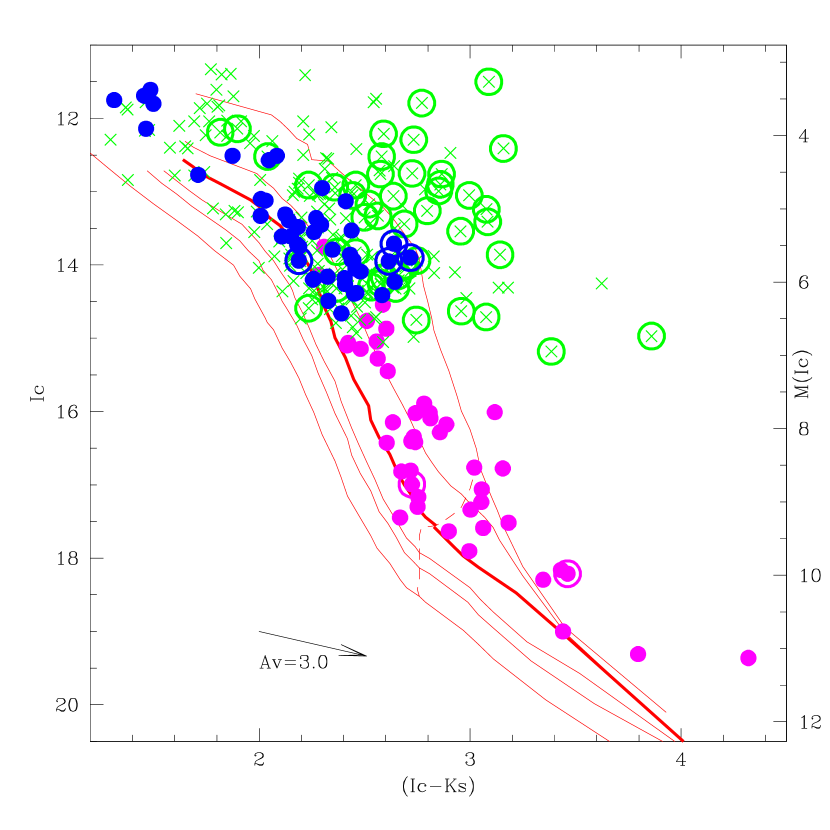
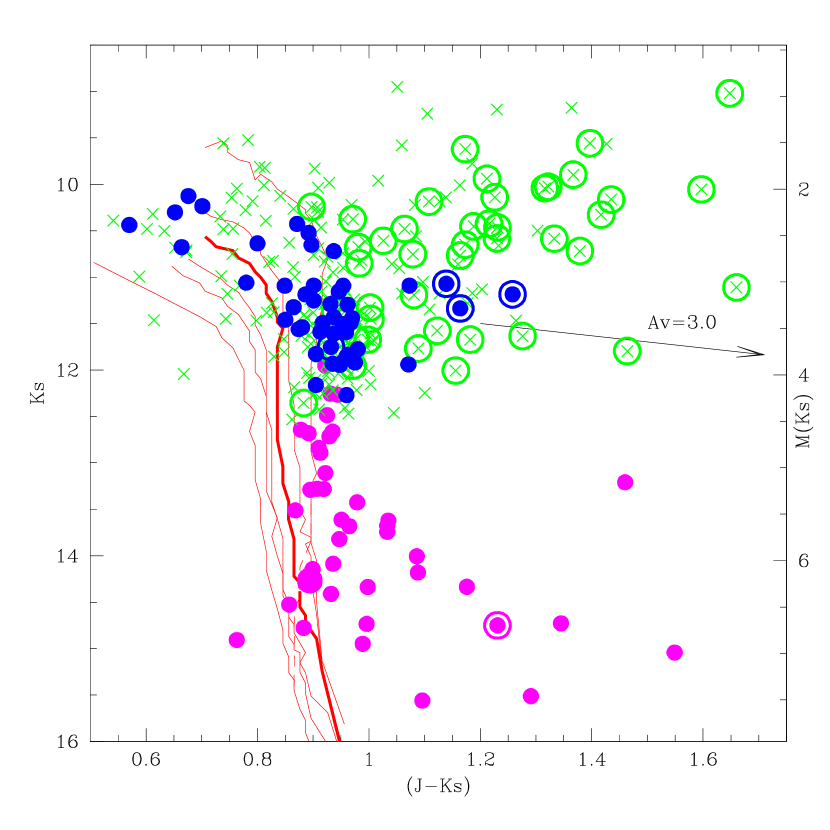
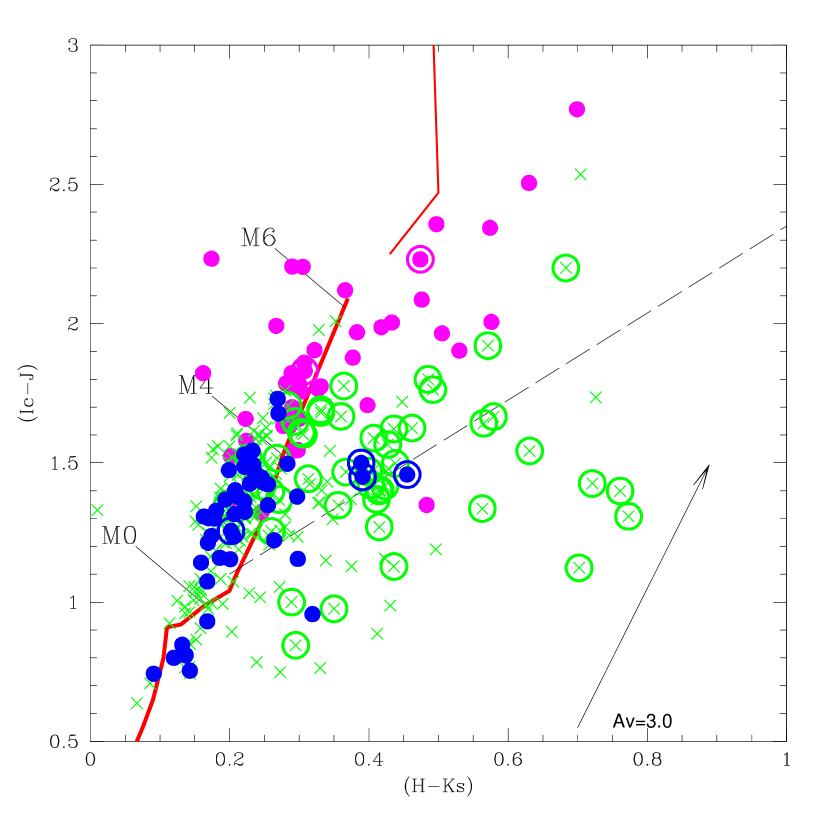
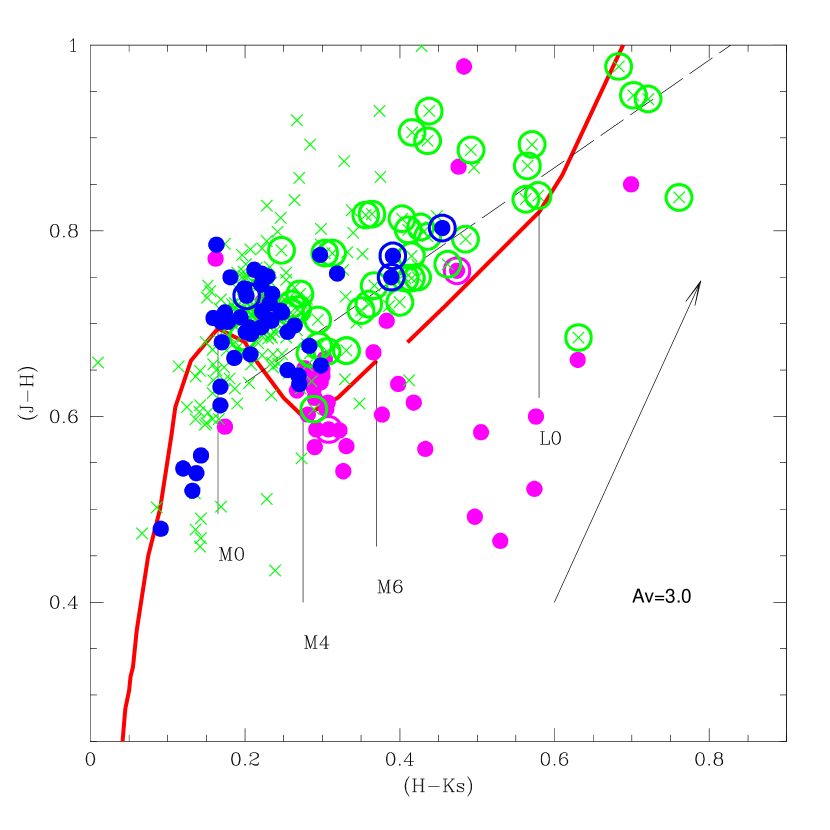
We have also searched for the 2MASS counterparts of the D&M candidate members. Figure 4-6 includes several CMD using the optical and infrared data. Symbols are as in Figure 3. The diagrams suggest that those D&M candidates clustered around the B30 and B35 darks clouds (green crosses) are both younger and have a much larger extinction and/or infrared excess. This last fact is not surprising, since the IRAS data displayed in Figure 1 clearly show the concentration of dust around B30 & B35. However, some of them might have circumsubstellar disks which could be responsible for part of the IR excess. This assertion is supported by the Color-Color Diagrams (CCD) displayed in Figure 7-8 (symbols as in Figure 3). Many of the D&M members of B30 & B35 are located close to the Classical TTauri star locii. Moreover, most of them have strong H emission, which might be due to ongoing accretion from the circunstellar disk.
In these diagrams, we have overplotted the isochrones by Baraffe et al. (1998) using the interstellar extinctions of =0.374, =0.307, =0.223, =0.106, =0.066, and =0.04. These values where computed from the reddening measured by Diplas & Savage (1994), E=0.12, and the transformations by Rieke & Lebofsky (1985).

2.3 Follow-up: Low-resolution spectroscopy
Our ongoing comprehensive study of the LOSFR also includes optical spectroscopy. We have obtained low-resolution spectra in November 3-5, 2002 at the Keck I telescope, using the LRIS spectrograph and the 400 l/mm grating, achieving a resolution of R1100 and a spectral range of 6300-9600 Å. Later on, in March 9-11 2003, we obtained additional spectral with the Magellan II telescope and the B&C spectrograph. In this case we used the 300 l/mm grating, the resolution was R800, and we covered the range 5000-10200 Å. Details can be found in Barrado y Navascués et al. (2004a). In total, we observed 33 objects, both stellar and substellar, with in the range 15.23 and 20.73 mag. Figure 9 includes some spectra. We also observed several spectral templates and derived spectral types, which range from M4.5 to M7.5, which allowed us to assess the membership status of this subsample more securely than using the purely photometric classification.

2.4 Medium-resolution spectroscopy
During the same campaigns, we also collected medium resolution spectra. The details can be found in Barrado y Navascués et al (2005, in preparation). In both telescopes we used the 1200 l/mm grating, achieving a very similar resolution, R3200, as measured with the Argon-Neon comparison lamps. The spectra include the H (6563 Å) and lithium (6708 Å) lines. Figure 10 shows the spectral range around lithium for a subsample of the objects observed at medium-resolution. This alkali doublet is clearly seen in most of the objects, confirming beyond any reasonable doubt the cluster membership.
3 The properties

3.1 H as a proxy of the accretion in Col 69, B30 & B35
We have measured the H equivalent width –W(H)– both in our low- and medium-resolution spectra of the Col 69 candidate members. D&M also have W(H) for the stars listed in their studies. Figure 11 displays these data versus the derived spectral types. Symbols as in Figure 3. The diagram also includes two horizontal segments (red, long-dashed lines), which corresponds to an ad hoc and widely used criteria to discriminate between accretion and non-accreting stars in SFRs. The red, dotted line is the accretion criterion proposed by Barrado y Navascués & Martín (2003), which is based on the saturation of the chromospheric activity observed in young open clusters (30-125 Myr), which appears at Log {Lum(Halpha)/Lum(bol)}=3.3 dex. Based on this criterion, we have classified the the three samples analyzed in this paper (our own faint objects associated to Col 69 –purple, solid circles–, the D&M stars related to Col 69 –blue, solid circles–, and the D&M stars related to either B30 or B35 –green crosses–), into accretion and non-accreting objects. In the first case, we have over-plotted a large, open circle. This classification has been shown in Figures 3-8.
The comparison between these three samples (actually two: the objects related to Col 69, shown as purple and blue solid circles; and those related to B30 or B35, shown as green crosses) indicates that the fraction of accreting objects is very different in each group (a result already pointed out by D&M). In any case, the activity, coming from accretion or from the chromosphere, is much larger in B30 & B35 than in Col 69.
3.2 On the age of Col 69

3.2.1 An age estimate from the H
We have compared the H properties of Col 69 and B30/B35 with other SFRs and very young open clusters. To do so, we have computed the ratio of stars having W(H) above the saturation criterion with the total number of members with known H. Figure 12 shows the results, and includes data from Orion, Chamaeleon I, Taurus, Sigma Orionis, Upper Scorpius and the TW Hydrae Association (see details and references in Barrado y Navascués & Martín 2003 and Barrado y Navascués, Mohanty and Jayawardhana 2005, in preparation). As far as we know, there is no accurate age estimate for B30 & B35, but the clear trend observed in the other associations suggests that they are about 3 Myr, younger than the age estimated by D&M for Col 69. However, the fraction of accreting stars of Col 69 (or the fraction of very active members) is much lower than expected, indicating that either Col 69 is much older than previously thought (but the star 1 Orionis cannot be older than about 7 Myr, since with a mass around 25 Myr would have exploded as a supernova), or some event has removed the disks around the Classical TTauri stars belonging to the association. The strong wind and UV flux from 1 Orionis (O8 III spectral type) might have played this role, at least in the case of the members close to the central star. Or D&M might have hit the answer when they suggested that a supernova, more massive than 1 Orionis, went off in Col 69, inducing the star formation in B30 & B35 (i.e., they have to be younger that Col 69), and just initiated the process in LDN1588 and LDN1603 (Figure 1).
A third possibility would be that 1 Orionis is not related to Col 69, which is in unlikely based on the measured distances and overall properties.

3.2.2 The age and lithium equivalent width
Lithium, due to its fragility and easy destruction at low temperatures inside the core of stars and high mass brown dwarfs, is key to understand their internal structure and evolution. Moreover, it can be used as an independent age indicator. The theoretical models predict that no lithium depletion takes place at any mass during the first few million years (3 Myr, see D’Antona & Mazzitelli 1994, 1997; Baraffe et al. 1998; Siess et al. 2000). After that, a fast depletion takes places, especially for early M stars. This property has been used to determine, in a very accurate way, the age of IC2391, the Alpha Persei cluster, and the Pleiades (Stauffer et al. 1998, 1999; Barrado y Navascués et al. 1999, 2004b). However, for younger ages, lithium becomes a less accurate age indicator because the lithium depletion chasm becomes shallower. More physically, lithium depletion becomes much harder to model because the stars involved develop radiative cores, and the amount of lithium observed in the photosphere depends critically on the exact point in the evolution of the star when the radiative core develops and on any mechanism which may mix matter across the core/envelope boundary (see Jeffries 2004). Moreover, activity and spottedness may affect the ability to accurately infer the effective temperature of the star and may affect the observed lithium equivalent width, making derivation of a lithium abundance subject to error (Barrado y Navascués et al. 2001a; Stauffer et al. 2003).
In any case, we have compared the lithium equivalent widths –W(Li)– for our three samples. Figure 13 displays W(Li) versus the spectral type. Lithium depletion isochrones –computed using models by Baraffe et al. (1998), curves of growth by Zapatero Osorio et al. (2002) and the intermediate effective temperature scale by Luhman (1999)– have been included as cyan, short-dashed lines (for ages of 1, 8, 10, 15 and 20 Myr). The scatter of the W(Li) is very large, and we cannot see any trend with accretion (large open circles), induced by the veiling of the spectrum. However, it seems that the upper limit for B30 & B35 is systematically larger (about 0.1 Å) than in the case of Col 69. Might this indicate an enrichment of the material used to built up the members of these two clouds? The alternative would be that some depletion –which seems not to depend on the spectral type– has already occurred in Col 69. Moreover, the W(Li) distribution does not follow the lithium depletion isochrones either, but they impose an upper limit to the age of about 20 Myr, which is not very helpful in any case. Models by D’Antona & Mazzitelli (1994, 1997) or Siess et al. (2000) do not fare any better. Additional theoretical work regarding the Pre-Main Sequence lithium depletion has to be carried out.
3.2.3 An age estimate from the HR diagram
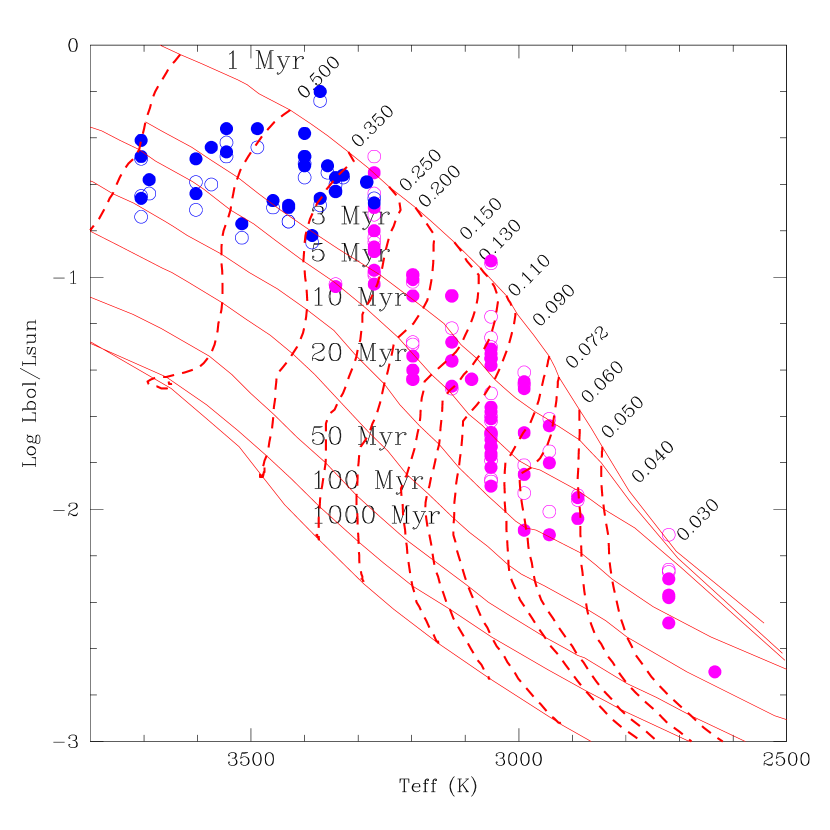
An age estimate for the Col 69 cluster can be obtained by locating its bona fide members in a HR diagram (Figure 14). Luminosities were derived from either the or the magnitudes –open and solid circles, respectively– and bolometric corrections by Comerón et al. (2000) and Tinney et al. (1993). As usual, blue and purple colors denote stars and brown dwarfs from D&M and our own dataset from CFHT/12K. The isochrones and evolutionary tracks come from Baraffe et al. (1998). Effective temperatures have been derived using the temperature scale by Luhman (1999) for intermediate gravity. This figure indicates that the age of the cluster is bracketed by 3 and 10 Myr, allowing some room for binarity. Moreover, based on models by Schaller et al. (1992), the star 1 Orionis, with a mass close to 25 , is about 6 Myr. The models impose a maximum age of 7 Myr, since it would have become a supernova. Therefore, we adopt this value as the maximum age for the Col 69 cluster.
3.3 The Initial Luminosity and Mass Functions

3.3.1 The Luminosity Function
One of our goals is to derived the Initial Mass Function (IMF) in different agglomerates of the LOSFR (B30 & B35, Col 69, etc), and to establish the effect of the different environmental conditions. So far, we have been able to derive the IMF for Col 69. The first step is to obtain the cluster Luminosity Function (LF). For the lower end, we have used a subsample of the Col 69 members from our survey with CFHT/12K which have been classified as probable and possible members. For the middle range of masses, we have used the D&M data which is located in the same projected area of the sky than our CFHT/12K data. Finally, in order to extend the LF to the upper mass end, we have included the O, B, A and F stars listed in Murdin & Penston (1997), after removing some of them, which might not be cluster members because of their location in CMDs. Additionally, we have included an A7 star taken from SIMBAD (HDE244927), which might be a member based on its photometric characteristics (the Tycho parallax does not agree with membership, but errors are quite large).
The LF is illustrated in Figure 15. The bolometric magnitudes were derived in different ways: For the Murdin & Penston (1977) data, we used the V magnitude, the cluster distance modulus and the bolometric corrections by Schmidt-Kaler (1982), which depend on the spectral type. In the case of the D&M and CFHT/12K datasets, we derived the bolometric magnitudes from the magnitude, the cluster distance modulus, and the bolometric corrections by Comerón et al. (2000), which depend on the color . The red solid line represents the LF when all members (probable and photometric binaries) are considered. The blue dashed line was computed after removing possible photometric binaries. The black, dotted vertical segment distinguishes between the stellar and substellar domain. The dip at about M(bol)=2 mag is an artifact due to the lack of completeness for F stars.

3.3.2 The substellar Initial Mass Function
We have derived an IMF for the low mass stars and brown dwarfs based on the D&M and CFHT/12K dataset. Although these two surveys are not completely homogeneous, both provide and photometry and allow the derivation of the LF and IMF in exactly the same way. For this purpose, we have restricted ourselves to the 4228 arcmin FOV of the CFHT/12K. The masses were computed from the magnitude, using theoretical models by Baraffe et al. (1998). Additional details can be found in Barrado y Navascués et al. (2004). We used isochrones with different ages, but the results are essentially independent of the considered age range. Therefore, we will display only the results for 5 Myr, our assumed cluster age.
Figure 16 includes the results for Col 69 (blue and purple lines, for D&M and CFHT/12K, respectively), as well as a comparison with the Sigma Orionis cluster (5 Myr, green dashed line) and M35 (150 Myr, yellow thick line). The completeness limit for Col 69 is indicated by the black, dotted vertical segment. In the case of M35, a very rich cluster (Barrado y Navascués et al. 2001b and references therein), some mass segregation has taken place, as can be appreciated by the drop of the MF below 0.2 . The Sigma Orionis IMF was computed for this paper exactly in the same way as that of Col 69, based on the data published in the literature (see Béjar et al. 2001 and references therein). The same is valid for M35. Note the dip both in the case of Col 69 and Sigma Orionis cluster for masses around 0.04 . This mass range corresponds, for 5 Myr, to M7 spectral type. Dobbie et al. (2002) have found the same kind of structure in older clusters such as IC2391, the Alpha Persei cluster, et cetera, at this spectral type (i.e., the same effective temperature but different masses, because of the evolution with age). They have interpreted this fact as a consequence of a drop in the luminosity-mass relation, perhaps due to the the beginning of dust formation in the stellar/substellar atmospheres of objects at these temperatures.
We have fitted a power low to the derived IMF (rather, the Mass Spectrum, ). The derived index is =+0.600.06 across the stellar/substellar limit (0.03-0.14 ), and a slightly steeper index =+0.860.05 over the whole mass range from 0.024 to 0.86 , using a 5 Myr isochrone. An isochrone from Burrows et al. (1997) gives =+0.690.17 in the range 0.20–0.015 , whereas models from D’Antona & Mazzitelli (1997) are almost identical –regarding the power law index– to those obtained with Baraffe et al. (1998). On the other hand, 3 and 10 Myr isochrones from Baraffe et al. (1998) yield =+0.920.04 and =+0.710.06, respectively (again, in the range 0.024 to 0.86 ). For mass in the range 3–1 , the spectral index is very similar to that of Salpeter.
The slope of Lambda Ori MF at lower masses and into the substellar domain is quite similar to that derived for other young clusters by some of us, e.g. Sigma Orionis (=+0.8, Béjar et al. 2001), Alpha Per (=+0.6, Barrado y Navascués et al. 2002) and the Pleiades (=+0.6, Bouvier et al. 1998; Moraux et al. 2003). The age of these clusters is estimated as 5, 80 and 125 Myr, respectively (Zapatero Osorio et al. 2002; Stauffer et al. 1998, 1999; Barrado y Navascués et al. 2004). The index is also similar to the results obtained in other stellar associations such as Trapezium, IC348 or Taurus (Luhman et al. 2000, 2003; Lucas & Roche 2000; Hillenbrand & Carpenter 2000; Najita et al. 2000; Preibisch et al. 2002; Briceño et al. 2002; Muench et al. 2003).

3.3.3 A 50-0.02 Initial Mass Function
Finally, we have derived an IMF for the whole cluster population down to 0.02 . This has been achieved by using the LF presented in section 3.3.1 (Figure 15). However, since no theoretical set of evolutionary tracks considers the whole mass range of our data, we have been forced to use three different models: For high mass stars we have considered the isochrones by Girardi et al. (2002), whereas for the low mass end those of Baraffe et al (1998). To guarantee that the results merge nicely and there is no obvious bias in the results, we also used the models by D’Antona & Mazzitelli (1997), which cover the masses in between the first two. The results are displayed in Figure 17, where we have plotted the IMFs derived with the models by Girardi et al. (2002), D’Antona & Mazzitelli (1997), and Baraffe et al (1998) as purple dashed, green dotted and red solid lines, respectively. The final result is illustrated by the blue, long-dashed line. Note that this IMF has two important differences in its methodology with the one computed is section 3.3.2. First, in this case we have used the bolometric magnitudes instead the magnitudes. Second, the binning of the magnitudes is wider in this case, in order to diminish the statistical errors (specially in for high masses, were the number of objects is small). As noted before, the dip at 2 is due to the lack of completeness for F stars.

In order to compute the IMF at the high mass end, we have assumed different possibilities. On one hand, we have considered that the most massive star in the cluster is 1 Orionis, but we have assumed that the corresponding mass bin had different values in its upper side (33, 50 and 120 ), with different widths and mass averages. These three possibilities are located in the figure as blue, solid triangles. On the other hand, we have considered the possibility that Col 69 harbored in the past a more massive star, which exploded about 1-2 Myr ago as a supernova, as postulated by D&M. In this case, we can compute the IMF assuming that the SN and the star 1 Orionis fall in the same and in different mass bins. They are represented as blue, open triangles. Regardless the high mass end of the IMF, the slope of the IMF has an index of =+2.270.08 (20–0.8 ), whereas the value is much smaller for lower masses, =+0.730.05 (0.8-0.02 ). The overall trend is very similar to the more massive and older M35 cluster (Barrado y Navascués et al. 2001b).
We have also compared the Col 69 IMF with the Pleiades and the young disk population, in log-form. They are depicted in Figure 18, as blue, dashed-red and solid green, respectively. In order to computed the last two Mass Functions, we have used the expression by Chabrier (2003):
where =0.25 and 0.20, and =0.52 and 0.55, for the Pleiades and the young disk population (after Moraux et al. 2003 and Chabrier 2004, respectively). As can be seen, these IMFs are very similar, except for the fact that Col 69 is not complete for some mass ranges, and the Pleiades, due to its age (about 125 Myr), does not contain massive stars.
4 Conclusions
We are conducting an ambitious study of the star formation and the properties of the LOSFR, a wide area which includes several dark clouds and clusters. In particular, we have collected deep optical photometry, low- and medium resolution spectroscopy, and mined the 2MASS database to select a sample of bona fide members of the Col 69 cluster, which is associated to the star 1 Orionis, located in the center of the LOSFR. With this sample and previously, brighter data, we have been able to derive the Luminosity and Initial Mass Functions of the Col 69 cluster, in the mass range 50-0.02 . Two different behaviors are evident, with a turning point about 0.8 . The high mass stars follow a pattern similar to a Salpeter’s index, whereas low mass stars and brown dwarfs have a much shallower index. In any case, the IMF keeps growing well within the substellar domain (although this is not the case for the LF). Additionally, the IMF, in a log-form, is very similar to the Pleiades and the young disk population.
On the other hand, we have also studied the properties of the Col 69 members (H emission, lithium equivalent width, CMDs and CCDs, HR diagram). We have been able to derive an age for the cluster 52 Myr. Moreover, when comparing these data with members of the B30 & B35 dark clouds, we have inferred that these two associations have a much larger population of Classical TTauri stars (both from the CCD and the distribution of the H emission of their members), are much younger (with an age of about 3 Myr) and have a similar distribution of the lithium equivalent width for the K5-M5 members.
1
References
- [1998] Baraffe I., Chabrier G., Allard F., Hauschildt P. H., 1998, A&A, 337, 403
- [2003] Baraffe I., Chabrier G., Barman T.S., Allard F., Hauschildt P.H., 2003, A&A 402, 701
- [1999] Barrado y Navascués D., Stauffer J.R., Patten B.M., 1999, ApJ Letters 522,
- [2001] Barrado y Navascués D., García López R.J., Severino G., Gomez M.T., 2001a, A&A 371, 652
- [2001] Barrado y Navascués D., Stauffer J.R., Bouvier J., Martín E.L., 2001b, ApJ 546, 1006
- [2002] Barrado y Navascués D., Bouvier J., Stauffer J.R., Lodieu N., McCaughrean M.J., 2002, A&A 395, 813
- [2003] Barrado y Navascués D., Béjar V.J.S., Mundt R., Martín R., Rebolo R., Zapatero Osorio M.R., Bailer-Jones C.A.L., 2003, A&A 404, 171
- [2003] Barrado y Navascués D., Martín E.L., 2003, AJ 126, 2997
- [2004] Barrado y Navascués D., Stauffer J.R, Bouvier J., Jayawardhana R., Cuillandre J-C., 2004a, ApJ 610, 1064
- [2004] Barrado y Navascués D., Stauffer J.R, Jayawardhana R., 2004b, ApJ 614, 386
- [2001] Béjar V. J. S., Martín E. L., Zapatero Osorio M. R., et al., 2001, ApJ, 556, 830
- [] Bessell M.S., Brett J.M., 1988, PASP 100, 1134
- [1998] Bouvier J., Stauffer J.R., Martín, E.L., Barrado y Navascués, D., Wallace B., Béjar, V., 1998, A&A 336, 490
- [Briceño et al.(2002)] Briceño, C., Luhman, K. L., Hartmann, L., Stauffer, J. R., & Kirkpatrick, J. D. 2002, ApJ 580, 317
- [1997] Burrows A., et al. 1997, ApJ 491, 856
- [2003] Chabrier G., 2003, PASP 115, 763
- [2004] Chabrier G., 2004, in “IMF@50: The Initial Mass Function 50 years later”, eds., E. Corbelli, F. Palla, and H. Zinnecker. Astrophysics and Space Science Library , Kluwer Academic Publishers
- [2000] Comerón F., Neuhëuser R., Kaas A.A., 2000 A&A 359, 269
- [Cutri et al. (2003)] Cutri R.M., et al. 2003, “2MASS All-Sky Catalog of Point Sources”, University of Massachusetts and Infrared Processing and Analysis Center, (IPAC/California Institute of Technology).
- [1997] D’Antona F., & Mazzitelli I. 1994 ApJ Suppl. 90, 467
- [1997] D’Antona F., & Mazzitelli I. 1997, in “Cool Stars in Clusters and Associations”, ed. R. Pallavicini & G. Micela, Mem. Soc. Astron. Italiana, 68 (4), 807
- [Diplas & Savage (1994)] Diplas A., Savage B.D. 1994, ApJS, 93, 211
- [] Dobbie P.D., Pinfield D.J., Jameson R.F., Hodgkin S.T., 2002, MNRAS 335, 79
- [] Dolan C.J & Mathieu R.D., 1999, AJ 118, 2409
- [] Dolan C.J & Mathieu R.D., 2001, AJ 121, 2124
- [] Dolan C.J & Mathieu R.D., 2002, AJ 123, 387
- [] Duerr R., Imhoff C.L., Lada C.J., 1982, ApJ 261, 135
- [] Girardi L., et al. 2002, A&A 391, 195
- [] Hillenbrand L.A., Carpenter J.M., 2000, ApJ 540, 236
- [] Jeffries R.D., 2004, in “Chemical abundances and mixing in stars in the Milky Way and its satellites”, eds. L. Pasquini, S. Randich. ESO Astrophysics Symposium (Springer-Verlag)
- [] Kirkpatrick J.D. et al. 2000, AJ 120, 447
- [] Leggett S.K., Allard F., Geballe T.R., Hauschildt P.H., Schweitzer A., 2001, ApJ 548 908
- [] Lucas P.W., Roche P.F., 2000, MNRAS 314, 858
- [1999] Luhman K. L. 1999, ApJ, 525, 466
- [] Luhman K.L., 2000, ApJ 544, 1044
- [2003] Luhman, K.L., Briceño, C., Stauffer, J.R., Hartmann, L., Barrado y Navascués, D., Caldwell, N., 2003, ApJ, 590, 348
- [1997] Martín E. L., 1997, A&A 321, 492
- [1999] Martín E. L., Magazzù A., 1999, A&A 342, 173
- [] Meyer M.R., Calvet N., Hillenbrand L.A., 1997, AJ 114, 288
- [2003] Moraux E., Bouvier J., Stauffer J.R., Cuillandre J.-C., 2003, A&A 400, 891
- [] Muench A.A., Lada E.A., Lada C.J., Elston R.J., Alves J.F., Horrobin M., Huard T.H., Levine J.L., Raines S.N., Román-Zúñiga C. 2003, AJ 125, 2029
- [1997] Murdin P., & Penston M.V., 1997, MNRAS 181, 657
- [] Najita J., Tiede G.P., Carr J.S., 2000, ApJ 541, 977
- [] Preibisch T., Brown A.G.A., Bridges T., Guenther E., Zinnecker H., 2002, AJ 124, 404
- [1985] Rieke G.H. & Lebofsky M.J., 1985, ApJ 288, 618
- [2000] Siess L., Dufour E., Forestini M., 2000, A&A 358, 593
- [1992] Schaller G., Schaerer D., Meynet G, Maeder A., 1992, A&A Suppl., 96, 269
- [1982] Schmidt-Kaler T., 1982, , in Landolt-Börstein, Vol. 2b, eds. K. Schaifers, H.H. Voig. Springer, Heidelberg.
- [1998] Stauffer J.R., Schultz G., Kirkpatrick J.D., 1998, ApJ Letters 499, 199
- [1999] Stauffer J.R., Barrado y Navascués D., Bouvier J., et al. 1999, ApJ 527, 219
- [2003] Stauffer J.R., et al. 2003, AJ 126, 833
- [1993] Tinney C.G., Mould J.R., Reid I.N., 1993, AJ 105, 1045
- [2002] Zapatero Osorio M.R., Béjar V.J.S., Pavlenko Ya., Rebolo R., Allende Prieto C., Martín E.L., García López R.J., 2002, A&A 384, 937.
- [] Zhang C.Y., Laureijs R.J., Chlewicki G., Clark F.O., Wesselius P.R:, 1989, A&A 218, 231