Near-Infrared Properties of Faint X-rays Sources from NICMOS Imaging in the Chandra Deep Fields
Abstract
We measure the near-infrared properties of 42 X-ray detected sources from the Chandra Deep Fields North and South, the majority of which lie within the NICMOS Hubble Deep Field North and Ultra Deep Field. We detect all 42 Chandra sources with NICMOS, with 95% brighter than H160 = 24.5. We find that X-ray sources are most often in the brightest and most massive galaxies. Neither the X-ray fluxes nor hardness ratios of the sample show any correlation with near-infrared flux, color or morphology. This lack of correlation indicates there is little connection between the two emission mechanisms and is consistent with the near-infrared emission being dominated by starlight rather than a Seyfert non-stellar continuum.
Near-infrared X-ray sources make up roughly half of all extremely red (J110-H160 1.4) objects brighter than H160 24.5. These red X-ray sources have a range of hardness ratios similar to the rest of the sample, decreasing the likelihood of dust-obscured AGN activity as the sole explanation for their red color. Using a combination of spectroscopic and photometric redshifts, we find the red J110-H160 objects are at high redshifts (1.5), which we propose as the primary explanation for their extreme J110-H160 color. Measurement of rest-wavelength absolute B magnitudes shows that X-ray sources are the brightest optical objects at all redshifts, which explains their dominance of the bright end of the red J110-H160 population.
1 Introduction
The Chandra Deep Fields North and South are the deepest X-ray pointings on the sky, with integration times of 2 and 1 Msec, respectively. They resolve 80-90% of the hard X-ray background (Campana et al., 2001; Cowie et al., 2002; Rosati et al., 2002; Alexander et al., 2003a), identifying active galactic nuclei (AGN) out to redshifts greater than =5 (Barger et al., 2003a). Hardness ratios suggest that many faint X-ray sources are obscured AGN, although some of these may exist in galaxies where the bolometric luminosity is dominated by star formation rather than black hole accretion (Bauer et al., 2002a; Alexander et al., 2003b).
Bright X-ray sources have well defined optical to X-ray flux ratios (fX/fopt0.5-1), seen in both soft (0.5-2 keV; Lehmann et al., 2001) and hard (2-8 keV; Akiyama et al., 2000) X-rays. However, fainter X-ray sources can have optical fluxes covering a much wider range. A large population of star-forming galaxies becomes detectable at X-ray depths of 1-2 Msec (Hornschemeier et al., 2001, 2002; Bauer et al., 2002b), where supernova remnants and mass transfer binaries produce the bulk of X-rays (Fabbiano, 1989). These star-forming galaxies add low fX/fopt sources to the distribution (Brandt et al., 2001; Alexander et al., 2001; Barger et al., 2003b), disrupting the previously well-behaved optical/X-ray correlation. Correlations also exist between X-ray and radio (Bauer et al., 2002a), 15m (Alexander et al., 2002a; Fadda et al., 2002), and sub-mm (Barger et al., 2001b; Alexander et al., 2003b) detections. Examinations of X-ray spectral slopes and emission lines in these sources suggest a substantial percentage of these sources are dominated by star formation, although AGN activity can not usually be ruled out. These X-ray sensitivities can even detect X-rays from“normal” star-forming galaxies, like our Milky Way, out to =0.15-0.3, which make up 12% of the 2 Msec CDF-N sample (Hornschemeier et al., 2003).
X-ray detected sources are typically among the reddest galaxies when color is measured from the optical to near-infrared (Mushotzky et al., 2000; Barger et al., 2001a; Cowie et al., 2001; Crawford et al., 2001; Alexander et al., 2001). Roughly 10-20% of Extremely Red Objects (EROs) are detected in the X-ray (Alexander et al., 2002b; Roche et al., 2003), only 2/3 of which are clearly AGN. Generally, the more optically faint an X-ray object is, the redder its optical/near-IR color will be (Alexander et al., 2001), although there are some faint blue exceptions.
Optically faint sources are blue in V-I (Koekemoer et al., 2002), red in I-K (Alexander et al., 2001), and generally have flat (i.e. hard) X-ray slopes. Higher redshifts may explain both the blue V-I and red I-K colors, a result of the 4000Å break and falling UV continuum shifting beyond the I-band filter at 1 (Barger et al., 2003b). Large X-ray luminosities are required to detect galaxies at high redshift, so these X-ray sources found at such distances are likely AGN, only with optical/near-infrared fluxes that are dominated by starlight.
Studies that combine spectroscopic and photometric redshifts find that most faint (fX(0.5-2 keV)510-16 ergs cm-2 s-1) X-ray sources lie in the redshift range =0.2-1.3, with a median redshift of 1 and a long tail of sources trailing out to very high redshift (4) (Barger et al., 2003b). This indicates that the bulk of optical observations to date have taken place in the rest-frame ultraviolet and blue. These wavelengths are notoriously susceptible to dust extinction and recent star formation activity, but remain fairly insensitive to the underlying mass distribution of the galaxy.
Deep ground-based optical and near-infrared imaging detects roughly 85% of these faint Chandra X-ray sources (Mushotzky et al., 2000; Barger et al., 2001a; Rosati et al., 2002; Barger et al., 2003b). Even fairly deep Hubble Space Telescope optical imaging can not always identify every X-ray source (Koekemoer et al., 2004), indicating a need for deep, near-infrared space imaging.
We examine NICMOS imaging of 42 X-ray sources from the Chandra Deep Fields North and South. They lie mainly within the NICMOS HDF-N and and the NICMOS Ultra Deep Field (UDF), although a small subset of sources come from other publicly available NICMOS data. We examine their colors, hardness, x-ray flux, and morphology and compare that to other NICMOS field galaxies. Throughout this paper we assume a =0.3, =0.7, Ho=70 km s-1 Mpc-1 cosmology. All magnitudes are given in the AB magnitude system. Often, H160, J110, and I775 will be used in place of F160W, F110W, and F775W to simplify discussion of magnitudes, depths and colors.
2 Observations
We use the Chandra X-ray Observatory point source catalogs for both the 2 Msec CDF-N (Alexander et al., 2003a) and the 1 Msec CDF-S (Rosati et al., 2002). We used the catalogs generated by Alexander et al. (2003a) for both fields, to ensure a consistent comparison of the two fields and to maximize the positional accuracy (median positional offset from optical detections). The CDF-N catalog contains 503 sources over roughly 250 square arcminutes, although the sensitivity and source counts drop away from the center. The CDF-S catalog contains 326 X-ray sources over roughly the same area, with a similar sensitivity distribution. The CDF-N field reaches 0.5-8 keV fluxes of 10-16 ergs s-1 cm-2, while the CDF-S reaches 0.5-8 keV fluxes 210-16 ergs s-1 cm-2. The 42 sources that lie within NICMOS images are listed in Table 1, labeled by the letter ’N’ for north or ’S’ for south, combined with its number from the Alexander et al. (2003a) catalogs.
The near-infrared images used for this study were obtained with NICMOS (Thompson et al., 1998) on board the Hubble Space Telescope. The data include the NICMOS HDF-N (Dickinson et al., 2000), the NICMOS UDF (HST Program 9803, PI: R. Thompson), and seven smaller fields taken in pure parallel mode(McCarthy et al., 1999) or for other unrelated science goals. The NICMOS HDF-N covers 7 square arcminutes of the CDF-N, reaching depths in the F160W filter of H160=27 magnitudes (5-, 0.8 aperture). The NICMOS UDF also covers about 7 square arcminutes and reaches H16027.5. Both images were drizzled (Fruchter & Hook, 1997) as part of their original reduction, producing images with a point-spread function (PSF) of FWHM 0.25 arcsec. The two fields were taken using NICMOS Camera 3 and include F110W (J11026.5 and 27.1) images in addition to F160W. Because these fields cover only 15 square arcminutes of sky, this study could be strongly effected by cosmic variance, although we are helped by the combination of two distantly separated regions of sky.
We chose the ACS F775W filter for comparison between optical and near-infrared properties. For the NICMOS UDF, we used the F775W Ultra Deep Field image (HST Program 9978, PI: S. Beckwith), which covers the entire near-infrared image down to an AB magnitude of 29.5 (S/N 5). For the HDF-N, we used the F775W GOODS data set (Giavalisco et al., 2004), which reaches an AB magnitude of around 27.5. While the Hubble Deep Field F814w filter observation is deeper (F814W28.0), it does not cover the entire NICMOS HDF-N and has no equivalent in the south. The majority of the X-ray detected sources are significantly brighter than the GOODS limit (median I77522.2 and 95% are brighter than I775=27.5 limit), indicating the lesser depth is an acceptable trade-off for the filter consistency and field coverage. To minimize systematic errors associated with comparing galaxies at different resolutions, we convolved the ACS images with a Tiny Tim NICMOS PSF to match the NICMOS resolution.
We also include NICMOS images taken in parallel to other observations (McCarthy et al., 1999) within the Chandra Deep Field North. This provides five additional sources from three parallel NICMOS fields, all in the CDF-N (1235+6208, 1235+6218, & 1237+6206). There are presently no CDF-S NICMOS parallels that overlap with X-ray sources. The parallel images are not drizzled, so have slightly lower image resolution (PSF 0.3), and reach depths of H26. They lie outside the GOODS field, so we use the Subaru SuprimeCam Hawaii Deep Field North I-band image (I25.6 limit, 0.7 seeing; Capak et al., 2004) to get comparable optical data. Finally, we include two NICMOS Camera 2 images with one X-ray source each. Both fields were originally taken for separate science programs – a study of high-z Type Ia Supernovae (HST Program 9352, PI: A. Riess) and Tully-Fisher galaxies (HST Program 7883, PI: N. Vogt). While shallower (H16025.5 and 23), they have superior resolution (PSF 0.15). Both lie within the GOODS fields, split between the south and north. None of the parallel images have corresponding F110W images. One of the Camera 2 images does have F110W data, although the source detected in the F110W filter is less than 5- in significance.
The X-ray coordinates are generally accurate to better than 0.6 as measured from 1.4 GHz radio (North) and R-band (South) source positions (Alexander et al., 2003a), making misidentification of the near-infrared counterpart unlikely. The median positional difference between the X-ray and NICMOS near-infrared centroids is 0.11, with a standard deviation of 0.24. Only one source has an offset greater than 0.7, N245 at 1.3. No other near-infrared source can be reasonably identified with it and positional errors allow this faint X-ray source to lie in the outer parts (as opposed to the center) of the presently associated NICMOS galaxy.
2.1 Magnitudes and Optical/Near-Infrared Colors
To create a catalog of near-infrared sources, we ran SExtractor V.2.0.19 (Bertin & Arnouts, 1996) on the F160W images, extracting objects with 9 connected pixels with signal greater than 1.5- above the local background. For photometry, SExtractor measured a BEST magnitude, which is either a Kron elliptical aperture (Kron, 1980) or an isophotal magnitude for blended/crowded objects. We further required that the flux be at least a 5- detection as measured within a 0.8 aperture. Only one of the 42 X-ray sources failed detection by this second criteria: N231. With a H160 magnitude of 27.29 0.21, it fell just below the 5- HDF-N limit. Another source, S259, was weakly detected just above the 5- limit in its NICMOS Camera 2 image at H=25.34. The other 40 sources have AB magnitudes less than H160=24.5, much brighter than the limiting magnitudes for all the NICMOS fields examined (26-27.5 magnitudes).
To measure colors, we ran SExtractor on the F110W and convolved F775W images using the source positions from the F160W images and measured the flux within a 0.8 aperture. The only exception to this method is for the ground-based Hawaii Deep Field North data, which has a much lower spatial resolution. Rather than blur the NICMOS data by a factor of 3-4, we compared the SExtractor BEST magnitudes. This approach should be considered less accurate, but we see no systematic difference in I-H160 color between these parallel objects and the rest of the NICMOS sample.
3 Asymmetry and Concentration
To study the morphologies of the NICMOS sample, we use the CAS system (Conselice et al., 2003; Conselice, 2003; Conselice et al., 2000), which provides indices for concentration, asymmetry, and clumpiness. We measured these indices using CAS software written for IRAF111IRAF is distributed by NOAO, which is operated by AURA, Inc., under contract to the NSF.(C. Conselice, private communication). The resolution of NICMOS Camera 3 images is poorly suited for measuring clumpiness at high redshifts, as the clumpiness index is most vulnerable to decreasing resolution, so we will exclude it from further discussion. While the asymmetry index is also sensitive to resolution, the effect is smaller and more predictable (Conselice, 2003). More importantly, resolution effects always produce smaller asymmetries, so large values of the index remain a reliable indicator of strong asymmetry. A full decomposition of the light profile was rejected as a morphology measurement because it is too dependent on a priori assumed morphologies, which are known to become more irregular at high redshift (Abraham et al., 1996; Conselice et al., 2004) and because the NICMOS Camera 3 resolution is too low to allow a robust decomposition of a large percentage of the sources (median NICMOS object FWHM 1.5 PSF).
Simulations by Conselice et al. (2000) demonstrate that one can obtain reliable asymmetry values with a S/N=50, although S/N=100 is recommended for best results. Seven of the 42 X-ray sources do not meet the minimum (S/N=50) threshold and are excluded from morphological analysis. Of the rest, only two fall between S/N=100 and 50. Visual inspection of source morphologies is consistent with their measured concentration and asymmerty parameters.
We measure the concentration and asymmetry indices using five blank sky regions and average the results. This method follows Conselice et al. (2003), who find that asymmetry can vary depending on the area selected for blank sky.
The X-ray sources have mostly symmetric NICMOS morphologies, with a distribution similar to those of non-X-ray emitting NICMOS sources (see Figure 1). Two objects stand out as strikingly asymmetric (N272 & N287) and therefore possible merging systems. This result is in agreement with the optical result of Grogin et al. (2003) that the distribution of asymmetry indices for X-ray sources is indistinguishable from that for field galaxies. Nucleus-dominated sources are very symmetric, so a bright nuclear source could hide a more disturbed asymmetric morphology. Unfortunately, most spiral and elliptical galaxies are also highly symmetric, making asymmetry a poor discriminant for nuclear bright AGN.
Grogin et al. (2003) also find significantly higher concentrations among X-ray sources. This differs from Hornschemeier et al. (2003), who found no significant difference in concentrations for X-ray sources, although they only examined the optically brightest sources (R 22 compared to I 23.5). The near-infrared sources appear to be slightly more concentrated compared to the main sample (median CField=2.7 versus CX-ray=2.9), but not as strongly as seen in the Grogin et al. (2003) optical sample. Sources with bright nuclei should generally lead to higher concentrations, although Grogin et al. (2003) cautions that may not always be the case.
To investigate these concentration differences further, we measured the morphologies of both the X-ray and field sources in the original, non-convolved I775 images. We find that the distribution of field I775 concentrations are essentially identical to that seen in H160 images. The agreement between the I775 and H160 field concentrations indicates that image resolution is unlikely the cause for the difference between I775 and H160 X-ray source concentrations. This is further supported by the simulations of Conselice (2003), which demonstrate that reliable concentration indices can be measured in NICMOS images out to =3.
The I775 concentrations for the X-ray detected sample show a 0.2-0.3 increase in typical concentration compared to H160. The difference between the X-ray and field sample concentrations measured in I775 is therefore the same as that seen by Grogin et al. (2003). We conclude that X-ray sources are in fact slightly less concentrated in near-infrared light, possibly an indication of increased contribution by more distributed stellar light.
4 Correlation With X-ray Properties
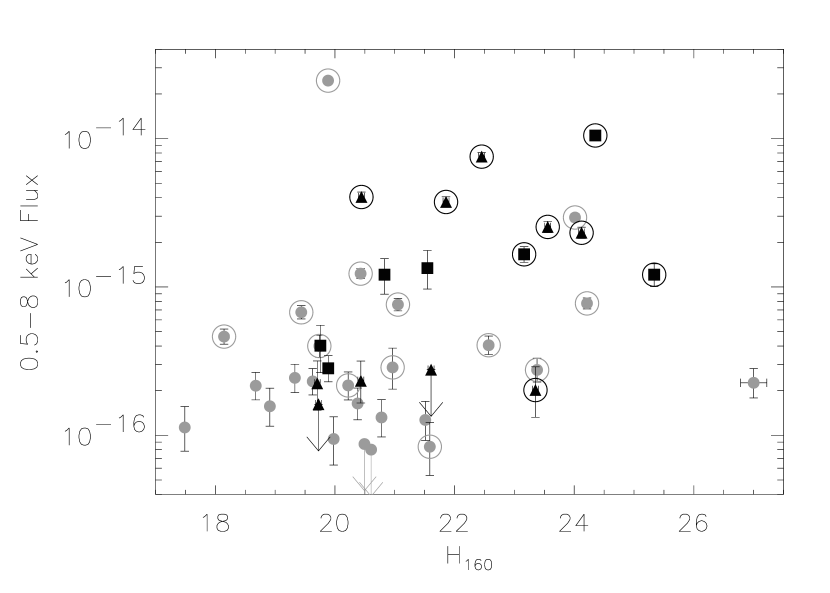
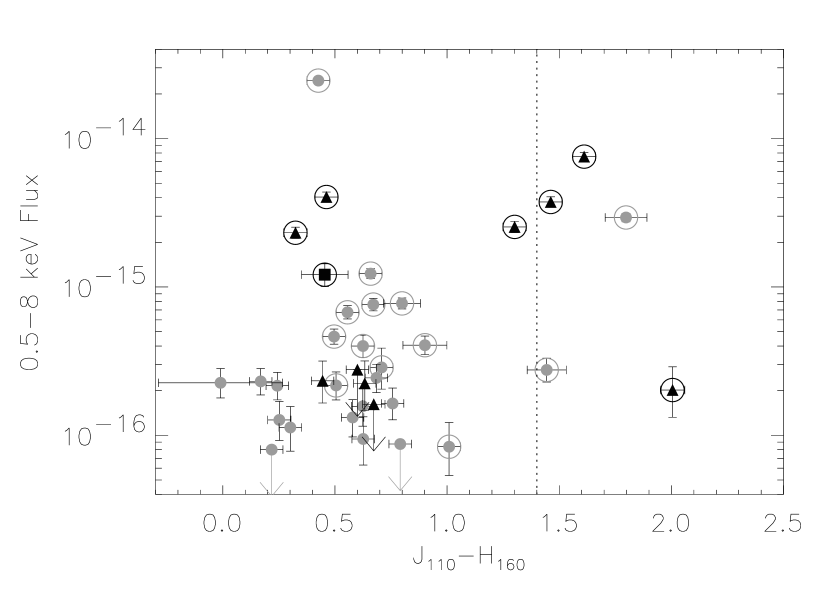
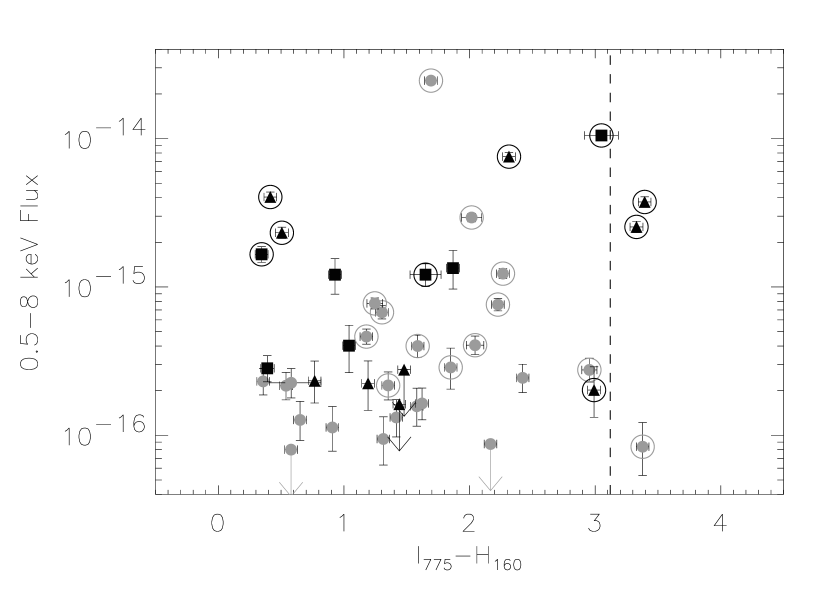
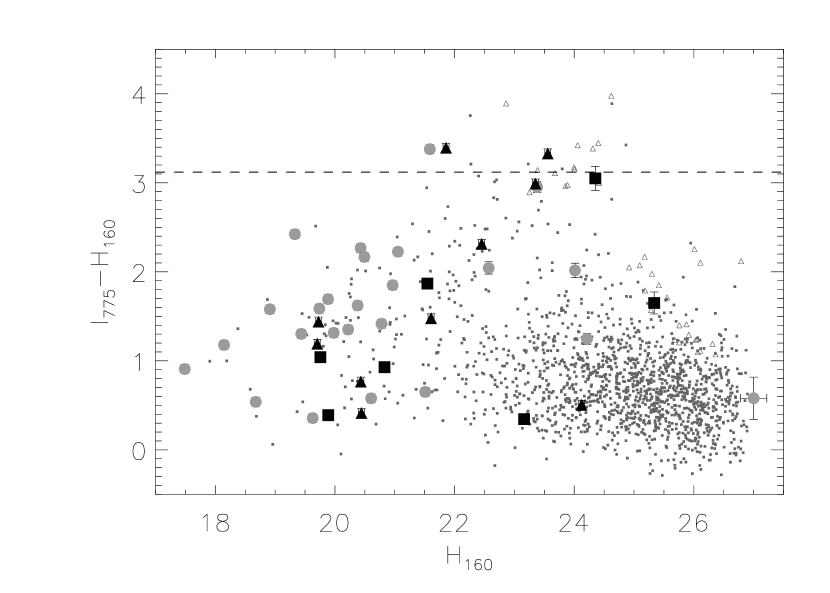
The X-ray full-band flux (0.5-8 keV) shows no correlation with either the H160 magnitude (see Figure 2a), the J110-H160 color (see Figure 2b) or the morphology of the NICMOS image, all producing Pearson correlation coefficients (PCC) less than 0.12. Visually, Figure 2a appears to suggest an anti-correlation between H160 and X-ray flux (PCC=-0.11), but this is caused by the lack of near-infrared bright galaxies with large X-ray fluxes within the relatively small area covered. These near-infrared bright, X-ray weak objects are all at low redshifts, where the X-rays appear to come from star formation. If the X-ray full-band flux shows any correlation it is with I775- H160 color (PCC=0.17; see Figure 2c), where larger X-ray fluxes appear to produce redder colors, although with a large scatter. If H160 is uncorrelated with X-ray flux, then an I775- H160 correlation would imply that I775 grows fainter with X-ray flux, which is opposite to what is generally observed (Lehmann et al., 2001). However, most studies have been done at much brighter X-ray fluxes than those reached in the Chandra Deep Fields. Examining the CDF-N, Barger et al. (2003b) shows that the R magnitude to X-ray flux (both 0.5-2 keV and 2-8 keV) correlation breaks down at these faint X-ray flux levels, as nearby, quiescent star-forming galaxies make up a larger percentage of X-ray sources.
Using the soft-band (0.5-2 keV) X-ray detections has little effect on these results, with the possible effect of marginally strengthening the weak X-ray flux and I775- H160 color correlation (PCC=0.24). The hard-band (0.5-2 keV) X-ray detections show weaker correlations than either the full-band or soft-band fluxes, although the number of hard-band X-ray detections is smaller (22), making robust correlation measurements more difficult. None of the weak correlations discussed at any X-ray bandwith could be considered even moderately convincing and all measurements are consistent with no correlations whatsoever.
This lack of correlation indicates the source of the X-rays does not make much contribution to the near-IR continuum in most of these objects. Studies of bright, nearby AGNs show a correlation between X-ray and near-infrared flux (Edelson & Malkan, 1986; Kotilainen et al., 1992), although the measurements concentrate on the central regions. Most of the NICMOS X-ray sources lie at high redshifts, so a better rest-wavelength comparison would be the optical/X-ray correlation seen in bright X-ray sources (Akiyama et al., 2000; Lehmann et al., 2001), where the optical fluxes encompass the whole galaxy. The faint X-ray sample could be different, either because the rest-frame optical emission from the active central Seyfert nuclei is heavily obscured by dust, or perhaps because most of the X-ray emission is coming from extended starbursts rather than an active nucleus.
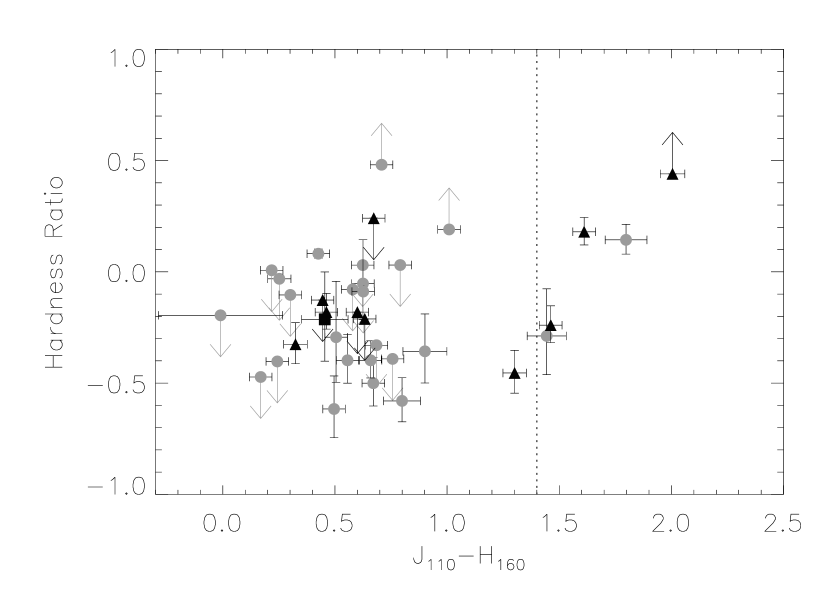
All the reddest objects (J110-H160 and I775- H160) have been detected in hard-band, while there is a blue population of faint X-ray faint objects detected only in soft-band. This does not, however, indicate a correlation between color and X-ray hardness. The hardness ratio (HR), defined as (H-S)/(H+S) where H is hard-band (2-8 keV) counts and S is soft-band (0.5-2 keV) counts (Rosati et al., 2002), shows no correlation with near-infrared flux or color (see Figure 3), although the smaller number of hard-band detections makes these correlation measurements less significant. It appears that the fainter near-infrared fluxes and redder near-infrared colors can not be explained entirely by obscured active galactic nuclei, where a dusty torus or other obscuration is absorbing both optical/near-infrared and X-ray light. Most likely X-ray sources at these faint flux levels are a heterogeneous group, composed of both obscured and non-obscured AGN, and star-forming galaxies, ranging from starburst to “normal” Milky Way levels of star formation.
5 Near-Infrared Faint Objects
We detect all 42 X-ray sources in the NICMOS images and only one of these is detected with less than a 5- significance. Previous attempts at imaging optically faint X-ray sources using ultra-deep VLT/ISAAC imaging (K24) (Koekemoer et al., 2004; Yan et al., 2003), still left a handful of sources either unidentified or only marginally detected. Two of the faint NICMOS detections from this work would have been undetectable in such ground-based studies, although neither is as optically faint as the undetected sample from Koekemoer et al. (2004). It should be kept in mind, however, that this study covers only two small regions of sky and therefore cosmic variance will have a large effect on all the results, particularly those concerning extremely red objects, which have been measured to vary a great deal (factors of 3-7) from field to field (Saracco et al., 2001; Labbe et al., 2003).
The faintest near-infrared source, N231, has relatively blue colors: J110-H160= -0.110.4 and I814-H160= 0.290.3. Its X-ray flux is weak, but is detected at roughly twice the faint detection limit of the CDF-N sample. It also does not have a hard X-ray index (HR -0.2). It is much too faint to produce any reliable morphology indices, but visual inspection of the image suggests a diffuse, non-compact shape. Template fitting suggests a redshift around =1, but such fits should be treated cautiously considering the large (10-40%) photometric errors involved.
The other faint source, S259, has colors neither particularly red nor blue (J110-H160 0.45; I775-H160=1.650.12) and a simlar hardness ratio (-0.2). Its shape appears compact, but the signal-to-noise is too low for quantitative morphological measurement.
There are nearly three magnitudes between the near-infrared flux of N231 and the majority of the X-ray sources. The next faintest object, S259, is still two magnitudes brighter than N231. This suggests that N231, and perhaps S259 as well, are different types of object or in a different phase than the rest of the X-ray sample.
Regardless of the origin of these two objects, the percentage of the total X-ray population that are near-infrared weak is not large, representing only 5% of the sources. The rest of the sample (H24.5) can be detected using the deepest ground-based near-infrared photometry (ex. the VLT FIRES project achieved a 5- limit of H25.5, Labbe et al., 2003).
6 Extremely Red NICMOS Sources
Several studies have shown that faint X-ray sources are, on average, redder in optical/near-infrared color as near-infrared flux decreases (Alexander et al., 2001; Barger et al., 2003b). We see this relationship continue at fainter near-infrared magnitudes, down to H160 24.5, below which we do not detect X-ray sources (with two exceptions as noted above). Figure 4 shows I775-H160 color versus H160 magnitude.
There are 14 Extremely Red Objects (EROs, defined as I775-H1603.1; equivalent to I775-H1604 in Vega magnitudes) down to H160=24.5 in the NICMOS HDF-N and UDF, of which 3 (21%) are detected X-ray sources (1 in HDF-N, 2 in UDF). Considering the small numbers involved, this is consistent with both the 8-11% found by Roche et al. (2003) and Alexander et al. (2002b) at comparable depths (K24), and the 21% found by Alexander et al. (2002b) in a shallower ERO survey (K22). We note that the X-ray flux of the HDF-N ERO is one of the faintest in our sample and would therefore not have been detected in the present CDF-S or the earlier 1 Msec CDF-N surveys. The two UDF EROs, S233 and S246, were previously noted in the Roche et al. (2003) sample.
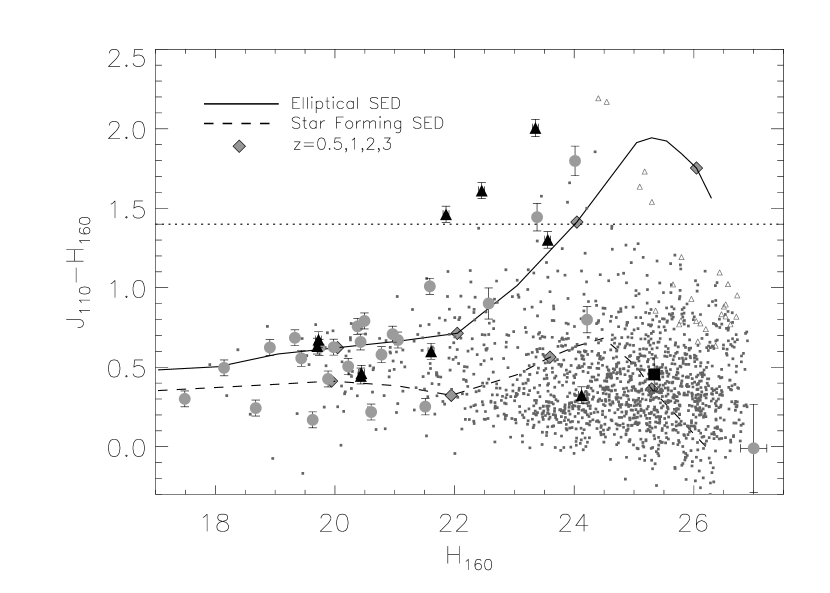
The brighter near-infrared X-ray sources have J110-H160 colors typical of the faint galaxies generally detected in NICMOS images (see Figure 5). However, a large fraction of the faint near-infrared X-ray sources (H16021.5) are significantly redder than a typical field galaxy. If we define extremely red J110-H160 objects as any source with J110-H160 1.4, the predicted color of an elliptical galaxy at a redshift of =2, 5 of 14 (36%) faint near-infrared X-ray sources are extremely red. While a small number of sources, the large gap in J110-H160 color may indicate that there are two subpopulations of faint, X-ray sources. There is a similar trend for near-infrared objects seen in Cowie et al. (2001), where all three lensed X-ray sources observed had extremely red colors consistent with evolved galaxies at redshifts 1.4, and in Yan et al. (2003), which found extremely red near-infrared colors for 4 of its 6 optically unidentified X-ray sources.
Not only are many faint near-infrared X-ray sources extremely red in J110- H160, but a high percentage of all red J110- H160 sources are detected in X-rays. Red J110-H160 colors appear to select X-ray sources at a higher rate than optical/near-infrared colors (i.e. EROs). If we select all extremely red J110-H160 objects in the HDF-N and UDF down to our H160=24.5 limit, 5 out of 10 are X-ray sources. Less strict J110-H160 color cut-offs produce slightly lower percentages, but do not change the general conclusion that a large percentage of red J110-H160 objects are detected in X-rays. Down to the faintest near-infrared sources (H16024.5), the reddest object at almost every magnitude interval is an X-ray source.
6.1 Interpretation of the Reddest Sources
Red J110-H160 sources may be heavily obscured AGN. Studies of low redshift, red J-K sources from 2MASS, for instance, produce a high percentage of dust-extincted AGN (80% Marble et al., 2003). However, the red NICMOS X-ray sources do not, in general, have the hard X-ray slope that one might expect from a heavily extincted AGN (see Figure 3).
A soft X-ray slope does not completely rule out strong nuclear dust obscuration. Wilkes et al. (2002), for instance, find that dusty, red J-K AGNs from 2MASS do not have hard X-ray ratios, which they attribute to a decoupling of near-infrared reddening and X-ray absorption, possibly from large dust grains or different dust-coverage over the optical/IR and X-ray-emitting regions. On the other hand, they find that the reddest objects were also those faintest in X-rays, while four of the reddest NICMOS sources are among the X-ray brightest in the sample, both in flux and absolute luminosity. Also, the majority of known red J-K AGN lie at much lower redshifts than the NICMOS faint X-ray sources, so that the measured near-infrared fluxes are sampling different rest wavelength regimes.
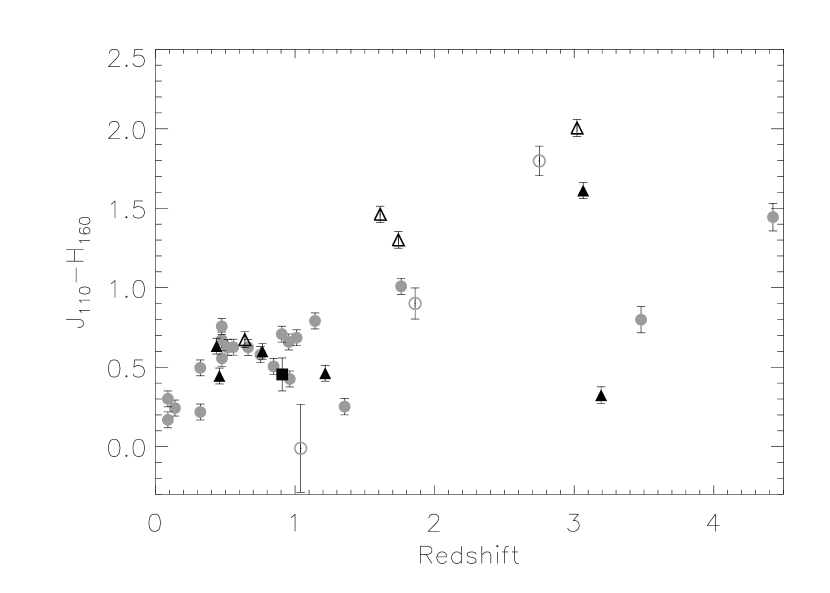
Another possibility is that the red J110-H160 sources are at redshifts slightly above 1.5, where the UV slope has moved into the F110W bandpass. Cowie et al. (2001), for instance, suggested that many optically faint Chandra sources seemed to lie in high redshift evolved galaxies, producing extreme near-infrared colors. We assembled redshifts for the X-ray sources in the HDF-N and the UDF, using published spectroscopic redshifts where available (Lowenthal et al., 1997; Cohen et al., 1999; Barger et al., 2003b; Szokoly et al., 2004). For the remaining seven sources (3 in HDF-N, 4 in UDF) we used published photometric redshifts (Fernandez-Soto, Lanzetta & Yahil, 1999; Wolf et al., 2004), supplemented by redshifts produced using a Bayesian photometric redshift code (Benitez, 2000). We plot the resulting redshifts versus J110-H160 color in Figure 6a.
Of the six red J110-H160 objects, all are at redshifts greater than 1.5. Two have spectroscopic redshifts: S245, a class 2 QSO at =3.064 (Szokoly et al., 2004) and N220, a radio galaxy identified at a redshift of =4.424222There is reason to doubt the N220 redshift, as it based on a Ly detection an arcsecond from the radio source and its optical counterpart (Barger, Cowie, & Richards, 2000). Its slightly blue B-V colors also suggest that it is at a (Cristiani et al., 2004). However, the lack of any detection of emission lines suggest the source is at 1.5 (Barger, Cowie, & Richards, 2000), i.e. at a high redshift. Therefore we will continue to use the =4.424 redshift for this paper, as it makes little qualitative difference to our results exactly how high the redshift is.(Brandt et al., 2001; Waddington et al., 1999). Probably the most well studied of these red objects is N267, with a HDF-N photometric redshift of 2.75 (Fernandez-Soto, Lanzetta & Yahil, 1999). This object (also known as NICMOS J123651.74+621221.4) is the second reddest source in the NICMOS HDF-N and has been previously noted for its color, x-ray, radio and mid-infrared properties (Dickinson et al., 2000; Hornschemeier et al., 2000; Aussel et al., 1999; Richards, E. A. et al., 1998). The three remaining sources, all in the UDF, have photometric redshifts of 1.61, 1.74, & 3.02. The red X-ray sources are small and compact in shape, except for S246333S246 is larger and appears to be a disk galaxy with a bright, red core. This extended image may indicate that the =1.61 photometric redshift is incorrect. COMBO-17 gives a photometric redshift of =0.27 (Wolf et al., 2004). However, optical spectroscopy of this object and the compact =1.74 S233 source produced no redshift (Szokoly et al., 2004), leading us to believe the higher redshifts are likely correct..
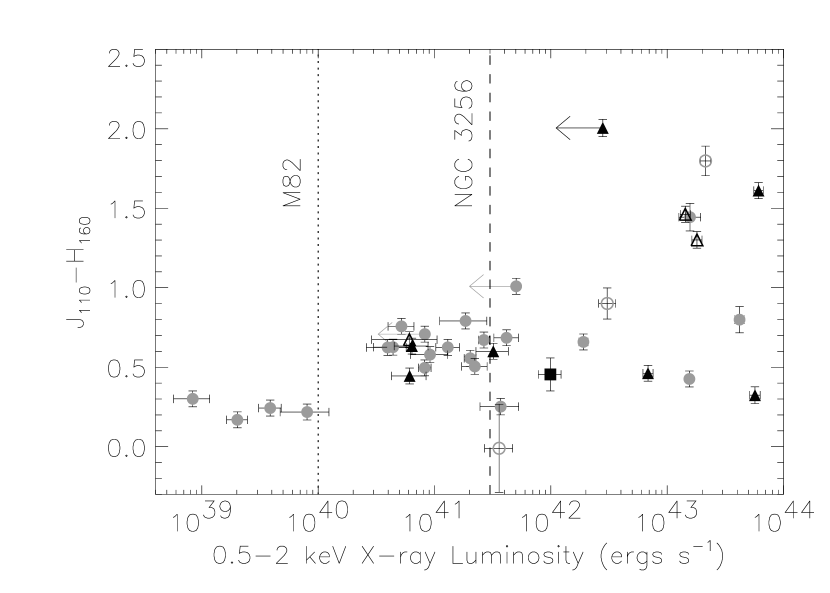
The reddest sources have 0.5-2 keV luminosities greater than 1042 ergs s-1 (Figure 6b), except for S243, which is only detected in hard X-rays. For comparison, the most X-ray luminous starburst known, NGC 3256 (Moran, Lehnert, & Helfand, 1999), has a 0.5-2 keV luminosity of 31041 ergs s-1. More typical starbursts, like M82, generally produce 1040 ergs s-1 (Griffiths et al., 2000). Even accounting for an increase of X-ray luminous starbursts with redshifts, it is apparent the majority of the red sources must be mainly powered by AGN activity.
The extreme red color of these high redshift X-ray sources results from steeply falling ultraviolet flux shortward of the 4000 Å break moving into the NICMOS filters. An unobscured AGN spectral energy distribution should not drop that rapidly in the ultraviolet, indicating that the rest-frame optical/ultraviolet light could be dominated by starlight. This possibility is supported by the lack of correlation between near-infrared flux and X-ray flux, suggesting that they come from different sources. There is also no trend of concentration with either near-infrared or X-ray luminosity, although the X-ray sources are marginally more centrally concentrated than field galaxies. However, simulations adding point-source flux to HST galaxy profiles indicate point sources have only a small effect on concentration (+0.1) and in some cases could actually cause a decrease in concentration (Grogin et al., 2003).
If we accept that the explanation for the red X-ray sources is their high redshift, and not their AGN or dust properties, then we must explain why they make up such a large percentage of the faint, red objects. Any moderately red high-redshift galaxy would also produce these near-infrared colors. One answer is that X-ray sources are the brightest galaxies at high redshifts. Non-X-ray emitting galaxies would be expected to make up a larger percentage of red sources at fainter magnitudes, possibly explaining the red sources below H160=24.5 in Figure 4.
6.2 The Brightest Galaxies
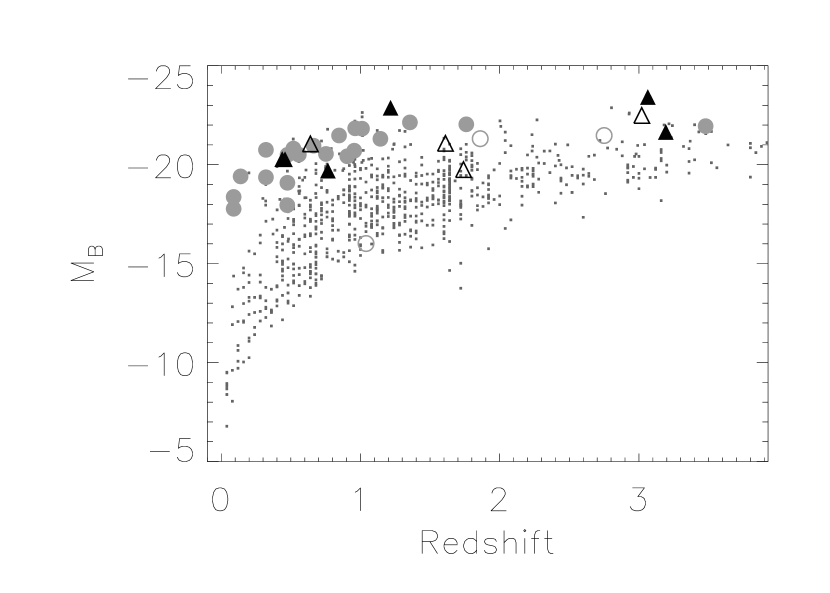
To examine the possibility that high redshift X-ray sources reside in bright galaxies further, we plot absolute B magnitude (0.45 m) versus redshift (Fernandez-Soto, Lanzetta & Yahil, 1999) in Figure 7. The absolute magnitudes were calculated by interpolating between flux densities measured in the filters before applying both a (1+) K-correction and the distance modulus. For redshifts placing the rest wavelength for B beyond the measured filters, we extrapolated from the last two filters. The possible =4.424 object (N220) was excluded altogether.
Figure 7 shows that the X-ray sources are not only the brightest objects at high redshift, but tend to be the brightest sources at all redshifts. This even though many of the sources have near-infrared flux dominated by starlight, not black hole accretion. At low redshift and low X-ray luminosity, where star formation is likely the dominant source of X-rays, bright near-infrared galaxies would be expected. But we also find X-ray sources in the brightest galaxies at moderate to high redshifts, where their large X-ray luminosities make them almost certainly AGN. A similar examination of absolute R-band (0.7 m) covers a lower redshift range (=0-2), but also identifies the X-ray sources as the brightest and, considering the longer wavelengths being observed, most massive galaxies. This is in agreement with (Barger et al., 2003b), who found large numbers of very luminous (M⋆) galaxies out to high redshifts among their X-ray detections, covering a much larger area than our sample, but to shallower near-infrared depths.
We should be careful applying our general conclusion that AGNs are found in massive galaxies to all individual X-ray sources. These faint X-ray sources are likely drawn from three separate groups. There are those powered mainly by star formation, only visible at low redshifts, with different ratios of X-ray to optical flux depending on strength of starburst and quantity of older stars. Then there are the unobscured, Type I AGN, which are bright at all wavelengths from X-ray through infrared, with the energy produced from black hole accretion generally dominating over star light, except, perhaps, in the near-infrared. Only three sources are confirmed broad-line AGN444N59,S242,S254, although we should keep in mind the small total numbers and likely large cosmic variance. The third likely group of X-ray sources are the Type II AGNs. The dust obscuring the central engines of these AGN can reprocess the bulk of optical radiation produced by the AGN into the infrared, possibly leaving only the optical light generated in stars. The lack of correlation between X-ray flux and near-infrared flux or concentration is consistent with obscured AGN making up a substantial fraction of X-ray sources.
We should also keep in mind the two faint NICMOS detections, which are almost certainly low stellar mass galaxies. Their moderate to blue colors indicate that they are not heavily dust-obscured or at extremely high (6) redshifts. Assuming their X-rays come from AGN, black hole accretion would be the source of the near-infrared light as well, leaving very little power for any star light. The overall spectral energy distribution of these two sources are consistent with that of a Seyfert nucleus (Edelson & Malkan, 1986). However, these low near-infrared flux galaxies are clearly the exception, rather than the rule.
7 Summary
We examine the near-infrared properties of 42 Chandra and NICMOS detected sources from the Hubble Deep Field North and the Ultra Deep Field. All of the Chandra sources were detected with NICMOS, with only two sources fainter than H160 = 24.5.
We confirm in the near-infrared the result of Grogin et al. (2003), that there is no significant difference between the asymmetries of X-ray sources and typical field galaxies. X-ray emitting galaxies have marginally greater near-infrared concentrations when compared to non-X-ray field galaxies, although the difference is smaller than that found by Grogin et al. (2003).
Roughly 40% of the faintest near-infrared Chandra sources (H160 21.5) are extremely red, with J110-H160 1.4. These red J110-H160 X-ray sources make up half of red J110-H160 objects down to H160 24.5, more than twice the rate found for optical/near-infrared EROs. Using available spectroscopic and photometric redshifts, we find all the red J110-H160 sources are at high redshift (=1.61-4.424), with X-ray luminosities indicative of AGN. Their red colors come from falling rest-frame ultraviolet flux shortward of the 4000Å break moving into the NICMOS filters at redshifts of 1.5. This explanation for their red color implies that the optical/near-infrared continuum is dominated by star light. Supporting evidence for this theory is that we find no correlation between near-infrared and X-ray flux or between X-ray hardness ratio and near-infrared color.
The X-ray sources in our study were found to be the optically brightest objects at all redshifts, indicating a strong preference of AGN for the optically most luminous galaxies. This trend holds at all optical magnitudes, including the longer rest-wavelengths, indicating that these X-ray detected AGN also reside in the most massive galaxies.
This work demonstrates that NICMOS can be a powerful tool for identifying high redshift AGN. The current conclusions depend on only six red J110-H160 X-ray detections, four of which come from the UDF. Future studies covering much larger areas are required to test and confirm these results. Because most X-ray sources are reasonably bright in the near-infrared, they should be observable in relatively shallow NICMOS surveys. The NICMOS Parallels Survey (McCarthy et al., 1999), for instance, covers hundreds of square arcminutes to the necessary depths. The deepest ground-based surveys (ex. VLT/ISAAC GOODS South, P.I. C. Cesarsky), should also be able to detect the majority of these red X-ray sources. Increasing the sample of red sources in well studied fields, such as the Chandra Deep Fields, will allow us to utilize the multi-observatory data now becoming available. For example, the ultradeep Spitzer Space Telescope mid-infrared imaging (Dickinson et al., 2004) will further constrain the contribution of dust obscuration and AGN emission. Such understanding will be crucial for interpretion and analysis of the large number of red galaxies being found in deep infrared surveys.
References
- Abraham et al. (1996) Abraham, R. G., Tanvir, N. R., Santiago, B. X., Ellis, R. S., Glazebrook, K.,& van den Bergh, S. 1996, MNRAS, 279, L47-L52
- Akiyama et al. (2000) Akiyama, M., Ohta, K., Yamada, T., Kashikawa, N., Yagi, M., Kawasaki, W., Sakano, M., Tsuru, T., Ueda, Y., Takahashi, T., Lehmann, I., Hasinger, G., & Voges, W. 2000, ApJ, 532, 700-727
- Alexander et al. (2003a) Alexander, D. M., Bauer, F. E., Brandt, W. N., Schneider, D. P., Hornschemeier, A. E., Vignali, C., Barger, A. J., Broos, P. S., Cowie, L. L., Garmire, G. P., Townsley, L. K., Bautz, M. W., Chartas, G., & Sargent, W. L. W. 2003a, AJ, 126, 539-574
- Alexander et al. (2003b) Alexander, D. M., Bauer, F. E., Brandt, W. N., Hornschemeier, A. E., Vignali, C., Garmire, G. P., Schneider, D. P., Chartas, G., & Gallagher, S. C. 2003b, AJ, 125, 383-397
- Alexander et al. (2002a) Alexander, D. M., Aussel, H., Bauer, F. E., Brandt, W. N., Hornschemeier, A. E., Vignali, C., Garmire, G. P., & Schneider, D. P. 2002a, ApJ, 568, L85-L88
- Alexander et al. (2002b) Alexander, D. M., Vignali, C., Bauer, F. E., Brandt, W. N., Hornschemeier, A. E., Garmire, G. P., & Schneider, D. P. 2002b, AJ, 123, 1149-1162
- Alexander et al. (2001) Alexander, D. M., Brandt, W. N., Hornschemeier, A. E., Garmire, G. P., Schneider, D. P., Bauer, F. E., & Griffiths, R. E. 2001, AJ, 122, 2156-2176
- Aussel et al. (1999) Aussel, H., Cesarsky, C. J., Elbaz, D., & Starck, J. L. 1999, A&A, 342, 313-336
- Barger et al. (2003a) Barger, A. J., Cowie, L. L., Capak, P., Alexander, D. M., Bauer, F. E., Brandt, W. N., Garmire, G. P., & Hornschemeier, A. E. 2003a, ApJ, 584, L61-L64
- Barger et al. (2003b) Barger, A. J.; Cowie, L. L.; Capak, P.; Alexander, D. M.; Bauer, F. E.; Fernandez, E.; Brandt, W. N.; Garmire, G. P.; Hornschemeier, A. E. 2003b, AJ, 126, 632-665
- Barger et al. (2001a) Barger, A. J., Cowie, L. L., Mushotzky, R. F., & Richards, E. A. 2001a, AJ, 121, 662-682
- Barger et al. (2001b) Barger, A. J., Cowie, L. L., Steffen, A. T., Hornschemeier, A. E., Brandt, W. N., & Garmire, G. P. 2001b, ApJ, 560, L23-L28
- Barger, Cowie, & Richards (2000) Barger, A. J., Cowie, L. L., & Richards, E. A. 2000, AJ, 119, 2092-2109
- Bauer et al. (2002a) Bauer, F. E., Alexander, D. M., Brandt, W. N., Hornschemeier, A. E., Vignali, C., Garmire, G. P., & Schneider, D. P. 2002a, AJ, 124, 2351-2363
- Bauer et al. (2002b) Bauer, F. E., Alexander, D. M., Brandt, W. N., Hornschemeier, A. E., Miyaji, T., Garmire, G. P., Schneider, D. P., Bautz, M. W., Chartas, G., Griffiths, R. E., & Sargent, W. L. W. 2002b, AJ, 123, 1163-1178
- Benitez (2000) Benitez, N. 2000, ApJ, 536, 571-583
- Bertin & Arnouts (1996) Bertin, E. & Arnouts, S. 1996, A&AS, 117, 393-404
- Brandt et al. (2001) Brandt, W. N., Hornschemeier, A. E., Alexander, D. M., Garmire, G. P., Schneider, D. P., Broos, P. S., Townsley, L. K., Bautz, M. W., Feigelson, E. D., & Griffiths, R. E. 2001, AJ, 122, 1-20
- Campana et al. (2001) Campana, S., Moretti, A., Lazzati, D. & Tagliaferri, G. 2001, ApJ, 560, L19-L22
- Capak et al. (2004) Capak, P., Cowie, L. L., Hu, E. M., Barger, A. J., Dickinson, M., Fernandez, E., Giavalisco, M., Komiyama, Y., Kretchmer, C., McNally, C., Miyazaki, S., Okamura, S., & Stern, D. 2004, AJ, 127, 180-198
- Cohen et al. (1999) Cohen, J. G., Hogg, D. W., Blandford, R., Cowie, L. L., Hu, E., Songaila, A., Shopbell, P., & Richberg, K. 1999, ApJ, 538, 29-52
- Conselice et al. (2004) Conselice, C. J., Blackburne, J. A., & Papovich, C. 2004, ApJ, accepted
- Conselice et al. (2003) Conselice, C. J., Bershady, M. A., Dickinson, M., & Papovich, C. 2003, AJ, 126, 1183-1207
- Conselice (2003) Conselice, C. J. 2003, ApJS, 147, 1-28
- Conselice et al. (2000) Conselice, C. J., Bershady, M. A., & Jangren, A. 2000, ApJ, 529, 886-910
- Cowie et al. (2002) Cowie, L. L., Garmire, G. P., Bautz, M. W., Barger, A. J., Brandt, W. N., & Hornschemeier, A. E.2002, ApJ, 566, L5-L8
- Cowie et al. (2001) Cowie, L. L., Barger, A. J., Bautz, M. W., Capak, P., Crawford, C. S., Fabian, A. C., Hu, E. M., Iwamuro, F., Kneib, J.-P., Maihara, T., & Motohara, K. 2001, ApJ, 551, L9-L12
- Crawford et al. (2001) Crawford, C. S., Fabian, A. C., Gandhi, P., Wilman, R. J., & Johnstone, R. M. 2001, MNRAS, 324, 427-442
- Cristiani et al. (2004) Cristiani, S., Alexander, D. M., Bauer, F., Brandt, W. N., Chatzichristou, E. T., Fontanot, F., Grazian, A., Koekemoer, A., Lucas, R. A., Monaco, P., Nonino, M., Padovani, P., Stern, D., Tozzi, P., Treister, E., Urry, C. M., & Vanzella, E. 2004, ApJ, 600, L119-L122
- Dickinson et al. (2004) Dickinson, M., et al.2004, BAAS, 204, 33.13
- Dickinson et al. (2000) Dickinson, M., Hanley, C., Elston, R., Eisenhardt, P. R., Stanford, S. A., Adelberger, K. L., Shapley, A., Steidel, C. C., Papovich, C., Szalay, A. S., Bershady, M. A., Conselice, C. J., Ferguson, H. C., & Fruchter, A. S. 2000, ApJ, 531, 624-634
- Edelson & Malkan (1986) Edelson, R. A., & Malkan, M. A. 1986, ApJ, 308, 59-77
- Fabbiano (1989) Fabbiano, G. 1989, ARA&A, 27, 87-138
- Fadda et al. (2002) Fadda, D., Flores, H., Hasinger, G., Franceschini, A., Altieri, B., Cesarsky, C. J., Elbaz, D., & Ferrando, P. 2002, A&A, 383, p.838-853
- Fernandez-Soto, Lanzetta & Yahil (1999) Fernandez-Soto, A., Lanzetta, K. M. & Yahil, A. 1999, ApJ, 513, 34
- Fruchter & Hook (1997) Fruchter, A. & Hook, R. N. 1997, Proc. SPIE, 3164, 120-125
- Giavalisco et al. (2004) Giavalisco, M. et al.2004, ApJ, 600, L93-L98
- Griffiths et al. (2000) Griffiths, R. E., Ptak, A., Feigelson, E. D., Garmire, G., Townsley, L., Brandt, W. N., Sambruna, R., & Bregman, J. N. 2000, Science, 290, 1325-1328
- Grogin et al. (2003) Grogin, N. A., Koekemoer, A. M., Schreier, E. J., Bergeron, J., Giacconi, R., Hasinger, G., Kewley, L., Norman, C., Rosati, P., Tozzi, P., & Zirm, A. 2003, ApJ, 595, 685-697
- Hornschemeier et al. (2003) Hornschemeier, A. E., Bauer, F. E., Alexander, D. M., Brandt, W. N., Sargent, W. L. W., Bautz, M. W., Conselice, C., Garmire, G. P., Schneider, D. P., & Wilson, G. 2003, AJ, 126, 575-595
- Hornschemeier et al. (2002) Hornschemeier, A. E., Brandt, W. N., Alexander, D. M., Bauer, F. E., Garmire, G. P., Schneider, D. P., Bautz, M. W., & Chartas, G. 2002, ApJ, 568, 82-87
- Hornschemeier et al. (2001) Hornschemeier, A. E., Brandt, W. N., Garmire, G. P., Schneider, D. P., Barger, A. J., Broos, P. S., Cowie, L. L., Townsley, L. K., Bautz, M. W., Burrows, D. N., Chartas, G., Feigelson, E. D., Griffiths, R. E., Lumb, D., Nousek, J. A., Ramsey, L. W., & Sargent, W. L. W. 2001, AJ, 554, 742-777.
- Hornschemeier et al. (2000) Hornschemeier, A. E., Brandt, W. N., Garmire, G. P., Schneider, D. P., Broos, P. S., Townsley, L. K., Bautz, M. W., Burrows, D. N., Chartas, G., Feigelson, E. D., Griffiths, R., Lumb, D., Nousek, J. A., & Sargent, W. L. W. 2000, ApJ, 541, 49-53
- Koekemoer et al. (2004) Koekemoer, A. M., Alexander, D. M., Bauer, F. E., Bergeron, J., Brandt, W. N., Chatzichristou, E., Cristiani, S., Fall, S. M., Grogin, N. A., Livio, M., Mainieri, V., Moustakas, L. A., Padovani, P., Rosati, P., Schreier, E. J., & Urry, C. M. 2004, ApJ, 600, L123-L126
- Koekemoer et al. (2002) Koekemoer, A. M., Grogin, N. A., Schreier, E. J., Giacconi, R., Gilli, R., Kewley, L., Norman, C., Zirm, A., Bergeron, J., Rosati, P., Hasinger, G., Tozzi, P., & Marconi, A. 2002, ApJ, 567, 657-671
- Kotilainen et al. (1992) Kotilainen, J. K., Ward, M. J., Boisson, C., Depoy, D. L., & Smith, M. G. 1992, MNRAS, 256, 149-165
- Kron (1980) Kron, R.G. 1980, ApJS, 43, 305
- Labbe et al. (2003) Labb , I., Franx, M., Rudnick, G., Schreiber, N. M. F., Rix, H-W., Moorwood, A., van Dokkum, P. G., van der Werf, P., R ttgering, H., van Starkenburg, L., van de Wel, A., Kuijken, K., & Daddi, E. 2003, AJ, 125, 1107-1123
- Lehmann et al. (2001) Lehmann, I., Hasinger, G., Schmidt, M., Giacconi, R., Trumper, J., Zamorani, G., Gunn, J. E., Pozzetti, L., Schneider, D. P., Stanke, T., Szokoly, G., Thompson, D., & Wilson, G. 2001, A&A, 371, 833-857
- Lowenthal et al. (1997) Lowenthal, J., Koo, D. C., Guzman, R. et al.1997, ApJ, 481, 673.
- Marble et al. (2003) Marble, A. R., Hines, D. C., Schmidt, G. D., Smith, P. S., Surace, J. A., Armus, L., Cutri, R. M., Nelson, B. O. 2003, ApJ, 590, 707-729
- McCarthy et al. (1999) McCarthy, P. J., Yan, L., Freudling, W., Teplitz, H. I., Malumuth, E. M., Weymann, R. J., Malkan, M. A.,Fosbury, R. A. E., Gardner, J. P., Storrie-Lombardi, L. J., Thompson, R. I., Williams, R. E., & Heap, S. R. 1999, ApJ, 520, 548-563
- Moran, Lehnert, & Helfand (1999) Moran, E. C., Lehnert, M. D., Helfand, D. J. 1999, ApJ, 526, 649-664
- Mushotzky et al. (2000) Mushotzky, R. F., Cowie, L. L., Barger, A. J., & Arnaud, K. A. 2000, Nature, 404, 459-464
- Richards, E. A. et al. (1998) Richards, E. A., Kellermann, K. I., Fomalont, E. B., Windhorst, R. A., & Partridge, R. B. 1998, AJ, 116, 1039-1054
- Roche et al. (2003) Roche, N.D., Dunlop, J., & Almaini, O. 2003, MNRAS, 346, 803-817
- Rosati et al. (2002) Rosati, P., Tozzi, P., Giacconi, R., Gilli, R., Hasinger, G., Kewley, L., Mainieri, V., Nonino, M., Norman, C., Szokoly, G., Wang, J. X., Zirm, A., Bergeron, J., Borgani, S., Gilmozzi, R., Grogin, N., Koekemoer, A., Schreier, E., & Zheng, W. 2002, ApJ, 566, 667-674
- Saracco et al. (2001) Saracco, P., Giallongo, E., Cristiani, S., D’Odorico, S., Fontana, A., Iovino, A., Poli, F., & Vanzella, E. 2001, A&A, 375, 1-13
- Schreier et al. (2001) Schreier, E. J., Koekemoer, A. M., Grogin, N. A., Giacconi, R., Gilli, R., Kewley, L., Norman, C., Hasinger, G., Rosati, P., Marconi, A., Salvati, M., & Tozzi, P. 2001, ApJ, 560, 127-138
- Szokoly et al. (2004) Szokoly, G. P., Bergeron, J., Hasinger, G., Lehmann, I., Kewley, L., Mainieri, V., Nonino, M., Rosati, P., Giacconi, R., Gilli, R., Gilmozzi, R., Norman, C., Romaniello, M., Schreier, E.,. Tozzi, P., Wang, J. X., Zheng, W., & Zirm, A. 2004, ApJS, submitted
- Thompson et al. (1998) Thompson, R. I., Rieke, M., Schneider, G., Hines, D. C., & Corbin, M. R. 1998, ApJ, 492, L95
- Vignali et al. (2002) Vignali, C., Bauer, F. E., Alexander, D. M., Brandt, W. N., Hornschemeier, A. E., Schneider, D. P., & Garmire, G. P. 2002, ApJ, 580, L105-L109
- Waddington et al. (1999) Waddington, I., Windhorst, R. A., Cohen, S. H., Partridge, R. B., Spinrad, H., & Stern, D. 1999, ApJ, 526, L77-L80
- Wilkes et al. (2002) Wilkes, B. J., Schmidt, G. D., Cutri, R. M., Ghosh, H., Hines, D. C., Nelson, B., & Smith, P. S. 2002, ApJ, 564, L65-L68
- Wolf et al. (2004) Wolf, C. et al., 2004, A&A, submitted
- Yan et al. (2003) Yan, H.,, Windhorst, R. A., Rottgering, H. J. A., Cohen, S. H., Odewahn, S. C., Chapman, S. C., & Keel, W. C. 2003, ApJ, 585, 67-72


| Obj. | RA | Dec | H160 | J110 | I775 | C | A | FXaa10-16 ergs s-1 cm-2. | HR | |
|---|---|---|---|---|---|---|---|---|---|---|
| ID# | (J2000) | (J2000) | Mag | Mag | Mag | 0.5-8 keV | ||||
| N50 | 12:35:56.32 | 62:08:03.2 | 21.55 | n/a | 23.41 | 1.15 | 2.840.19 | 0.1530.002 | 3.83 | -0.07 |
| N59 | 12:36:0.41 | 62:19:25.2 | 23.16 | n/a | 23.51 | 3.19 | 2.570.25 | 0.0830.007 | 4.47 | -0.32 |
| N69 | 12:36:5.35 | 62:19:32.8 | 19.76 | n/a | 20.80 | 0.520 | 2.690.16 | 0.0950.001 | 1.21 | -0.01 |
| N203 | 12:36:38.93 | 62:12:57.3 | 20.49 | 21.28 | 22.66 | 1.143 | 2.560.10 | 0.1480.007 | 0.254 | 0.03 |
| N207 | 12:36:39.57 | 62:12:30.4 | 24.21 | 25.0 | 25.46 | 3.479 | n/a | n/a | 3.79 | -0.58 |
| N211 | 12:36:39.92 | 62:12:49.9 | 20.22 | 20.73 | 21.57 | 0.846 | 2.940.15 | 0.0960.016 | 0.641 | -0.29 |
| N218 | 12:36:41.81 | 62:11:32.1 | 19.63 | 19.80 | 19.99 | 0.089 | 2.910.10 | 0.1990.005 | 1.02 | -0.47 |
| N220 | 12:36:42.11 | 62:13:31.6 | 23.38 | 24.82 | 26.33 | 4.424 | 2.770.18 | 0.0510.039 | 0.803 | -0.29 |
| N227 | 12:36:44.0 | 62:12:50.1 | 19.98 | 20.61 | 21.29 | 0.557 | 2.690.12 | 0.1350.004 | 0.353 | -0.09 |
| N228 | 12:36:44.12 | 62:12:44.5 | 21.59 | 22.60 | 24.96 | 1.76 | 3.210.16 | 0.0850.016 | 0.238 | 0.19 |
| N230 | 12:36:44.4 | 62:11:33.3 | 19.33 | 20.02 | 21.75 | 1.01 | 3.770.13 | 0.1070.009 | 0.774 | -0.33 |
| N231 | 12:36:44.94 | 62:11:45.3 | 27.0 | 27.0 | 27.6bbData point is for F814w filter. | 1.04ccPhotometric redshift is used. | n/a | n/a | 0.623 | -0.20 |
| N240 | 12:36:46.33 | 62:14:04.7 | 19.89 | 20.31 | 21.58 | 0.961 | 3.570.13 | 0.1310.010 | 32.6 | 0.08 |
| N245 | 12:36:47.04 | 62:12:38.2 | 20.61 | 20.82 | 21.18 | 0.321 | 3.230.14 | 0.0950.013 | 0.238 | 0.01 |
| N249 | 12:36:48.07 | 62:13:09.0 | 19.44 | 19.99 | 20.74 | 0.475 | 3.700.18 | 0.1650.011 | 2.37 | -0.40 |
| N251 | 12:36:48.37 | 62:14:26.4 | 18.68 | 18.92 | 19.22 | 0.139 | 2.990.12 | 0.1710.003 | 0.75 | -0.40 |
| N257 | 12:36:49.45 | 62:13:47.1 | 17.49 | 17.79 | 18.40 | 0.089 | 3.140.14 | 0.1210.002 | 0.422 | -0.10 |
| N258 | 12:36:49.51 | 62:14:06.9 | 20.78 | 21.36 | 22.20 | 0.752 | 2.780.19 | 0.0960.005 | 0.353 | -0.08 |
| N260 | 12:36:49.71 | 62:13:13.2 | 20.38 | 21.14 | 22.00 | 0.475 | 3.090.13 | 0.1210.006 | 0.611 | -0.39 |
| N261 | 12:36:50.17 | 62:12:16.6 | 20.96 | 21.67 | 22.81 | 0.902 | 2.970.16 | 0.1580.019 | 0.202 | 0.48 |
| N267 | 12:36:51.73 | 62:12:21.4 | 24.01 | 25.8 | 26.03 | 2.75ccPhotometric redshift is used. | n/a | n/a | 3.4 | 0.14 |
| N272 | 12:36:52.76 | 62:13:54.1 | 21.51 | 21.76 | 22.16 | 1.355 | 2.710.13 | 0.6370.015 | 0.334 | -0.03 |
| N274 | 12:36:52.89 | 62:14:44.1 | 18.15 | 18.64 | 19.33 | 0.321 | 3.490.12 | 0.1410.005 | 2.44 | -0.62 |
| N286 | 12:36:55.45 | 62:13:11.2 | 20.43 | 21.09 | 22.70 | 0.955 | 3.100.17 | 0.1150.010 | 4.08 | -0.40 |
| N287 | 12:36:55.79 | 62:12:00.9 | 22.57 | 23.5 | 24.61 | n/a | 3.050.16 | 0.5170.049 | 1.26 | -0.36 |
| N291 | 12:36:56.62 | 62:12:45.7 | 18.91 | 19.54 | 20.49 | 0.517 | 3.580.08 | 0.0860.005 | 0.378 | 0.03 |
| N294 | 12:36:56.92 | 62:13:01.6 | 21.05 | 21.72 | 23.28 | 0.474 | 3.440.16 | 0.1280.014 | 3.14 | -0.50 |
| N296 | 12:36:57.47 | 62:12:10.5 | 19.74 | 20.36 | 21.33 | 0.663 | 3.000.16 | 0.1780.012 | 0.683 | -0.05 |
| N353 | 12:37:8.33 | 62:10:55.9 | 19.89 | n/a | 20.28 | 0.422 | 1.0640.13 | 0.1410.249 | 0.984 | -0.34 |
| N460 | 12:37:42.65 | 62:07:51.7 | 20.83 | n/a | 21.76 | 1.08 | 2.650.15 | 0.2140.006 | 2.31 | -0.01 |
| N463 | 12:37:45.02 | 62:07:18.9 | 24.35 | n/a | 27.4 | 2.50ccPhotometric redshift is used. | n/a | n/a | 29.4 | -0.32 |
| S226 | 3:32:36.69 | -27:46:30.8 | 21.61 | 22.21 | 23.09 | 0.766 | 2.960.16 | 0.2190.005 | 1.18 | -0.18 |
| S233 | 3:32:38.03 | -27:46:26.2 | 23.56 | 24.86 | 26.89 | 1.74ccPhotometric redshift is used. | 2.660.21 | 0.1230.013 | 8.76 | -0.45 |
| S236 | 3:32:38.78 | -27:47:32.3 | 20.43 | 20.88 | 21.20 | 0.458 | 2.490.19 | 0.1960.001 | 0.784 | -0.13 |
| S242 | 3:32:39.08 | -27:46:01.7 | 20.44 | 20.91 | 20.86 | 1.216 | 2.880.20 | 0.1620.001 | 8.06 | -0.18 |
| S243 | 3:32:39.17 | -27:48:32.7 | 23.35 | 25.36 | 26.34 | 3.02ccPhotometric redshift is used. | 2.510.24 | 0.2190.008 | 0.355 | 0.44 |
| S245 | 3:32:39.68 | -27:48:50.7 | 22.45 | 24.06 | 24.77 | 3.064 | 2.470.19 | 0.1630.004 | 7.48 | 0.18 |
| S246 | 3:32:39.73 | -27:46:11.2 | 21.86 | 23.32 | 25.25 | 1.61ccPhotometric redshift is used. | 2.960.13 | 0.1370.009 | 8.42 | -0.24 |
| S248 | 3:32:41.5 | -27:47:17.3 | 19.73 | 20.40 | 21.17 | 0.64ccPhotometric redshift is used. | 3.110.15 | 0.1460.001 | 0.348 | 0.24 |
| S254 | 3:32:42.84 | -27:47:02.4 | 24.12 | 24.45 | 24.63 | 3.193 | 2.380.23 | 0.1560.016 | 6.31 | -0.33 |
| S259 | 3:32:44.06 | -27:54:54.1 | 25.3 | 25.8 | 26.99 | 0.908 | n/a | n/a | 2.4 | -0.21 |
| S266 | 3:32:45.14 | -27:47:24.0 | 19.70 | 20.34 | 20.90 | 0.438 | 2.820.19 | 0.1330.001 | 0.913 | -0.21 |