Are Supernova Kicks Responsible for X-ray Binary Ejection from Young Clusters?
Abstract
Recent Chandra observations of interacting and starburst galaxies have led us to investigate the apparent correlation between the positions of young star clusters and Chandra point sources. Assumed to be X-ray binaries (XRBs), these point sources do not seem to coincide with the massive (105 M☉), young ( Myr) stellar clusters that can easily form systems capable of such emission. We use a sophisticated binary evolution and population synthesis code (StarTrack) and a simplified cluster model to track both the X-ray luminosity and position of XRBs as a function of time. These binaries are born within the cluster potential with self-consistent positions and velocities and we show that a large fraction (70%) can be ejected from the parent due to supernova explosions and associated systemic velocities. For brighter sources and cluster masses below 106 M☉, we find that the average number of bright XRBs per cluster remains near or below unity, consistent with current observations.
Subject headings:
galaxies: star clusters – methods: statistical – X-rays: binaries1. Introduction
One of the interesting developments made possible with Chandra observations is the abundance of extragalactic point sources. The large observed samples now available promise to improve our understanding of their formation and interaction with their host stellar environments. In galaxies with young stellar populations, it is generally thought that bright point X-ray sources are young X-ray Binaries (XRBs) (Kilgard et al., 2002; Fabbiano et al., 2001; Fabbiano & White, 2005), associated with the large amount of ongoing star formation. This interpretation is mainly based on the measured X-ray luminosity and the spectral and temporal variability characteristics of the point sources. For a detailed review of the formation and evolution of XRBs see Lewin & van der Klis (2005), and for a recent discussion of the temporal properties see Sipior, Eracleous, & Sigurdsson (2003). Optical and infrared observations, most prominently with the Hubble Space Telescope, reveal massive, young clusters, often referred to as super star clusters. They range in mass from 104 M☉ to 107 M☉ (Smith & Gallagher, 2001; Harris et al., 2001), and in age from just 1 Myr to 50 Myr, with the majority at Myr (mostly due to photometric selection). These clusters are thought to be young analogs of globular clusters and may be responsible for most of the massive stars in the field of their host galaxies (Tremonti et al., 2001). Thus, one may expect a concetration of XRBs in or near these clusters.
Recently, Kaaret et al. (2004); hereafter K04 have studied 3 starburst galaxies (M82, NGC1569, and NGC5253) each containing a significant number of young star clusters and point X-ray sources. Indeed, they do find a statistically significant relationship between the two types of objects: XRBs are preferentially found within distances of 30100 pc from their nearest cluster, but there is a clear lack of XRBs found coincident with the clusters. There are obvious observational biases, the most important being that the true parent cluster is unknown; the distances quoted are only those to the nearest cluster, not necessarily the parent cluster. Still, the XRB spatial distribution relative to the clusters and their association seems significant and characteristic of a non-random sample distribution (see § 3 of K04 for the relevant statistical analysis). It is worth noting that similar results have been found in observations of the Antennae (Zezas et al., 2002).
In this Letter, our goal is to model in a self-consistent manner the population of binaries in the cluster potential (assumed static for simplicity). We track the kinematic evolution of compact object binaries in the absence of dynamical interactions and we follow their X-ray luminosity () evolution. We focus on two specific, testable points of comparison between the published observations and our calculations: the average number of XRBs per cluster, and the median distance of XRBs from their parent cluster (or nearest cluster in the observations). For point sources brighter than 1036 erg s-1, K04 have shown that the median distance from a cluster is 100 pc, with an average of 1 XRB per cluster (See Table 1 in K04 for the specifics regarding each of the three galaxies considered). Here we show that these two quantities can be calculated theoretically and the results appear consistent with the observations for the range of cluster masses and ages relevant to the clusters observed, when considering only the supernova kicks imparted to XRBs and their motion in cluster potentials. Guided by the sensitivity limits of the observations, we focus our analysis on XRBs with 51035 ergs s-1, although the formation and evolution of XRBs to lower ranges is included in our models.
In § 2 we describe the model methods used and how they are applied in our simulations. In § 3 we describe our main results and compare them to the observations presented by K04. We discuss our conclusions in § 4.
2. Theoretical Modeling
To generate the necessary stellar populations for the modeled clusters, we use the population synthesis program StarTrack (developed by Belczynski et al. (2002); Belczynski et al. 2004, to be submitted). We generate and evolve a population of binaries under a given set of conditions, such as the initial mass function (IMF), supernova kick distribution, common envelope efficiency, etc. With the resultant evolutionary parameters of the binaries at the time of the compact-object (neutron star or black hole) formation, we place them in a cluster potential and track their motion and X-ray luminosity as a function of time. In so doing, we ultimately generate a complete evolutionary picture of the X-ray binaries in association with their parent cluster. As noted already, we do not account for any stellar interactions in these young clusters, as our goal is to examine whether supernova kicks alone can account for the observed spatial distribution of XRBs relative to their parent clusters.
StarTrack is a sophisticated Monte Carlo population synthesis code that has been recently updated to carefully account for binary mass-transfer phases and calculation. We account for various phases of mass and angular momentum losses, and have implemented an integrated tidal evolution method that is calibrated against observations of Galactic high-mass XRBs and of circularization in open clusters. Some key features for this investigation include: (i) the determination of the post-core-collapse systemic velocity for compact object binaries, and (ii) the detailed calculation of the mass transfer rate between binary components, calibrated against calculations with a stellar evolution code. Systemic velocities are a key to the proper determination of the orbital trajectory, which is one of the primary concerns for this work. Also, given the sensitivity of the observations to , the mass transfer rate becomes a critical factor in determining whether or not a given XRB is relevant to the K04 observations at any point in its lifetime. For the determination we further apply a bolometric correction to the theoretical value, to account for Chandra’s sensitivity band and the typical XRB spectra. This bolometric correction is dependent on the system parameters (neutron star or black hole accretor, wind accretion or Roche-lobe overflow) and assumptions about the typical spectra of different sources, derived empirically from Galactic observations (Maccarone 2003, private communication; Portegies Zwart, Dewi, & Maccarone (2004)). Specifically for wind accretors we adopt 0.15 and 0.7, for disk persistent sources and transient sources at outburst we adopt 0.5 and 0.7 (for neutron stars and black holes, respectively).
It is well known that population synthesis calculations require a significant number of input parameters. Since our main goal in this Letter is a proof-of-principle study, it is not necessary to fully explore the parameter space. Instead we choose to consider a reference model with parameter assumptions that are considered typical for binary evolution calculations (see model A in Belczynski et al. (2002)). We also consider a small set of other models where we vary the initial mass function of binary primaries, as this most significantly affects the relative contribution of XRBs with neutron stars and black holes that acquire systematically different systemic velocities.
The systemic velocities are determined by the natal kicks imparted during the formation of the compact object. Neutron star natal kick magnitudes are drawn from the distribution derived from Arzoumanian, Chernoff, & Cordes (2002), based on current pulsar kinematics. It consists of two Maxwellians with ’s 90 and 500, with a relative weight of 2:3, respectively. Black hole natal kicks are linearlly scaled from Neutron star kicks based on their mass relative to a typical Neutron star mass of 1.44 M☉.
For the orbital evolution we use the calculated post-core-collapse systemic velocities of XRB progenitors and combine them consistently with a Plummer model for the gravitational potential of the model cluster with a given half-mass radius, . To determine the spatial distribution of the XRB progenitors right after compact-object formation (which generally occurs immediately prior to the X-ray phase), we assume that the number density of stars is proportional to the mass density. Initial systemic velocities consistent with the Plummer potential are also generated (see Aarseth et al. (1974)). We then apply the calculated post-core-collapse systemic velocities randomly oriented with respect to the initial cluster velocities. We follow the motion of the binary as a function of time and correlate position with the X-ray luminosity evolution calculated with the binary evolution code.
The number of binaries modeled for a given cluster is directly proportional to the mass of that cluster once the IMF index, mass-ratio-distribution paramters, and binary fraction are chosen. We adopt a flat mass-ratio distribution and a binary fraction equal to unity in order to represent an upper limit on the number of binaries, and therefore on the total number of X-ray sources. We consider cluster masses in the range M M☉, with IMF indices of 2.35 and 2.7. The specific parameters of our simulations are shown in Table 1.
| Model | # of | Mass | IMF | R1/2 |
|---|---|---|---|---|
| MC runs | (M☉) | index | (pc) | |
| A | 1000 | 5104 | 2.35 | 10 |
| B | 1000 | 5104 | 2.7 | 10 |
| C | 100 | 5105 | 2.35 | 10 |
| D | 100 | 5105 | 2.7 | 10 |
| E | 7 | 5106 | 2.35 | 10 |
| J | 500 | 5104 | 2.35 | 1 |
It is interesting to note that although orbits are calculated typically for few to several hundred Myr, binaries are X-ray sources for only a small part of their orbit and they are bright (i.e., Lx 51035 erg s-1) X-ray sources for an even smaller part. Each system is evolved individually in a static cluster potential, and thus no interactions or cluster evolution is allowed in the present analysis since our goal is to examine the effect of the supernova kicks. This may not be a well justified assumption in general. Nevertheless, the clusters relevant to our study are very young (few Myrs to Myr), so significant cluster evolution is not expected, except for possibly in the most massive and most compact (small half-mass radius) clusters.
We note that statistical effects play a significant role, especially in the low mass (104M☉) clusters. Typically, no more than one XRB is bright enough to be seen in these clusters and the position can vary significantly across the cluster for each different simulation. Therefore, we consider a large number of Monte Carlo realizations for each parameter set (cluster mass, half-mass radius, and IMF index). The lower mass clusters have the smallest number of initial binaries and hence require the most realizations. We chose the number of realizations for each cluster mass so that our results averaged over the many realizations remained unaffected at the 5% level.
3. Results & Discussion
Our calculations have yielded a wealth of results. Knowing both the trajectory and X-ray luminosity of such a wide range of objects can help us understand XRB formation in young clusters both statistically and in a system-by-system sense. Here, we focus on the statistical results where the clusters are investigated as a grand average; this is more appropriate when comparing with large populations of clusters (as analyzed in K04). Specifically, we focus on the statistical averages of the two quantites quoted observationally in K04: the median distance of XRBs from the nearest (parent in the models) cluster, and the mean number of bright XRBs per cluster (within 1000 pc).
In Figure 1 (top) we plot the model average number of XRBs per cluster as a function of distance from the parent clusters, each of 5104 M☉ and for a variety of cluster ages. These ages are within the range of estimates for the observed clusters. To take into account the uncertainties in the age estimates (typically a few Myr), we use an age-snapshot method, based on which we determine the average number of XBRs as a function of radius for a specific “instant” in time, and then average these results over each consecutive “instant” within the cluster age estimate and its error.
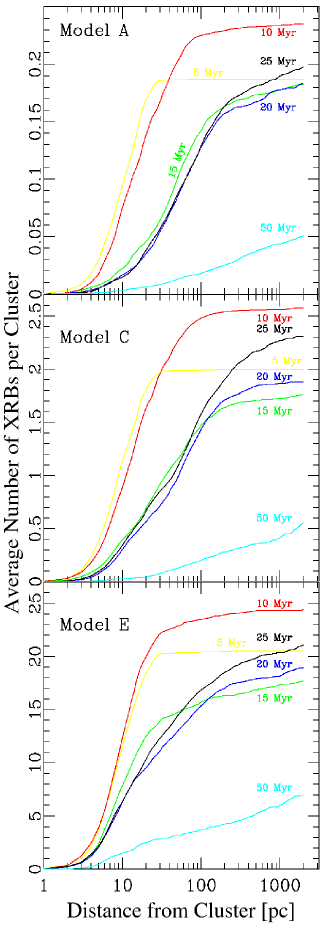
It is evident from Figure 1 that the XRB spatial distributions have a dramatic time dependence. For “young” clusters, the average XRB number per cluster rises to a maximum rapidly and very few XRBs are found at large distances. This is primarily because even the unbound XRBs have not had enough time to move away from their parent clusters. The median systemic velocity of the XRB systems is 23 pc Myr-1, which limits the distance any XRB can reach. For older clusters, the average XRB number exhibits a fairly slow increase with distance, up to 2 kpc and sometimes beyond. This can potentially create a pollution effect and lead to difficulty in identifying the true parent cluster in observations.
It is also evident that at certain ages XRBs are distinctly more numerous than at others. For example, in Figure 1, the 5104 M☉ (top) clusters with 51035 erg s-1 show more XRBs at 10 Myr than at any other time in the clusters’ evolution. We also find that this peak age is dependent on the cut-off. Fully exploring these dependencies could allow us to derive general conclusions about XRB populations dependent only on the average ages of the young cluster population.
In Figure 1 (middle and bottom) we present our results for clusters of 5105 and 5106 M☉, respectively. Note that the behavior is similar for all masses, except that the average number of XRBs at a given radius scales with the mass of the cluster almost lineraly. This is due to the direct relationship between the number of binary systems modeled and the cluster mass.
| 5 Myr | 10 Myr | 15 Myr | 20 Myr | 25 Myr | 50 Myr | |||||||
|---|---|---|---|---|---|---|---|---|---|---|---|---|
| Model | Rmedian | Rmedian | Rmedian | Rmedian | Rmedian | Rmedian | ||||||
| (pc) | (pc) | (pc) | (pc) | (pc) | (pc) | |||||||
| A | 0.19 | 10.5 | 0.23 | 17.5 | 0.18 | 44.5 | 0.18 | 54.5 | 0.19 | 58.5 | 0.04 | 146.5 |
| B | 0.14 | 10.5 | 0.18 | 17.5 | 0.12 | 46.5 | 0.12 | 67.5 | 0.16 | 76.5 | 0.04 | 104.5 |
| C | 2.00 | 9.5 | 2.55 | 15.5 | 1.72 | 27.5 | 1.87 | 46.5 | 2.26 | 51.5 | 0.41 | 80.5 |
| E | 20.5 | 16.5 | 24.3 | 17.5 | 17.3 | 18.5 | 18.1 | 24.5 | 20.4 | 26.5 | 6.00 | 29.5 |
| J | 0.18 | 1.5 | 0.25 | 2.5 | 0.18 | 13.5 | 0.16 | 31.5 | 0.21 | 40.5 | 0.04 | 54.5 |
We calculate the median distance and mean number of XRBs with 51035 erg s-1 within 1000 pc (Table 2), in order to compare appropriately with K04.
Mean number of XRBs per cluster: We find the theoretical mean XRB number per cluster to vary significantly from to , depending on the cluster mass. Therefore, it is possible to reproduce the results in K04 by taking contributions from a number of clusters of different masses. Two of the three galaxies discussed in K04 (M82 and NGC 5253) have a mean number of observed XRBs of per cluster, while NGC 1569 seems to have a very small number of XRBs (only per cluster). This difference would point towards NGC 1569 having, on average, smaller-mass clusters, even though outliers at high masses can still exist. A difficulty in the comparison arises because the properties of the clusters in these galaxies are difficult to determine orbservationally. Those with measured masses are skewed to higher masses (1105 M☉) and younger ages (15 Myr) simply because they are selected photometrically (Gallagher 2004, private communication). Therefore, developing a proper theoretical cluster distribution for comparison is rather challenging without further observational studies of the cluster populations.
Median distance of XRBs from the cluster: Our results (Table 2) indicate a strong dependence of the median XRB distance on the age and a moderate dependence on the cluster mass. For clusters with a half-mass radius of pc and masses M☉, median distances reach values of pc (similar to those observed) at ages of Myr and older. Only very massive clusters of M☉ reach such distances later at Myr. These ages and moderate masses are consistent with the current observational estimates, although massive and older clusters are also present in the photometrically selected clusters in K04 (Gallagher 2004, private communication).
It should also be noted that, for the highest cluster mass we consider (5106 M☉), even the oldest clusters seem to show more binaries than what is observed. This clearly implies that starbursts are not dominated by such massive clusters, and this is not surprising. However, these more massive clusters may also be affected by dynamical cluster evolution and stellar interactions leading more binary disruptions and ejections. Thus we would expect the average number of XRBs per cluster to decrease at all ages and distances.
It should be noted that we have assumed a binary fraction of unity, and therefore the mean XRB numbers could be overestimated. This is true also because projection effects have not been taken into account, and our numbers represent the radial distance the XRBs have traveled. Also, we note that changes in the power law IMF index of the cluster produce noticeable, but largely insignificant changes in the cluster profiles. For example, changing the IMF index from 2.35 to 2.7 decreases the average number of binaries at or about the 10% level for each timestep. This effect may become more important, especially for very steep IMFs, such as those for clusters proposed by Kroupa & Weidner (2003) where the index can go as high as 3.2. And last, changes in the half-mass radius of the cluster dramatically change the median XRB distance for a given mass. Very small values (model J in Table 2) tend to limit XRBs ejection, as the potential is deeper. In these tight clusters, it is likely that dynamics will play a non-negligible role, depending on their age.
4. Conclusions
With detailed population simulations of XRBs and a simple treatment of gravitational potentials of young clusters we have shown that the significantly low XRB numbers per cluster observed in starbursts can be explained as being largely due to supernova kicks imparted to XRBs at compact-object formation that lead to XRB ejection from the cluster potential, as heuristically suggested by observational studies (K04; Portegies Zwart, Dewi, & Maccarone (2004)). Derived XRB median distances are also consistent with current estimates of cluster masses and ages, although a more direct comparison requires more detailed observational constraints of the cluster properties.
This work opens many possible avenues in which to continue this study, some of which include an in depth look into the systematics generated by our stellar evolution code, such as how our results change with a broader range of masses and IMFs, as well as additional stellar evolution parameters such as the common envelope efficiency. We also intend to look at the detailed populations created, and search for specific correlations between types of XRBs, their ages, and positions in the clusters. Still further, we have largely ignored the low luminosty XRBs in this analysis. This population may indeed be detectable, if present in large enough quantities, as diffuse emission. And lastly, it is possible that for the more massive, compact, and older clusters, dynamics play a non-negligible role in the XRB evolution. We hope to extend our modeling to include dynamical considerations such as this in the near future.
References
- Aarseth et al. (1974) Aarseth, S. J., Hènon, M., & Wielen, R. 1974, A&A, 37, 183
- Arzoumanian, Chernoff, & Cordes (2002) Arzoumanian, Z., Chernoff, D. F., & Cordes, J. M. 2002, ApJ, 568, 289
- Belczynski et al. (2002) Belczynski, K., Kalogera, V., & Bulik, T. 2002, ApJ, 572, 407
- Belczynski & Taam (2003) Belczynski, K., & Taam, R. 2003, astro-ph/0311287, ApJ, submitted
- Fabbiano et al. (2001) Fabbiano, A., Zezas, A., & Murray, S. S. 2001, ApJ, 554, 1035
- Fabbiano & White (2005) Fabbiano, A., & White, N. E. 2005, in Compact Stellar X-ray Sources, ed. W. Lewin, & M. van der Klis (Cambridge: Cambridge University Press), to appear
- Harris et al. (2001) Harris, J., Calzetti, D., Gallagher, J. S. III, Conselice, C. J., & Smith, D. A., ApJ, 122, 3046
- Kaaret et al. (2004) Kaaret, P., Alonso-Herrero, A., Gallagher, J. S. III, Fabbiano, G., Zezas, A., & Rieke, M. J. MNRAS, 348, L28
- Kilgard et al. (2002) Kilgard, R. E., Kaaret, P., Krauss, M. I., Prestwish, A. H., Raley, M. T., & Zezas, A. ApJ, 572, 138
- Kroupa & Weidner (2003) Kroupa, P., & Weidner, C. 2003, ApJ, 598, 1076
- Lewin & van der Klis (2005) Lewin, W., & van der Klis, M. 2005, Compact X-ray Sources (Cambridge: Cambridge University Press), to appear
- Pasquali et al. (2003) Pasquali, A., de Grijs, R., & Gallagher, J. S. 2003, MNRAS, 345, 161
- Portegies Zwart, Dewi, & Maccarone (2004) Portegies Zwart, S., Dewi, J., & Maccarone, T. 2004, MNRAS, in press
- Sipior, Eracleous, & Sigurdsson (2003) Sipior, M. S., Eracleous, M., & Sigurdsson, S. 2003, preprint (astro-ph/0308077)
- Smith & Gallagher (2001) Smith, L. J., & Gallagher, J. S. III 2001, MNRAS, 326, 1027
- Tremonti et al. (2001) Tremonti, C. A., Calzetti, D., Leitherer, C., & Heckman, T. M. ApJ, 555, 322
- Zezas et al. (2002) Zezas, A., Fabbiano, G., Rots, A. H., & Murray, S. S. ApJ, 577, 710