Contamination and exclusion in the Orionis young group.
Abstract
We present radial velocities for 38 low-mass candidate members of the Orionis young group. We have measured their radial velocities by cross-correlation of high resolution (R 6000) AF2/WYFFOS spectra of the gravity sensitive Na i doublet at 8183, 8195 Å. The total sample contained 117 objects of which 54 have sufficient signal-to-noise to detect Na i at an equivalent width of 3 Å, however we only detect Na i in 38 of these. This implies that very low-mass members of this young group display weaker Nai absorption than similarly aged objects in the Upper Scorpius OB association. We develop a technique to assess membership using radial velocities with a range of uncertainties that does not bias the selection when large uncertainties are present. The resulting membership probabilities are used to assess the issue of exclusion in photometric selections, and we find that very few members are likely to be excluded by such techniques. We also assess the level of contamination in the expected pre-main sequence region of colour-magnitude space brighter than I = 17. We find that contamination by non-members in the expected PMS region of the colour-magnitude diagram is small. We conclude that although radial velocity alone is insufficient to confirm membership, high signal-to-noise observations of the Nai doublet provide the opportunity to use the strength of Nai absorption in concert with radial velocities to asses membership down to the lowest masses, where Lithium absorption no longer distinguishes youth.
keywords:
techniques: radial velocities – stars: pre-main-sequence – stars: low-mass, brown dwarfs – techniques: spectroscopic – open clusters and associations: Orionis –1 Introduction
Studies of the low-mass and sub-stellar initial mass function (IMF) provide the opportunity to constrain theories of star formation and investigate environmental influences on the final results of the formation process. Whilst the high and intermediate mass regions of the IMF have been well studied and found to be essentially universal in the field and in clusters (e.g. Hillenbrand, 2003; Garmany et al., 1982, and references therein), this is not the case for low and sub-stellar masses. Although there have been a number of studies of the low-mass IMF in the field (e.g. Reid et al., 1999; Kroupa, 2001), due to their inherent faintness only the most nearby of field T dwarfs are detected, leading to poor statistics at these masses. Searches for brown dwarfs in intermediate age ( yrs) clusters such as the Pleiades have proved fruitful (e.g. Moraux et al., 2003; Basri, 2000, and references therein). Unfortunately, to derive an IMF from the mass function of an intermediate age cluster requires corrections for the effects of stellar and dynamical evolution over the age of the cluster.
Young clusters and associations are the ideal places to study this region of the IMF. This is because many of the problems associated with measuring the IMF at the lowest masses disappear in such young regions. Firstly no correction need be made for the effects of stellar or dynamical evolution, the regions are sufficiently young that the measured mass function is the IMF. Also, the objects at substellar masses are much easier to observe at ages of less than 10 Myrs since they still shine brightly as gravitational potential is released. In addition, a supposed advantage of clusters and associations with ages of less than 2 Myrs is the lack of contaminating sources due to the fact that such young clusters are often still associated with their natal molecular cloud, which will tend to obscure the background to high extinctions. The Orion Nebula Cluster (ONC) has been extensively studied for just these reasons (e.g. Muench et al., 2002; Luhman et al., 2000; Lucas & Roche, 2000). However, inspection of the methods which must be employed for such studies reveals that association with a molecular cloud brings with it its own, unavoidable, problems.
Since there is often a spread of ages in young star forming regions, it is preferable to use photometric magnitudes and spectroscopically derived temperatures in conjunction with pre-main sequence (PMS) models to determine the age and mass for each object in the sample. Unfortunately due to the high extinctions present along sightlines toward young, partially embedded, clusters it is generally not possible to obtain spectroscopy for the lowest mass objects. Since there is also normally a large range of reddening toward objects within such clusters it is not possible to determine the age and mass for each object, and a distribution of ages and reddening must be assumed to obtain the IMF from the luminosity function (LF) (Muench et al., 2002). Another effect of the high extinction is that LFs must be constructed in the K- and L-band to avoid biasing the sample to the least extincted objects and to ensure a good level of completeness. However, it has been observed in the young clusters such as the ONC that up to 85% of the objects have circumstellar discs, which are responsible for infra-red excesses (e.g. Lada et al., 2000), making mass functions derived from K- and L-band LFs unreliable. These problems are avoided if star forming regions between 2 and 10 Myrs old are used for IMF studies. At these ages the clusters have often emerged fully from their natal cloud, presumably due to the UV flux from the massive stars evaporating the molecular gas. The lower extinction allows the luminosity function to be constructed in the I-band, which is less affected by circumstellar discs than the K-band, in addition to making spectroscopy possible down to very low masses. Since we need such regions to be as nearby as possible, to allow studies of the lowest mass objects, the number of prospective laboratories is very small. The most promising candidate is the Orionis ( Ori) young group, a constituent of the Orion OB1b association, which has age estimates in the range 1.7 - 5 Myrs (Warren & Hesser, 1978; Brown et al., 1994). The low extinction, (Lee, 1968), and small distance, pc (Perryman et al., 1997), make it ideal for studies of the low mass IMF.
Béjar et al. (2001) have carried out an investigation of the substellar IMF in the Ori region. They used a sample of 9 spectroscopically confirmed members to define the locus of the cluster sequence between M6 and L4 spectral types. They then used the location of this sequence in colour-magnitude (C-M) space to identify cluster members, and construct an I-band LF. Using several different models to construct their IMF, Béjar et al. (2001) found a mass spectrum with an exponent of 0.80.4 between 0.2 and 0.01M⊙, i.e. the number of objects per mass bin continues to increase with decreasing mass down to below the deuterium burning limit and into the realm of planetary mass objects. This corresponds to an IMF with an exponent = -0.2. The low extinction, however, means that background contamination cannot be ruled out, even in the locus of the cluster sequence. Barrado y Navascués et al. (2001) obtained spectral types for roughly one quarter of the photometrically selected candidates, confirming a high proportion of them as cool objects. Whilst such a method is effective at removing reddened background objects from a sample, it is not robust against interloping field dwarfs.
When the number of objects in each mass bin is so small, however, a small number of contaminants can have a significant effect on the derived mass function. Whilst Béjar et al. (2001) are careful with their photometric selection to avoid contamination, this could, in itself, lead to poorly understood completeness. Without empirically determining how far into the expected background region of the colour-magnitude diagram (CMD) bona fide members are still found, any photometric selection which minimises contamination may well exclude a significant fraction of member objects.
The likelihood of age spread in such a young cluster makes this consideration crucial. Kenyon et al. (2004) obtained fibre spectroscopy for a sample of over 70 candidate members, drawn from a catalogue, with masses between 0.055 and 0.3M⊙ (they assume a cluster age of 5 Myrs). They found that contamination from background objects was limited for the reddest region of each magnitude bin in the I/R-I CMD, but the PMS objects were poorly correlated with isochrones in this colour. They found better correlation in I/I-J, the colours used by Béjar et al. (2001), but the contamination was found to be considerably worse, becoming more prevalent at the faintest magnitudes. Additionally, the CMDs of Kenyon et al. (2004) show that any strict cut along isochrones in either set of colours would exclude a significant number of members.
It is clear that the only way to obtain a reliable IMF for this region is to use a spectroscopically confirmed sample of members, drawn from a broad region of colour magnitude space. Kenyon et al. (2004) used the presence of Li I absorption at 6708 Å to confirm youth and thus membership for objects in their sample. This technique, however, is limited to objects with M 0.065M⊙. Since objects below this mass never attain high enough core temperatures to burn Lithium, old foreground T-dwarfs cannot be distinguished from bona fide members based on Li absorption alone.
If a reliable IMF is to be derived for the lowest masses, another method of distinguishing members must be found. It is with this in mind that we have obtained fibre spectroscopy of the Nai doublet at 8183, 8195 Å for a photometrically selected sample of objects in the direction of the Ori cluster. Using this doublet has several benefits. Cool objects such as low-mass stars and brown dwarfs are brightest in the NIR and IR regions, where night sky emission can severely affect observations. The Nai doublet lies at a wavelength which is relatively unaffected by bright sky emission lines. Also the Nai doublet is a relatively strong spectral feature in cool stars, and so should be easy to observe a moderate signal-to-noise.
In this paper we have two aims. Firstly, to investigate the use of radial velocity, as measured from the Nai doublet, as a membership diagnostic. Whilst Li absorption would be an effective diagnostic for much of our sample, this work is concerned with developing a spectroscopic technique for use at magnitudes and colours where foreground contaminants may lie below the Li burning limit. Our second aim is to measure the level of contamination from non-members in the expected PMS region of the CMD and to determine if many bona fide members are excluded by photometric selection techniques.
The paper will be laid out as follows. In Section 2 we will discuss the rationale behind our target selection and our observations. In Section 3 we will describe our data reduction technique and our method for sky subtraction. In Section 4 we will describe our sample selection, the cross correlation of spectra to obtain radial velocities and the calculation of membership probabilities. Section 5 will contain a discussion of the results. A summary of our conclusions will be given in Section 6.
2 Optical Spectroscopy Using AF2/WYFFOS
2.1 Target Selection
We obtained spectra for 117 objects using the AF2/WYFFOS fibre spectrograph on the William Herschel Telescope at the Observatorio del Roque de Los Muchachos, La Palma. The targets were selected from the photometric catalogue described by Kenyon et al. (2004) and were chosen to compliment the sample for which spectroscopic observations have already been obtained (Kenyon et al., 2004). Since many of the reddest objects have already been observed, particularly at the brighter magnitudes, we were able to cut deep into the region which is thought to be background contamination, see Figure 1. This method of target selection has served a dual purpose: 1) it allows us to investigate the possibility of contamination in the PMS region of colour magnitude space; 2) it allows us to investigate the number of member objects which might be lost in more conservatively drawn samples. The distribution of the targets, in relation to Ori, and the WYFFOS/WHT FoV is shown in Figure 2.


2.2 Observations
We observed our targets using the small fibre (1.6”) setup on the nights of the 3rd and 4th January 2003. Conditions were dark, and cloud was only present during the first half of the second night. We observed in 3rd order echelle mode, with a central wavelength of 8300 Å. This gives a dispersion of 0.57 Å/pixel and we achieved a resolution of approximately 1.4 Å. We elected to observe the Nai doublet at high resolution so as to avoid broadening the bright sky emission lines and obscuring the doublet.
We achieved a total exposure time of 9.5 hours for the faintest targets. This time was split between 4 configurations to maximise the number of objects we could observe (see Table 1). The brightest targets were only observed in the shortest set-ups, with fainter ones observed using a combination of set-ups to achieve appropriate integration times. Each set of exposures was subdivided into Sections of 900s or 1800s, depending on the total exposure required for the set-up. Between exposures of the target objects, the telescope was moved such that Ori lay over a fibre, and a spectrum of Ori was obtained for the purposes of telluric correction. Copper-Neon arc frames were also obtained for both positions of the telescope at these times. To maximise our exposure times we did not observed offset sky fields, as is advised by Wyse & Gilmore (1992), for estimating the relative throughput of the fibres prior to sky subtraction. However, the relative throughput of the fibres in the small fibre bundle is considerably more homogeneous than it had been for the older large fibre bundle (see http://www.ing.iac.es/Astronomy/instruments/af2/index.html), and we have an alternative method for achieving sky subtraction, which will be described later. We also observed several stars for use as radial velocity standards, these observations are detailed in Table 2, along with the identifier of the telluric reference observed.
Unfortunately, many of the spectra we obtained suffered from poor signal-to-noise, and others had no detectable signal at all. We have correlated the photometric catalogue used to select our targets with a 2MASS catalogue for the same region and find the RMS in the residuals of the coordinates to be approximately 0.2” in both axes. As such, we rule out errors in the astrometry of the catalogue as an explanation for our missed targets. We also rule out proper motion as a factor. At the target selection stage the 2MASS catalogue for our potential targets was correlated against the SuperCosmos sky survey catalogue for the same region and objects with large coordinate residuals were excluded. Whilst source variability, well known in T Tauri stars, may have had an influence on the signal detected from some of the targets, we believe the failure to achieve the desired signal-to-noise in so many spectra is the result of two problems with the AF2/WYFFOS field of view (FoV). Firstly, the point spread function (PSF) is highly variable across the FoV, becoming very smeared out beyond a radius of 25 arcminutes. As such, when using the small fibre bundle a large proportion of the signal from a target star in the outer area of the FoV will be lost. This effect explains the poor signal-to-noise found in the spectra of some objects. The second problem is that the astrometric distortion in the AF2/WYFFOS FoV is poorly constrained, meaning that many objects were simply missed by their assigned fibre. The method employed for selecting our sample from the available spectra is discussed in Section 4.1.
| Configuration | Integration Time (s) | No. of Sky Fibres |
|---|---|---|
| Long1 | 12600 | 58 |
| Long2 | 12600 | 49 |
| Medium | 5400 | 35 |
| Short | 3600 | 29 |
3 Data Reduction
3.1 Extraction of Spectra
The spectra were extracted and dispersion corrected using the WYFFOS data reduction routines within the RGO package within the IRAF environment (Lewis, 1996). The spectra were bias subtracted using the mean bias level in the overscan region of the Tek6 detector. Flatfielding was achieved using Tungsten flatfields, which were also used for aperture detection. The apertures were traced using steps of 5 pixels and fitted using a 2rd order spline function. Spectra were then optimally extracted from target, Ori and arc frames. Dispersion correction for each spectrum was achieved by first fitting a 4th order Chebyshev function to arc lines that were manually identified in the spectrum from the middle aperture of the appropriate arc frame. An automated procedure then obtained solutions using the same lines in the remaining apertures. The RMS deviation from the dispersion solution across the apertures in the arc frames was typically 0.01-0.02 Å. These solutions were then applied to spectra from the same apertures in the target frame.
3.2 Telluric Correction and Sky Subtraction
Absorption features due the Earth’s atmosphere can influence the results of cross-correlation, by biasing the result towards zero velocity. As such the effects of the atmospheric, or telluric, absorption must be corrected for. It is normal for an O-star, whose spectrum should be nearly featureless, to be used to as a reference spectrum for telluric correction. This can lead to difficulty when the reference star is well separated from the targets, as one is required to assume that the telluric absorption is uniform in both time and position. Fortunately, Ori itself provides us with an appropriate reference spectrum, and is located within our FoVs. As such, we need only assume that the telluric absorption is uniform over short periods of time.
Telluric correction was carried out on spectra from each sub-exposure using the temporally closest Ori spectrum. Radial velocity standard spectra were corrected using a telluric reference observed immediately before or after each exposure, and chosen to be close-by on the sky, and these are listed in Table 2. In each case the object spectrum was divided by a rectified version of the telluric reference spectrum, thus removing absorption features originating in the Earth’s atmosphere.
The object spectra from the sub-exposures of each configuration were combined by median stacking prior to sky subtraction. We calculated the uncertainties in flux at this point as the standard error about the median. Two master sky spectra were constructed for each configuration by calculating (i) the weighted mean and (ii) the median of median stacked spectra from each sub-exposure. The sky spectra used for constructing the median sky for each sub-exposure were selected on the basis of being free of cosmic rays in the region of interest (8100 Å 8300 Å). Since our target region is well seperated from the nebular emission near the Horsehead, the background is flat. As such, use of a master sky spectrum for each set-up is appropriate (see below also).
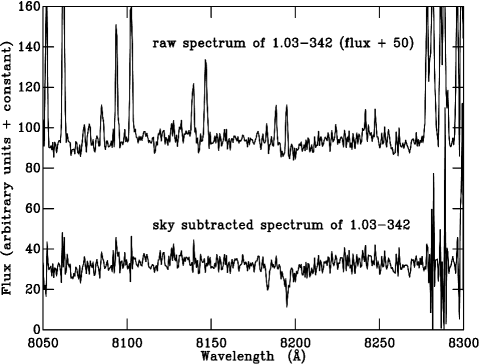
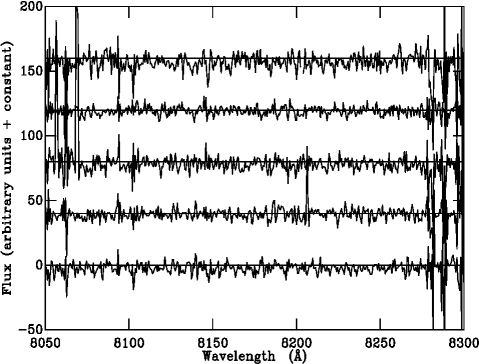
Since no offset sky frames were obtained, it was not possible to estimate the relative throughput of each fibre and use this to scale the master sky spectrum to each fibre for subtraction. Instead we have iteratively scaled the master sky frame until the subtraction is optimised for the removal of sky lines. The method we use is identical to that used by Beekman et al. (2000) for removing the, relatively sharp-spiked, secondary star spectrum from that of a cataclysmic variable (CV). In this case the master sky frame is treated as a template secondary star spectrum, and the target+sky as the CV spectrum. First we subtract the master sky frame with no scaling and smooth the residual with a smoothing length of 50 pixels. The smoothed residual is then subtracted from the unsmoothed residual and the per pixel calculated. This procedure is then repeated with a series of different scale factors. The scale factor that results in the lowest value of is the one which is then applied to master sky spectrum prior to subtraction from the data. An example of the success of this method of sky subtraction is shown in Figure 3. This method was carried out using both versions of the master sky frames. As can be seen in Figure 3, sky emission lines lie at similar wavelengths to the Nai doublet of interest. As such it is crucial that the sky lines are not over-subtracted, giving rise to spurious absorption features. To assess the effectiveness of each sky subtraction we used the two emission lines just blueward of 8150 Å as diagnostic lines. Since these lines were found to be more intense than those situated over Nai doublet in the spectra from all sky fibres, they are good indicators of over-subtraction. A problem would arise if the relative strengths of these lines varied significantly across the field of view, or over the period of time that a set-up was observed for. To assess this potential problem we have tested the sky subtraction on a number of sky fibres from across the field of view and from different exposures in a set-up. No cases were found where over-subtraction had taken place but was not evidenced by absorption in the diagnostic lines. Figure 4 shows a selection of these test subtractions to illustrate this point.
The visual inspection of the residual spectra resulted in a preferred version of the sky frames to be used for each object in a configuration, and this was forced to be the same across all configurations for a given object to ensure a consistent method. In the vast majority of cases the median stacked sky frames performed better. It should be noted that since the spectra have not been corrected for the relative throughput of the fibres, it is not possible to flux calibrate spectra that have been sky subtracted in this manner. At this stage spectra for objects obtained in different configurations were co-added to arrive at the final spectra. These spectra are available on-line via the CDS service or from the Cluster collaboration homepage111http://www.astro.ex.ac.uk/people/timn/Catalogues/description.html.
4 Selecting Members by Radial Velocity
4.1 Sample Selection
As discussed in Section 2.1, we did not obtain good data for every object in the sample. To avoid biasing our sample at this stage we opted to apply a signal-to-noise cut to select our sample. We measured the equivalent width of the Nai doublet, hereafter EW(Nai), in all the spectra obtained. We used two continuum bands: 1) 8151-8173 Å; 2) 8233-8255 Å. The wavelength range for continuum band 2 was selected to avoid the TiO band which lies redward of 8200 Å. We integrated EW(Nai) over the range 8180-8202 Å. Those objects which had a sufficiently small uncertainty to allow a 2 detection of the doublet at an equivalent width (EW) of 3 Å, i.e. 1.5 Å, were included in the sample. This EW was chosen as most brown dwarfs detected by Martín et al. (2004) in the Upper Scorpius OB association displayed an EW(Nai) above this value. The selected objects and their values for EW(Nai) are listed in Table 3. Our objective measure for the presence of Nai absorption was an EW(Nai) measured at a significance of 2 or greater. Our objective measure failed to detect Nai in 11 of the selected sample objects. We rule out the presence of Nai in a further 5 objects, despite the objective measure suggesting its presence. These false detections were caused in two cases (1.03-460, 1.03-612) by the small sky line residuals affecting the continuum estimate. One false detection (8.03-396) was caused by over-subtracted sky lines within the EW integration band. The other two false detections (8.04-50, 8.04-77) were caused by unidentified absorption features encroaching on the EW integration band. Since no radial velocity can be obtained when Nai is not detected, we do not include such objects in our cross correlation nor do we calculate membership probabilities.
All of the objects with a failed Nai detection are fainter than I=17. The strength of the Nai doublet is gravity dependant, getting stronger with increasing surface gravity. As such it has been used as a discriminator between field dwarfs and giants (e.g. Schiavon et al., 1997) and field dwarfs and young brown dwarfs (Martín et al., 2004). Failure to detect Nai in the spectrum of an object could indicate that it is a giant with a sufficiently low surface gravity to weaken Nai beyond our detection threshold. However, since very young brown dwarfs also have low surface gravity the same might be expected from members of the Ori group. Surface gravities are typically higher in young (age 5 Myrs) brown dwarfs, , than in M-giants, (Gorlova et al., 2003), so we might expect to be able to distinguish between extremely low surface gravity giants and young brown dwarfs. This will be discussed further in Section 5.
4.2 Cross Correlation of Spectra to Obtain Radial Velocities
We obtained radial velocities for objects in our sample which displayed Nai absorption by cross correlating their spectra against those of stars with known velocities and similar spectral types to our targets. The stars observed as radial velocity standards are detailed in table 2. The wavelength range used for the cross correlation was restricted to 8175 - 8205 Å to minimise the effects of noise in the spectra. We restricted the range of acceptable correlations to be 100km s-1, and as a result velocities were not found for some objects on some cross correlations. Uncertainties for each velocity measurement were estimated by perturbing the value of the flux at each data point in the target spectrum by some value drawn from a Gaussian based on the uncertainty in the flux. This was repeated 100 times and the resulting spectra were cross correlated against the standards in the same manner as the original data. The uncertainty in velocity was taken to be the standard deviation in the distribution of velocities from the perturbed spectra. The quality of all cross correlation functions were assessed by visual inspection and none were found to have any evidence of the multiple peaks that might be expected if the sky subtraction introduced spurious features.
Although the 4 different velocity standards gave similar results, the use of GJ3517 gave the most successful correlations. As such, this is the one we chosen to use for further analysis. The velocities and uncertainties resulting from cross correlations against GJ 3517 are given in Table 3.
| Star | (J2000) | (J2000) | Sp. Type | I | Integration time (s) | / km s-1 | EW(Nai) / Å | Telluric reference | |
|---|---|---|---|---|---|---|---|---|---|
| WX UMa | 11 05 30.31 | +43 31 16.6 | M6 | 200 | 681 | 8.28 | 0.10 | SAO 43460 | |
| GJ412A | 11 05 28.58 | +43 31 36.4 | M0.5 | 10 | 681 | 2.18 | 0.09 | SAO 43460 | |
| GJ3517 | 08 53 36.11 | -03 29 32.4 | M9 | 14.44 | 400 | 92 | 5.04 | 0.38 | SAO 136434 |
| LP213-67 | 10 47 12.65 | +40 26 43.7 | M6.5 | 13.17 | 600 | 53 | 6.55 | 0.21 | SAO 62257 |
| Field | Object | (J2000) | (J2000) | Flag | Flag | EW | Pvel | |||||||
|---|---|---|---|---|---|---|---|---|---|---|---|---|---|---|
| Å | Å | km s-1 | km s-1 | % | ||||||||||
| 1.01 | 319 | 05 39 48.911 | -02 29 11.05 | 15.012 | 0.007 | VV | 1.595 | 0.011 | VV | 3.23 | 0.11 | 24.25 | 0.86 | 77.3 |
| 8.02 | 179 | 05 39 47.696 | -02 36 22.96 | 15.064 | 0.005 | OO | 1.508 | 0.008 | OO | 3.04 | 0.10 | 26.37 | 1.13 | 99.9 |
| 4.03 | 229 | 05 38 23.536 | -02 41 31.66 | 15.149 | 0.008 | OO | 1.686 | 0.013 | OO | 2.31 | 0.25 | 27.61 | 2.38 | 98.8 |
| 1.01 | 253 | 05 40 51.369 | -02 31 49.93 | 15.232 | 0.007 | OO | 1.337 | 0.011 | OO | 3.21 | 0.30 | 10.48 | 4.91 | 0.0 |
| 8.02 | 143 | 05 39 56.445 | -02 38 3.43 | 15.258 | 0.005 | OO | 1.725 | 0.007 | OO | 2.17 | 0.11 | 31.18 | 1.00 | 100.0 |
| 3.01 | 67 | 05 38 46.835 | -02 36 43.38 | 15.278 | 0.016 | OO | 1.878 | 0.038 | OO | 0.64 | 0.10 | 32.11 | 1.32 | 100.0 |
| 2.03 | 260 | 05 39 30.561 | -02 38 26.89 | 15.304 | 0.007 | OO | 1.320 | 0.011 | OO | 3.84 | 0.12 | 18.98 | 1.12 | 0.00 |
| 4.03 | 237 | 05 37 54.857 | -02 41 9.15 | 15.400 | 0.006 | VV | 1.690 | 0.010 | VV | 1.32 | 0.39 | 33.86 | 3.56 | 89.5 |
| 1.03 | 60 | 05 40 30.179 | -02 12 6.13 | 15.520 | 0.007 | VV | 1.594 | 0.011 | VV | 4.13 | 0.76 | 31.87 | 6.26 | 84.3 |
| 1.03 | 108 | 05 39 57.370 | -02 10 41.98 | 15.545 | 0.007 | OO | 1.675 | 0.011 | OO | 3.59 | 0.18 | 29.15 | 1.93 | 100.0 |
| 8.04 | 188 | 05 40 42.887 | -02 23 47.43 | 15.577 | 0.005 | OO | 1.413 | 0.007 | OO | 3.39 | 0.35 | -32.22 | 2.00 | 0.00 |
| 3.01 | 51 | 05 38 23.070 | -02 36 49.32 | 15.716 | 0.014 | OO | 1.423 | 0.022 | OO | 1.57 | 0.27 | 34.50 | 2.51 | 92.1 |
| 2.03 | 63 | 05 40 34.389 | -02 44 9.52 | 15.770 | 0.007 | OO | 1.850 | 0.011 | OO | 3.28 | 0.17 | 33.15 | 1.24 | 100.0 |
| 4.03 | 29 | 05 38 22.824 | -02 45 30.43 | 15.876 | 0.006 | OO | 1.314 | 0.010 | OO | 3.34 | 0.35 | -10.71 | 7.19 | 0.00 |
| 4.03 | 368 | 05 38 26.833 | -02 38 46.04 | 16.123 | 0.006 | OO | 1.911 | 0.011 | OO | 2.22 | 0.30 | 30.38 | 3.21 | 99.6 |
| 2.03 | 191 | 05 40 29.437 | -02 40 55.91 | 16.229 | 0.005 | OO | 1.368 | 0.007 | OO | 3.48 | 0.25 | XC failed | - | - |
| 8.01 | 333 | 05 40 52.870 | -02 38 23.49 | 16.246 | 0.005 | OO | 1.558 | 0.008 | OO | 2.46 | 0.47 | 29.98 | 3.38 | 99.4 |
| 4.04 | 481 | 05 38 36.374 | -02 47 8.22 | 16.260 | 0.006 | OO | 1.527 | 0.011 | OO | 5.35 | 0.45 | 11.41 | 8.52 | 2.0 |
| 1.02 | 237 | 05 38 58.168 | -02 21 11.70 | 16.283 | 0.007 | VV | 1.443 | 0.012 | VV | 2.32 | 0.24 | -10.48 | 2.10 | 0.00 |
| 4.03 | 215 | 05 38 38.589 | -02 41 55.86 | 16.472 | 0.006 | OO | 1.804 | 0.011 | OO | 2.65 | 0.39 | 31.11 | 4.10 | 97.3 |
| 1.01 | 343 | 05 40 23.389 | -02 28 27.51 | 16.527 | 0.005 | OO | 1.551 | 0.008 | OO | 5.02 | 0.41 | 2.29 | 3.06 | 0.00 |
| 1.01 | 348 | 05 39 36.324 | -02 28 8.18 | 16.808 | 0.008 | OO | 1.363 | 0.013 | OO | 3.37 | 0.84 | -9.63 | 17.60 | 0.4 |
| 1.02 | 87 | 05 39 8.076 | -02 31 32.22 | 16.811 | 0.008 | OO | 1.567 | 0.013 | OO | 3.05 | 0.24 | -42.90 | 5.12 | 0.0 |
| 1.02 | 157 | 05 39 25.246 | -02 27 48.15 | 16.856 | 0.008 | OO | 1.550 | 0.013 | OO | 3.64 | 0.28 | 28.86 | 2.47 | 99.8 |
| 3.01 | 480 | 05 38 38.888 | -02 28 1.63 | 16.989 | 0.008 | OO | 1.777 | 0.013 | OO | 3.42 | 0.43 | 35.94 | 5.78 | 60.1 |
| 8.04 | 77 | 05 41 25.629 | -02 30 38.53 | 17.050 | 0.007 | OO | 2.028 | 0.012 | OO | 6.83 | 0.85 | - | - | - |
| 1.03 | 110 | 05 39 56.919 | -02 10 38.35 | 17.102 | 0.009 | OO | 1.674 | 0.015 | OO | 6.13 | 1.29 | 18.32 | 9.70 | 20.9 |
| 8.04 | 185 | 05 41 45.472 | -02 24 16.24 | 17.102 | 0.007 | OO | 1.937 | 0.012 | OO | 0.56 | 1.47 | - | - | - |
| 1.01 | 237 | 05 39 36.726 | -02 31 58.88 | 17.249 | 0.009 | OO | 1.485 | 0.015 | OO | 5.11 | 0.65 | -9.78 | 3.46 | 0.0 |
| 8.04 | 128 | 05 41 12.228 | -02 27 34.40 | 17.285 | 0.007 | OO | 1.787 | 0.013 | OO | 1.54 | 1.25 | - | - | - |
| 2.03 | 233 | 05 39 40.571 | -02 39 12.32 | 17.293 | 0.009 | OO | 1.597 | 0.015 | OO | 2.80 | 0.67 | 39.84 | 6.23 | 25.9 |
| 4.03 | 285 | 05 38 44.487 | -02 40 37.65 | 17.297 | 0.008 | OO | 2.127 | 0.017 | OO | 1.90 | 0.99 | - | - | - |
| 1.01 | 581 | 05 39 30.077 | -02 33 16.14 | 17.337 | 0.009 | OO | 1.516 | 0.015 | OO | 4.25 | 0.85 | -18.90 | 3.52 | 0.00 |
| 2.03 | 336 | 05 40 18.589 | -02 36 14.57 | 17.392 | 0.006 | OO | 1.519 | 0.009 | OO | 4.69 | 0.70 | -12.86 | 1.91 | 0.00 |
| 8.02 | 412 | 05 39 49.737 | -02 23 51.80 | 17.484 | 0.007 | OO | 1.716 | 0.011 | OO | 6.49 | 0.50 | 15.06 | 5.34 | 1.0 |
| 8.04 | 50 | 05 41 10.419 | -02 31 34.50 | 17.541 | 0.008 | OO | 1.908 | 0.019 | OO | 4.32 | 1.31 | - | - | - |
| 1.03 | 460 | 05 40 48.927 | -02 08 12.06 | 17.555 | 0.013 | OO | 2.517 | 0.033 | OO | 1.70 | 0.65 | - | - | - |
| 1.03 | 557 | 05 40 7.241 | -02 04 4.41 | 17.603 | 0.011 | OO | 1.723 | 0.019 | OO | 2.76 | 0.60 | -23.74 | 6.44 | 0.00 |
| 1.03 | 493 | 05 40 1.742 | -02 06 28.83 | 17.814 | 0.012 | OO | 1.620 | 0.020 | OO | 3.99 | 0.74 | 13.57 | 15.79 | 16.2 |
| 1.02 | 366 | 05 39 2.030 | -02 35 30.30 | 18.062 | 0.023 | OV | 1.925 | 0.077 | OV | 4.52 | 1.13 | -0.73 | 7.41 | 0.00 |
| 8.04 | 225 | 05 41 4.584 | -02 32 25.98 | 18.079 | 0.010 | OO | 2.069 | 0.023 | OO | 2.55 | 0.68 | 27.42 | 2.07 | 99.4 |
| 1.03 | 342 | 05 40 3.305 | -02 12 20.57 | 18.114 | 0.014 | OO | 1.750 | 0.026 | OO | 3.70 | 0.38 | 1.61 | 2.51 | 0.00 |
| 8.03 | 147 | 05 41 1.913 | -02 19 3.99 | 18.203 | 0.011 | OO | 1.958 | 0.024 | OO | 1.11 | 0.88 | - | - | - |
| 2.03 | 617 | 05 40 24.775 | -02 38 10.88 | 18.336 | 0.009 | OO | 1.989 | 0.019 | OO | 1.39 | 0.53 | 32.26 | 6.36 | 82.4 |
| 1.03 | 1094 | 05 40 36.238 | -02 04 49.07 | 18.452 | 0.022 | OO | 2.052 | 0.047 | OO | 1.70 | 0.96 | - | - | - |
| 1.02 | 672 | 05 39 7.958 | -02 15 43.04 | 18.540 | 0.019 | OO | 1.709 | 0.036 | OO | 1.00 | 0.59 | - | - | - |
| 1.01 | 800 | 05 40 12.537 | -02 26 16.49 | 18.821 | 0.013 | OO | 1.838 | 0.027 | OO | 1.31 | 1.35 | - | - | - |
| 1.03 | 1029 | 05 39 51.156 | -02 06 5.43 | 18.919 | 0.027 | OO | 1.894 | 0.056 | OO | 1.06 | 0.63 | - | - | - |
| 1.04 | 1100 | 05 40 19.740 | -02 16 54.11 | 18.976 | 0.027 | OO | 2.182 | 0.066 | OO | 7.93 | 1.00 | 31.09 | 11.66 | 57.5 |
| 1.03 | 612 | 05 40 33.842 | -02 13 42.97 | 19.295 | 0.038 | OO | 2.097 | 0.088 | OO | 2.52 | 0.77 | - | - | - |
| 8.03 | 457 | 05 40 58.366 | -02 11 34.65 | 19.333 | 0.029 | OO | 2.407 | 0.079 | OO | -1.82 | 0.69 | - | - | - |
| 8.03 | 396 | 05 41 4.416 | -02 14 47.07 | 19.411 | 0.028 | OO | 2.146 | 0.070 | OO | 2.03 | 0.88 | - | - | - |
| 1.03 | 933 | 05 40 30.717 | -02 08 6.78 | 19.573 | 0.053 | OO | 2.263 | 0.132 | OO | 2.22 | 1.19 | - | - | - |
| 8.02 | 2051 | 05 39 54.188 | -02 26 25.25 | 19.709 | 0.031 | OO | 2.010 | 0.070 | OO | -1.93 | 1.17 | - | - | - |
4.3 Membership Probabilities
A histogram of the velocities obtained in the previous Section (Figure 5) shows that there is no simple velocity cut that will separate members of the Ori group from non-members. Also the velocities derived in the previous Section have a range of uncertainties, due the range of signal-to-noise in the different spectra, so a simple n-cut from a mean cluster velocity will tend to preferentially select poor signal-to-noise objects as members. Instead we can assign a probability of membership, Pmem, to each object for which we have a velocity. This probability is the product of the probability that the object is at an appropriate velocity to be considered a member, Pvel, and the probability that an object at that velocity is not a radial velocity contaminant, (1 - Pcont). The first question that must be answered, then, is what constitutes an appropriate velocity for membership of the cluster? We have plotted the cumulative probability distribution of the sample by summing Gaussians constructed from the velocities and uncertainties for all objects with a radial velocity. As can be seen in Figure 6, there is a strong peak in this distribution centered at 29.5 km s-1. Since we do not resolve the velocity dispersion of the cluster, we can take the full width at the level of the background as the range of velocities occupied by cluster members. Pvel is then simply found as the fraction of the Gaussian derived from an object’s velocity and error that lies within the cluster range. We take the cluster range to be 24-37 km s-1, based on the peak’s full width at the level of the background.
The value we find for the group velocity, 29.5 km s-1 (and the range of 24-37 km s-1), is consistent with that measured by Kenyon et al. (2004) of 31.2 km s-1, and with the mean of values for members of this group measured by Muzerolle et al. (2003) of 30.9 km s-1. It is also consistent with the mean radial velocity of Orionis itself of 29.2 2.0 km s-1 (Wilson, 1953). This is at odds with the value measured by Zapatero Osorio et al. (2002) of 37.3 km s-1, but it is not clear why they have measured such a high velocity for this young group.
The probability that an object at the velocity of the cluster is a radial velocity contaminant can be taken as the ratio of the probability in Figure 6 integrated over a velocity interval equal in size to the cluster range (but lying in the non-cluster region) to the probability integrated over the cluster peak in Figure 6. We find Pcont = 0.2 for this sample. We emphasise that this probability applies to the entire sample, i.e. over the entire C-M space examined. The value of Pcont will change if, for example, one limits ones attention to the “PMS” region of the CMD (see below). As such we only list values of Pvel in table 3 so as to avoid misinterpretation of the results.


5 Discussion
In the following discussion we refer to the region redward of the solid line in Figure 7 as the expected PMS region. The region that lies blueward of this line is referred to as the background region. This locus was selected as the dividing line as it corresponds to a liberal photometric selection, and so provides an interesting case for investigating exclusion of members and contamination by non-members.
5.1 Are there members outside the “PMS” region?
The simplest way to answer this question is to examine the cumulative probability distribution of the velocities for the objects in the “background” region of the CMD. We have plotted this distribution with a dotted line in Figure 6. It is clear from this plot that there is no over-density in the probability distribution at the cluster velocity. This implies that there is not a significant number of members in the background region of the CMD, and hence photometric selection techniques are not excluding members of the Ori young group. This is the principal conclusion of this work.
5.2 Contamination within the “PMS” region
As can be seen in Figure 7, at magnitudes brighter than about I = 17 we find that all of the objects in the expected PMS region have P 80% except one, which has P 77.3%. This is consistent with the result of Kenyon et al. (2004) that essentially all objects in the PMS region of the CMD are members of the Ori young group.
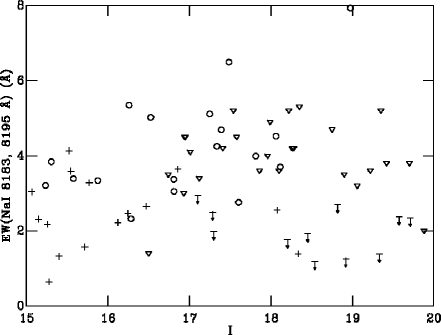
Fainter than I = 17 the situation is somewhat different. We only detect Nai in 13 out of 29 objects in this part of our sample. The failure to detect Nai in so many objects in this part of the CMD makes a discussion of the contamination problems in this region impossible. However, this failure is itself worthy of some discussion. As already mentioned, the signal-to-noise threshold used to select our sample was chosen by comparison to Martín et al. (2004), who find EW(Nai) 3 Å for all but 2 of their members of the 5 Myr old Upper Scorpius association. As such we expected that the majority of members of the similar aged Ori group might share this property. By comparing the EWs of members in both associations we can assess any differences between them. It would be simplest to compare the EWs of likely members in the two associations using colours, since this is a fair proxy to spectral type, however 2MASS colours are only available for the 10 brightest of our likely members. Instead we compare the EWs in the two samples using the I-band magnitudes, corrected for the differing distances to the two associations.
Figure 8 shows that the likely members from our sample display weaker Nai EWs than the Martín et al. (2004) members of Upper Scorpius. This is not surprising in the case of the objects brighter than I = 17 as they will be of earlier spectral type than any of the Martín et al. (2004) objects, and the Nai doublet gets weaker with increasing temperature at a given value of (Schiavon et al., 1997). By this token, we might expect the fainter objects, presumably with later spectral types, to display stronger Nai absorption, however this does not seem to be the case. Both of the likely members with I 17 have EW(Nai) 2.5 Å. Inspection of the measured EWs for the failed detections (see Table 3) indicates that the majority of them are consistent with values of EW(Nai) 2 Å. This is somewhat lower than the typical values seen in the Martín et al. (2004) sample. Thus we are presented with two options: 1) the failed detections are interloping giants and sub-giants with low surface gravities; 2) many of the failed detections are member brown dwarfs which display weak Nai absorption. Option 1 requires many giant stars to be located at great distance and along our line of sight, yet with colours that coincide with the expected PMS region of C-M space. Since the line of sight towards Ori is elevated -17.3∘ from the galactic plane, it is hard to see that option 1 is feasible. Option 2, however, requires the low-mass objects in Ori to display consistently weaker Nai absorption in the 8183, 8195 Å doublet than has been observed in Upper Scorpius by Martín et al. (2004).
Upper Scorpius is thought to be marginally older than Ori, 5-10 Myrs versus 1-5 Myrs, so we might expect to see weaker Nai absorption in Ori, as will be lower in the younger group. Mohanty et al. (2004) derive surface gravities for a number of low-mass objects in Upper Scorpius, and compare them to model predictions. They find that changes from about 3.7 to 4.2 between 1 and 10 Myrs for a 0.04 M⊙ brown dwarf (I = 18 at the distance of Ori), and even less of a change at lower masses. Given that giants have 0, and display EW(Nai) 1 Å(Schiavon et al., 1997), it is difficult to see how such a small change in could give rise to the factor 2 discrepancy between the EW(Nai) measured here for objects in Ori and those measured for objects in Upper Scorpius by Martín et al. (2004). The discrepancy between the two sets of EWs can likely be explained without resorting to a physical interpretation. The spectra used by Martín et al. (2004) are significantly lower resolution (R=900) than those used here, and this could lead to placing the pseudo-continuum over blended absorption features such as the TiO band just redward of the Nai doublet. Thus we suggest that option 2 is the most likely explanation for these results. We can not determine if this is due to a physical difference between the two regions or if it has resulted from a difference in measurement techniques.
This result implies that it will be very hard to distinguish between background giants and member brown dwarfs based on the strength of Nai absorption.
The low values of EW(Nai) implied for faint objects in our sample suggest that to avoid biasing such samples against finding members, observations should be made to a sufficient signal-to-noise to detect the Nai doublet in giant stars. Unfortunately, this destroys one of the main benefits of using the Nai doublet for radial velocity determination in main sequence stars, the ability to measure it at low signal-to-noise due to its strength. This is offset, however, by the fact the gravity sensitive nature of this doublet can provide a second diagnostic for contaminants
A possible weakness in use of radial velocities to define membership of young groups is the fact that bona fide members can be ruled out when they are members of binary systems. Dolan & Mathieu (2001) use the radial velocities in concert with the presence of Lithium absorption at 6708 Å to identify 266 likely members of the Ori young group. They find that 9 objects with EW(Li) consistent with youth are double lined binaries, while 3 appeared to be single line binaries. Whilst double lined binaries can be recognised as such, and not ruled out of membership lists, the single lined binaries would be ruled out in the absence of additional evidence of their membership. If we assume a similar binary fraction and distribution of properties as that seen by Dolan & Mathieu (2001) in Ori, we can estimate that for our sample of 18 likely members, we would not expect to identify any double lined binaries, or to miss any single lined ones. Since we cannot use EW(Nai) to identify members, we cannot assess whether we have ruled out any single lined binaries from our membership lists. However, a significant departure from behaviour elsewhere in the Orion OB1 association would be required for a significant number of members to be ruled out due to binarity.
We have cross-correlated our sample against the candidate membership lists of Béjar et al. (1999, 2001). We find that only one object, 3.01 480, correlates in position with an object, SORI 68, from their sample. However, we do not believe that they are the same object since there is a nearly 6 magnitude discrepancy in their I-band brightness (I=16.99 vs. I=23.78). The fact that we do not share objects with the Béjar et al. (1999, 2001) sample is explained by a number of factors. Firstly, our catalogue excludes the regions immediately adjacent to the Ori multiple system, whereas the Béjar et al sample does not. In addition, our catalogue covers a much larger Section of sky (Kenyon et al., 2004), so there are many objects that Béjar et al were simply unable to select as candidates. Finally, we draw our sample from a wider region of C-M space than Béjar et al, and so we simply miss some of their candidates due to a lower density of selected objects.
6 Conclusions
We have carried out high resolution spectroscopy of the Nai doublet
at 8183, 8195 Å of a sample of candidate low-mass stellar and substellar
members of the Ori young group drawn from a broad region
of C-M space. We have selected a sample of 54 objects
which displayed sufficient signal-to-noise to detect Nai with
EW(Nai) = 3 Å at a significance of 2, a criterion based on
observations of brown dwarfs in Upper Scorpius by Martín et al. (2004).
Significant (EW(Nai) 2) Nai was detected in 38 of
the 54 sample objects, and these were cross-correlated against an M9V
standard to obtain radial velocities, which were then used to
calculate membership probabilities. We find that 13 objects are
likely radial velocity members (P) of the
Ori young group.
Based on these probabilities, and the values measured for EW(Nai) we
arrive at the following conclusions.
1) Photometric selection techniques do not miss significant
numbers of bona fide association members.
2) At I brighter than 17 the expected PMS region of the CMD does not contain a
significant number of contaminants.
3) Very low-mass objects in the Ori young group appear to have
weaker EW(Nai) than found by Martín et al. (2004) for low-mass members of
the Upper Scorpius OB association. We have no explanation for why
this is so, although we suggest measurement effects could account for this.
4) High resolution observations of the Nai doublet at 8183, 8195 Å offer the possibility of 2 membership diagnostics for very low-mass
objects from a single observation.
Ensuring observations are made to sufficient
signal-to-noise to detect the doublet in the spectrum of a () giant star will avoid biasing a sample against bona fide
members with lower than expected EW(Nai).
Acknowledgements
SPL is supported by PPARC. The authors acknowledge the data analysis facilities at Exeter provided by the Starlink Project which is run by CCLRC on behalf of PPARC. A huge ‘thank you’ goes to Dr Alasdair Allan for his work on fibsplitter and the web service.
References
- Béjar et al. (2001) Béjar V. J. S., Martín E. L., Zapatero Osorio M. R., Rebolo R., Barrado y Navascués D., Bailer-Jones C. A. L., Mundt R., Baraffe I., Chabrier C., Allard F., 2001, ApJ, 556, 830
- Béjar et al. (1999) Béjar V. J. S., Zapatero Osorio M. R., Rebolo R., 1999, ApJ, 521, 671
- Baraffe et al. (2002) Baraffe I., Chabrier G., Allard F., Hauschildt P. H., 2002, A&A, 382, 563
- Barrado y Navascués et al. (2001) Barrado y Navascués D., Zapatero Osorio M. R., Béjar V. J. S., Rebolo R., Martín E. L., Mundt R., Bailer-Jones C. A. L., 2001, A&A, 377, L9
- Basri (2000) Basri G., 2000, ARA&A, 38, 485
- Beekman et al. (2000) Beekman G., Somers M., Naylor T., Hellier C., 2000, MNRAS, 318, 9
- Brown et al. (1994) Brown A. G. A., de Geus E. J., de Zeeuw P. T., 1994, A&A, 289, 101
- Burningham et al. (2003) Burningham B., Naylor T., Jeffries R. D., Devey C. R., 2003, MNRAS, 346, 1143
- Chabrier & Baraffe (1997) Chabrier G., Baraffe I., 1997, A&A, 327, 1039
- Delfosse et al. (1998) Delfosse X., Forveille T., Perrier C., Mayor M., 1998, A&A, 331, 581
- Dolan & Mathieu (2001) Dolan C. J., Mathieu R. D., 2001, AJ, 121, 2124
- Garmany et al. (1982) Garmany C. D., Conti P. S., Chiosi C., 1982, ApJ, 263, 777
- Gorlova et al. (2003) Gorlova N. I., Meyer M. R., Rieke G. H., Liebert J., 2003, ApJ, 593, 1074
- Hillenbrand (2003) Hillenbrand L. A., 2003, ArXiv Astrophysics e-prints
- Kenyon et al. (2004) Kenyon M., Jeffries R. D., Naylor T., Oliveira J. M., Maxted P. F. L., 2004, MNRAS accepted
- Kroupa (2001) Kroupa P., 2001, MNRAS, 322, 231
- Lada et al. (2000) Lada C. J., Muench A. A., Haisch K. E., Lada E. A., Alves J. F., Tollestrup E. V., Willner S. P., 2000, AJ, 120, 3162
- Lee (1968) Lee T. A., 1968, ApJ, 152, 913
- Lewis (1996) Lewis J. R., 1996, WYFFOS Data Reduction Manual. Royal Greenwich Observatory, Madingley Road, Cambridge CB3 0HJ
- Lucas & Roche (2000) Lucas P. W., Roche P. F., 2000, MNRAS, 314, 858
- Luhman et al. (2000) Luhman K. L., Rieke G. H., Young E. T., Cotera A. S., Chen H., Rieke M. J., Schneider G., Thompson R. I., 2000, ApJ, 540, 1016
- Martín et al. (2004) Martín E. L., Delfosse X., Guieu S., 2004, AJ, 127, 449
- Mohanty et al. (2004) Mohanty S., Basri G., Jayawardhana R., Allard F., Hauschildt P., Ardila D., 2004, ArXiv Astrophysics e-prints
- Moraux et al. (2003) Moraux E., Bouvier J., Stauffer J. R., Cuillandre J.-C., 2003, A&A, 400, 891
- Muench et al. (2002) Muench A. A., Lada E. A., Lada C. J., Alves J., 2002, ApJ, 573, 366
- Muzerolle et al. (2003) Muzerolle J., Hillenbrand L., Calvet N., Briceño C., Hartmann L., 2003, ApJ, 592, 266
- Perryman et al. (1997) Perryman M. A. C., Lindegren L., Kovalevsky J., Hoeg E., Bastian U., Bernacca P. L., Crézé M., Donati F., Grenon M., van Leeuwen F., van der Marel H., Mignard F., Murray C. A., Le Poole R. S., and 5 other authors 1997, A&A, 323, L49
- Reid et al. (1999) Reid I. N., Kirkpatrick J. D., Liebert J., Burrows A., Gizis J. E., Burgasser A., Dahn C. C., Monet D., Cutri R., Beichman C. A., Skrutskie M., 1999, ApJ, 521, 613
- Reid et al. (2002) Reid I. N., Kirkpatrick J. D., Liebert J., Gizis J. E., Dahn C. C., Monet D. G., 2002, AJ, 124, 519
- Schiavon et al. (1997) Schiavon R. P., Barbuy B., Rossi S. C. F., Milone A., 1997, ApJ, 479, 902
- Tinney & Reid (1998) Tinney C. G., Reid I. N., 1998, MNRAS, 301, 1031
- Warren & Hesser (1978) Warren W. H., Hesser J. E., 1978, ApJS, 36, 497
- Wilson (1953) Wilson R. E., 1953, Carnegie Institute Washington D.C. Publication, pp 0–+
- Wyse & Gilmore (1992) Wyse R. F. G., Gilmore G., 1992, MNRAS, 257, 1
- Zapatero Osorio et al. (2002) Zapatero Osorio M. R., Béjar V. J. S., Pavlenko Y., Rebolo R., Allende Prieto C., Martín E. L., García López R. J., 2002, A&A, 384, 937