The UV Galaxy Luminosity Function in the Local Universe from GALEX Data
Abstract
We present the results of a determination of the galaxy luminosity function at ultraviolet wavelengths at redshifts of from GALEX data. We determined the luminosity function in the GALEX FUV and NUV bands from a sample of galaxies with UV magnitudes between 17 and 20 that are drawn from a total of 56.73 deg2 of GALEX fields overlapping the -selected 2dF Galaxy Redshift Survey. The resulting luminosity functions are fainter than previous UV estimates and result in total UV luminosity densities of and at 1530Å and 2310Å, respectively. This corresponds to a local star formation rate density in agreement with previous estimates made with -selected data for reasonable assumptions about the UV extinction.
1 Introduction
In the past few years determinations of the star formation history of the universe have allowed us to begin to understand quantitatively when and how the stars in the universe were formed. Measurements of the rest-frame ultraviolet luminosities of galaxies have been particularly useful in this endeavor. In the very local universe, there is a relative lack of systematic surveys of galaxies in the UV. Before the launch of GALEX, the most comprehensive survey of galaxies in the local universe was from the FOCA experiment (Milliard et al., 1992), a balloon-borne telescope that made measurements in a single band centered at 2000Å. Based upon FOCA observations of a total of deg2, Treyer et al. (1998) and Sullivan et al. (2000) measured the first UV luminosity function (LF) for a sample of 273 galaxies with spectroscopic redshifts at . Their LF has a steep faint end slope and a total UV luminosity density, and corresponding star formation rate density, larger than most previous estimates. This higher local UV luminosity density in conjunction with measurements at larger distances lead Wilson et al. (2002) to infer a luminosity density evolution proportional to , a trend shallower than had been estimated previously from the CFRS sample (Lilly et al., 1996).
In this letter we present the first results regarding the UV LF based upon measurements from the Galaxy Evolution Explorer (GALEX) in conjunction with redshifts from the 2dF Galaxy Redshift Survey (2dFGRS) (Colless et al., 2001). The new GALEX data allow us to expand upon the previous FOCA results using a much larger sample drawn from an area of 56.73 deg2 although to a shallower limiting magnitude of . Throughout this paper, we assume , and .
2 Data
The data analyzed in this paper consist of 133 GALEX All-Sky Survey (AIS) pointings that overlap the 2dF Galaxy Redshift Survey in the South Galactic Pole region. The GALEX field-of-view is circular with diameter of and each pointing is imaged simultaneously in both the FUV and NUV bands with effective wavelengths of 1530Å and 2310Å, respectively. The median exposure time for the fields is 105 seconds, allowing us to reach a S/N ratio of for and . See Martin et al. (2004) and Morissey et al. (2004) for details regarding the GALEX instruments and mission.
Sources were detected and measured from the GALEX images using the program SExtractor (Bertin & Arnouts, 1996). As the NUV images are substantially deeper than the FUV, we used the NUV images for detection and measured the FUV flux in the same aperture as for the NUV. The fields analyzed here were processed using a larger SExtractor deblending parameter DEBLEND_MINCONT as the standard GALEX pipeline processing tends to break apart well-resolved galaxies into more than one source. We elected to use the MAG_AUTO magnitudes measured by SExtractor through an elliptical aperture whose semi-major axis is scaled to 2.5 times the first moment of the object’s radial profile, as first suggested by Kron (1980). All of the apparent magnitudes were corrected for foreground extinction using the Schlegel et al. (1998) reddening maps and assuming the extinction law of Cardelli et al. (1989). The ratio of the extinction in the GALEX bands to the reddening was calculated by averaging the extinction law over each GALEX bandpass, resulting in and . The median extinction correction for the galaxies in our South Galactic Pole sample is mag in both bands, with the corrections ranging from 0.1 to 0.3 mag.
The GALEX catalogs were matched with the 2dFGRS input catalog using a search radius of . To remove any overlap between adjacent pointings, we only included sources detected within the inner of each field. In addition, sources likely contaminated by artifacts from bright stars, with 2dF redshift quality flag less than three or with effective exposure times less than 60 sec were removed. Finally, we excluded GALEX sources in regions where the 2dF redshift completeness was less than 80%. After applying all of these cuts to each band, the total area on the sky of GALEX-2dF overlap is 56.73 deg2.
The GALEX resolution of (FWHM) (Morissey et al., 2004) is not sufficient to accurately separate stars and galaxies. Furthermore, the 2dFGRS input catalog available from the 2dFGRS web page111http://www.mso.anu.edu/2dFGRS/ only includes galaxies brighter than and does not include stars. In order to asses the total completeness of our 2dF-GALEX matched sample, we normalized our results to the total galaxy number counts determined by Xu et al. (2004) based primarily upon 22.64 deg2 of GALEX Medium Imaging Survey data overlapping the Sloan Digital Sky Survey (SDSS) Data Release 1 (Abazajian et al., 2003). As the SDSS data include stars and galaxies and reach fainter magnitudes, they result in a more accurate determination of the galaxy number counts in the UV. If we assume that the average galaxy number counts in the SDSS North Galactic Pole fields are the same as in the GALEX-2dF overlap, then the redshift completeness of the 2dF matched catalog is given by the number counts of galaxies with redshifts from 2dF divided by the total galaxy number counts from the SDSS overlap. This ratio is shown in Figure 1.
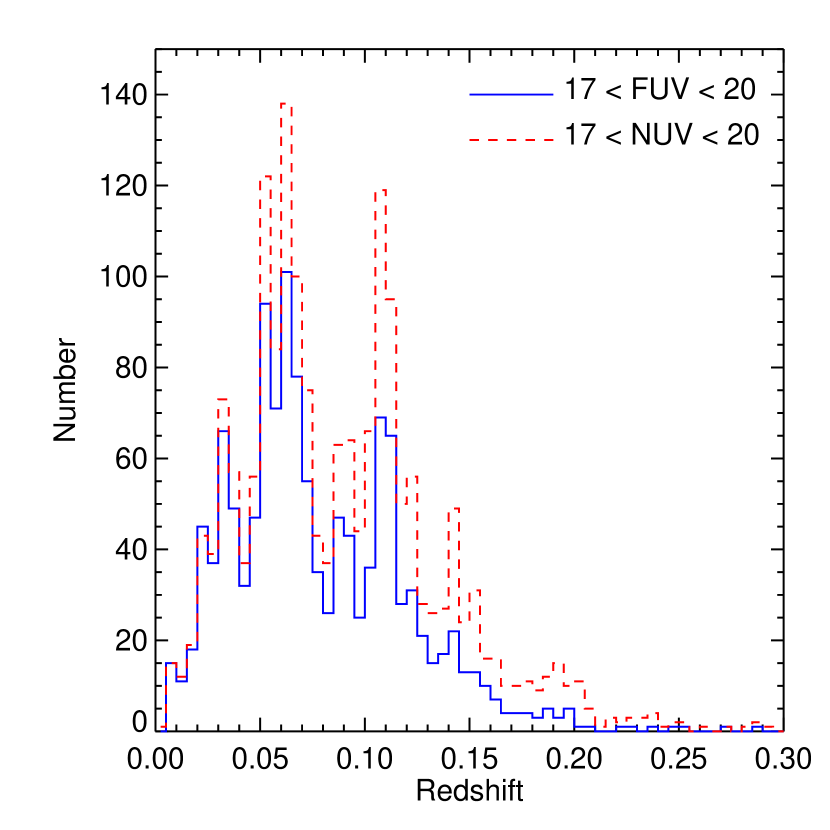
The completeness turns over at 20th mag because the redshift sample becomes incomplete for galaxies with blue or colors. We have limited our LF determination in each band to galaxies brighter than this limit. To avoid problems with photometry of large bright galaxies, we also imposed a bright magnitude limit of 17. The average completeness weighted by the number counts in the range mag is 92% in the FUV and 79% in the NUV. For objects with magnitudes brighter than 20.0 in either band, we visually inspected all of the 2dF spectra and removed a total of 27 objects with very broad emission lines indicating that the objects are most likely some sort of AGN. The redshift distributions for the FUV and NUV samples are shown in Figure 2.
We further restricted our sample to those galaxies with redshifts to insure that our sample is not sensitive to evolution. The average redshifts are 0.055 and 0.058 in the FUV and NUV, respectively. After applying all of the cuts mentioned in this section, a total of 896 galaxies in the FUV and 1124 galaxies in the NUV remained. The luminosity functions for the objects with are presented in Treyer et al. (2004).

3 Luminosity Functions
Using the FUV, NUV and magnitudes, we assigned a best-fit spectral type to each galaxy using a representative subset of the SEDs from Bruzual & Charlot (2003) and determined the K-correction needed to transform the observed UV magnitudes to rest-frame measurements at . The K-corrections are in general quite small ().
We determined the LF and its error in each band using the method (Felten, 1976):
| (1) |
| (2) |
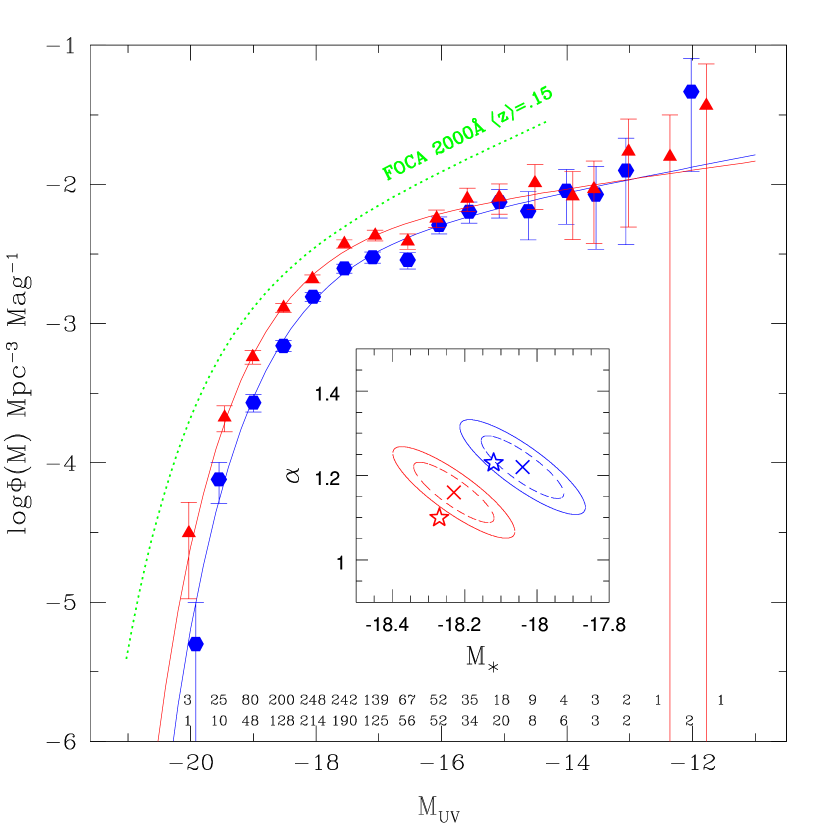
where is the inverse of the redshift completeness as estimated in §2 above and is the maximum co-moving volume within which each galaxy could have been observed given the bright and faint limiting magnitudes of our sample and its best-fit SED. The resulting LFs are shown in Figure 3.
By minimizing , we fit the LF points in each band with a Schechter function (Schechter, 1976): where , and were free parameters. The best fit parameters and their errors, calculated using the range of solutions within 1.0 of the minimum , are listed in Table 1 along with the best-fit LF from Sullivan et al. (2000) converted to the AB magnitude system and to . The errors in and are highly correlated and the inset of Figure 3 shows the error contours projected into the plane. Since the method can be biased in the presence of clustering, we also computed the best-fit Schechter parameters using the maximum likelihood STY method (Sandage et al., 1979). The resulting STY values are listed in Table 1 and are also plotted in the inset of Figure 3. The STY values lie just inside and outside of the error ellipses in the FUV and NUV, respectively. We adopt the results in the discussion below.
| method | STY method | |||||||
|---|---|---|---|---|---|---|---|---|
| band | (Mpc-3) | (ergs s-1 Hz-1 Mpc-3) | ||||||
| FUV | ||||||||
| NUV | ||||||||
| FOCA | 0.15 | |||||||
4 Discussion
As can be seen in Figure 3, there are significant differences between the results presented here and those from Sullivan et al. (2000). The GALEX results have a fainter in both bands and have a shallower faint end slope. The FOCA passband is centered at 2015Å with FWHM of 188Å and thus one would expect the FOCA results to lie in between the GALEX FUV and NUV data. However, the FOCA sample is truly an UV-selected sample while that presented here relies upon the -selected 2dFGRS. This selection could introduce a bias in our results if the galaxies for which we do not have redshifts have a different redshift distribution than the galaxies which are included in our sample. On the other hand, it is now well established that the UV luminosity density increases with redshift (e.g. Somerville et al., 2001) and part of the difference is likely a real effect (Treyer et al., 2004). However, the difference of mag between the FOCA and NUV values for would require evolution much larger than determined from other surveys as well as GALEX data at higher redshifts (Arnouts et al., 2004; Schiminovich et al., 2004). A preliminary comparison of the GALEX and FOCA photometry in a couple of overlapping fields indicates that the FOCA magnitudes are on average brighter with the difference becoming larger for fainter sources. It appears likely these offsets and non-linearities in the FOCA photometry account for a major part of the difference between the FOCA and GALEX LFs with the remainder likely due to a combination of galaxy evolution and the FOCA sample selection.
In Table 1 we also list the total luminosity density calculated from the best-fit Schechter parameters as . The statistical errors in that take into account the covariance between the three Schechter function parameters are 0.02 in each band. In addition to this error, the uncertainty in the GALEX photometric zeropoint is in both bands, corresponding to an uncertainty in of 0.04. A potentially larger source of error is that due to large scale structure. The variation in the number density of galaxies in a contiguous volume is given approximately by (Davis & Huchra, 1982) where is an integral over the galaxy 2-point correlation function and has a value of for a correlation function of the form with and (Hawkins et al., 2003). The galaxy number counts from Xu et al. (2004) used to set the normalization of our LFs were derived from approximately 22.64 deg2. For , the corresponding rms variation in the number density would be , or an uncertainty in . Since UV-selected, star-forming galaxies are likely less clustered than optically-selected samples, this value is really an upper limit. Adding these uncertainties due to large scale structure and calibration in quadrature to the statistical errors results in a total uncertainty of in both bands.
The spectral slope , defined as with in units of , corresponding to our two luminosity density measurements is . This is slightly bluer than the slope of determined by Cowie et al. (1999) at from measurements at longer rest frame wavelengths spanning to .
The FUV luminosity density can be used to estimate the star formation rate (SFR) density in the local universe. For a constant star formation history and a Salpeter IMF, the SFR is related to the UV luminosity (in the range ) by (Kennicutt, 1998). For the FUV luminosity density in Table 1, we obtain with no extinction correction. For comparison, the extinction-corrected LF at from Gallego et al. (1995) shifted to our assumed Hubble constant corresponds to using the to SFR conversion from Kennicutt (1998). Based upon imaging of a subsample of the galaxies used by Gallego et al. (1995), Pérez-González et al. (2003) argued that the local luminosity density is higher due to uncertainties in the aperture corrections applied to the spectroscopic data and corresponds to . Bringing the FUV SFR into agreement with this result would require an extinction of .
An average extinction of is consistent with a simple estimate made using the observed colors. While there is a well-defined relationship between the UV extinction and the spectral slope for starburst galaxies, more quiescent galaxies tend to have less extinction for a given UV slope than would be inferred from nearby starbursts (Bell, 2002). In particular Kong et al. (2004) used the population synthesis models of Bruzual & Charlot (2003) along with the prescription described in Charlot & Fall (2000) for determining how starlight is absorbed by dust in galaxies to show that the smaller extinction in non-starburst galaxies can be explained by variations in the galaxies’ star formation histories. Based upon a set of Monte Carlo realizations of these models spanning a range of extinctions, ages and star formation histories, Kong et al. (2004) were able to approximate the dependence of the FUV extinction on the UV spectral slope with the following formula: where the variable parametrizes the star formation history and is defined as the ratio of current to the past average star formation rate. Assuming a constant star formation history (), an extinction of is obtained for a spectral slope , a value consistent with that measured from the FUV and NUV luminosity densities. On the other hand, the average color of our FUV-selected sample is 0.14, corresponding to a spectral slope of . For this and , the Kong et al. (2004) formula results in mag. This extinction is similar to the results of Buat et al. (2004) who found that the average extinction for a local NUV-selected sample is mag based upon the FIR to UV flux ratio. If an extinction of is more appropriate for the UV-selected sample presented here, then the UV-based star formation rate density would be , a value lower than that from although still consistent to within the errors. In reality the extinction is likely a function of absolute magnitude and future GALEX papers will address in more detail correcting UV fluxes for extinction in a more rigorous way.
In the near future we will continue our investigation of the UV luminosity function in the local universe using GALEX AIS data covering of the SDSS. In addition to expanding our sample to include more galaxies, we will use the SDSS photometry and spectroscopy to explore the dependence of UV luminosity on other galaxy characteristics, such as color, surface brightness, environment, metallicity and stellar mass.
References
- Abazajian et al. (2003) Abazajian, K. et al. 2003, AJ, 126, 2081
- Arnouts et al. (2004) Arnouts, S., et al. 2004, this volume
- Bell (2002) Bell, E. F. 2002, ApJ, 577, 150
- Bertin & Arnouts (1996) Bertin, E., & Arnouts, S. 1996, A&AS, 117, 393
- Bruzual & Charlot (2003) Bruzual, G., & Charlot, S. 2003, MNRAS, 344, 1000
- Buat et al. (2004) Buat, V., et al. 2004, ApJ, this volume
- Cardelli et al. (1989) Cardelli, J. A., Clayton, G. C., & Mathis, J. S. 1989, ApJ, 345, 245
- Charlot & Fall (2000) Charlot, S., & Fall, S. M. 2000, ApJ, 539, 718
- Colless et al. (2001) Colless, M., et al. 2001, MNRAS, 328, 1039
- Cowie et al. (1999) Cowie, L. L., Songaila, A., & Barger, A. J. 1999, AJ, 118, 603
- Davis & Huchra (1982) Davis, M., & Huchra, J. 1982, ApJ, 254, 437
- Felten (1976) Felten, J. E. 1976, ApJ, 207, 700
- Gallego et al. (1995) Gallego, J., Zamorano, J., Aragón-Salamanca, & Rego, M. 1995, ApJ, 455, L1
- Hawkins et al. (2003) Hawkins, E., et al. 2003, MNRAS, 346, 78
- Kennicutt (1998) Kennicutt, R. C. 1998, ARA&A, 36, 189
- Kong et al. (2004) Kong, X., Charlot, S., Brinchman, J., & Fall, S. M. 2004, MNRAS, 349, 769
- Kron (1980) Kron, R. G. 1980, ApJS, 43, 305
- Lilly et al. (1996) Lilly, S. J., Le Fèvre, O., Hammer, F., & Crampton, D. 1996, ApJ, 460, L1
- Martin et al. (2004) Martin, C. et al. 2004, ApJ, this volume
- Milliard et al. (1992) Milliard, B., Donas, J., Laget, M., Armand, C. & Vuillemin, A., 1992, A&A, 257, 24
- Morissey et al. (2004) Morissey, P. et al. 2004, ApJ, this volume
- Pérez-González et al. (2003) Pérez-González, P. G., Zamorano, J., Gallego, J., Aragón-Salamanca, A., & Gil de Paz, A. 2003, ApJ, 591, 827
- Sandage et al. (1979) Sandage, A., Tammann, G. A., & Yahil, A. 1979, ApJ, 232, 352
- Schechter (1976) Schechter, P. 1976, ApJ, 203, 297
- Schiminovich et al. (2004) Schiminovich, D., et al. 2004, this volume
- Schlegel et al. (1998) Schlegel, D. J., Finkbeiner, D. P., & David, M. 1998, ApJ, 500, 525
- Somerville et al. (2001) Somerville, R. S., Primack, J. R., & Faber, S. M. 2001, MNRAS, 320, 504
- Sullivan et al. (2000) Sullivan, M., Treyer, M. A., Ellis, R. S., Bridges, T. J. Milliard, B., & Donas, José 2000, MNRAS, 312, 442
- Treyer et al. (1998) Treyer, M. A., Ellis, R. S., Milliard, B., Donas, J., Bridges, T. J. 1998, MNRAS, 300, 303
- Treyer et al. (2004) Treyer, M. A., et al. 2004, this volume
- Wilson et al. (2002) Wilson, G., Cowie, L. L., Barger, A. J., & Burke, D. J. 2002, AJ, 124, 1258
- Xu et al. (2004) Xu, C. K. et al. 2004, ApJ, this volume