Abstract
We study the properties of galaxies at redshift in a cold dark matter (CDM) universe, using two different types of hydrodynamic simulation methods – Eulerian TVD and smoothed particle hydrodynamics (SPH) – and a spectrophotometric analysis in the filter set. The simulated galaxies at satisfy the color-selection criteria proposed by Adelberger et al. (2004) and Steidel et al. (2004) when we assume Calzetti extinction with . We find that the number density of simulated galaxies brighter than at is about for , which is roughly twice that of the number density found by Erb et al. (2004) for the ultraviolet (UV) bright sample. This suggests that roughly half of the massive galaxies with at are UV bright population, and the other half is bright in the infra-red (IR) wavelengths. The most massive galaxies at have stellar masses . They typically have been continuously forming stars with a rate exceeding over a few Gyrs from to , together with significant contribution by starbursts reaching up to which lie on top of the continuous component. TVD simulations indicate a more sporadic star formation history than the SPH simulations. Our results do not imply that hierarchical galaxy formation fails to account for the observed massive galaxies at . The global star formation rate density in our simulations peaks at , a much higher redshift than predicted by the semianalytic models. This star formation history suggests early build-up of the stellar mass density, and predicts that 70 (50, 30)% of the total stellar mass at had already been formed by (2, 3). Upcoming observations by Spitzer and Swift might help to better constrain the star formation history at high redshift.
[Massive galaxies at ]
Massive galaxies at redshift 2 in
cosmological hydrodynamic simulations
1 Introduction
A number of recent observational studies have revealed a new population of red, massive galaxies at redshift (e.g. Chen et al. 2003; Daddi et al. 2004; Franx et al. 2003; Glazebrook et al. 2004; McCarthy et al. 2004; van Dokkum et al. 2004), utilizing near-IR wavelengths which are less affected by dust extinction. At the same time, some studies focused on the assembly of stellar mass density at high redshift by comparing the observational data and semi-analytic models of galaxy formation (e.g. Dickinson et al. 2003; Fontana et al. 2003; Poli et al. 2003). These works have suggested that the hierarchical structure formation theory may have difficulty in accounting for sufficient early star formation. The concern grew with the mounting evidence for high redshift galaxy formation including the discovery of Extremely Red Objects (EROs) at , sub-millimeter galaxies at , Lyman break galaxies (LBGs) at , and Lyman- emitters at . We now face the important question as to whether this evidence for high-redshift galaxy formation is consistent with the concordance CDM model. See Nagamine et al. (2004a,b) for the details of the simulations and the present work.
2 Results
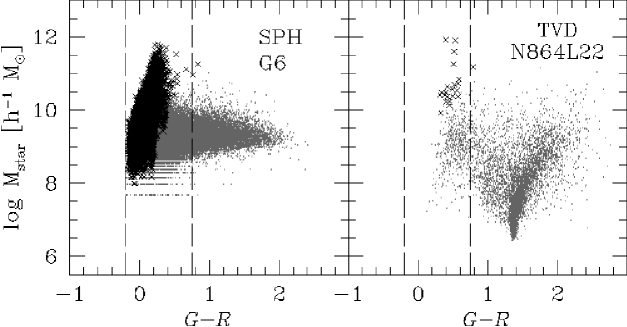
Figure 1 shows the stellar mass vs. G-R color of the simulated galaxies at . The most massive galaxies have stellar masses , and UV colors , consistent with the UV color selection criteria of Steidel et al. (2004). The differences in the distribution of the points can be understood in terms of the different box sizes and the randomness of the initial condition of the simulations. On the right-hand-side of the panels, there are a couple of red, passive systems that have stellar masses . The near-IR properties of these passive systems will be reported in future papers. Figure 2 shows the star formation histories of the most massive and most reddest galaxies in the simulations. For the most massive systems, the star formation rate has a continuous component of over a few Gyrs, and a starburst component exists on top of the continuous component that reaches up to . Such extreme star formation histories allow these galaxies to build up stellar masses larger than a few by . The TVD simulation indicates somewhat more sporadic star formation history, which is perhaps due to the differences in the details of the star formation recipe and the resolution.
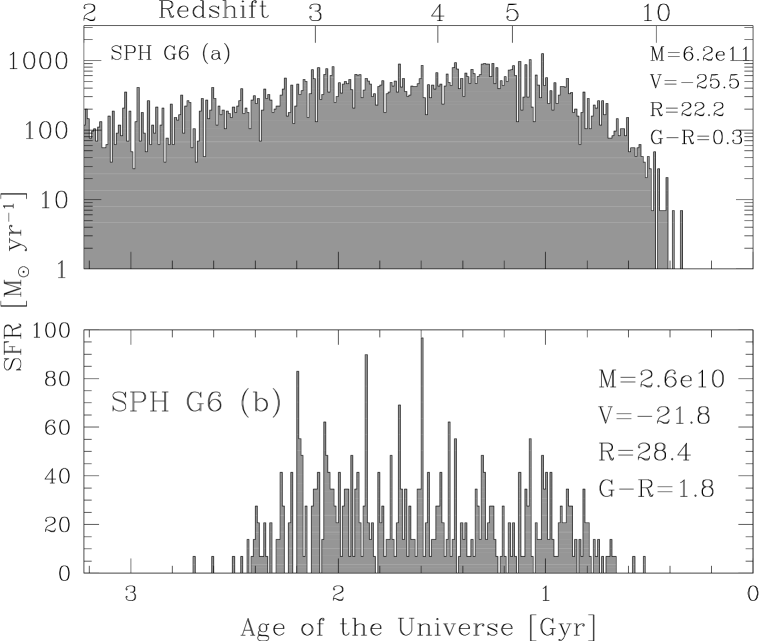
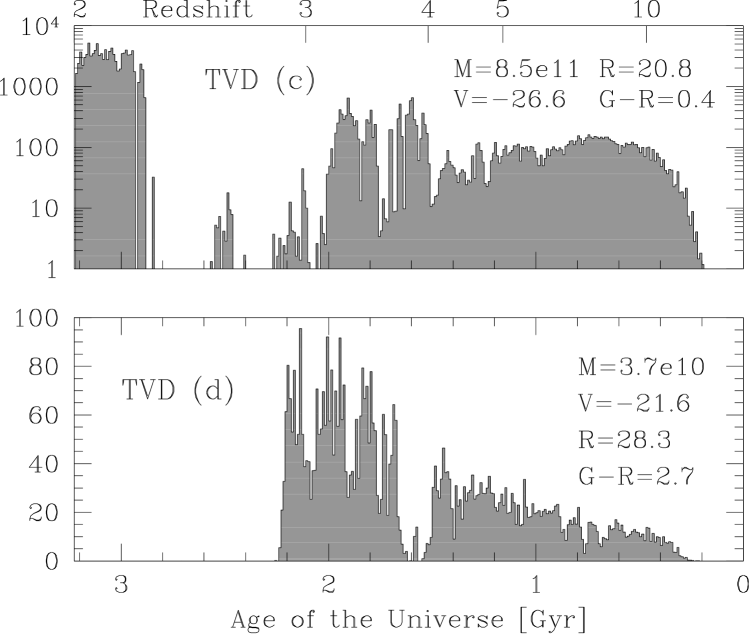
Figure 3 shows the star formation history of the entire simulation box. In panel (a), all the models including the analytic model of Hernquist & Springel (2003) show that the SFR density peaks at . These SFR histories lead to early build-up of the stellar mass density compared to both the current observational estimates and the results of the semianalytic models (see Nagamine et al. 2004b for a direct comparison), and we predict that 70 (50, 30)% of the total stellar mass at had already been formed by (2, 3) based on these theoretical models.
In summary, we have shown that the simulations based on the hierarchical CDM model can in fact account for the masses and the comoving number densities of the massive galaxies at that are found by the recent observations. Our simulations indicate that the properties (i.e. stellar mass, color, SF history, clustering) of the UV bright LBGs at can be understood if they are identified with the galaxies that reside in the massive dark matter halos at the time.


Acknowledgements.
This work was supported by NSF grants ACI 96-19019, AST 00-71019, AST 02-06299, and AST 03-07690, and NASA ATP grants NAG5-12140, NAG5-13292, and NAG5-13381.References
- [] Adelberger K.L., Steidel C.C., Shapley A.E., Hunt M.P., et al. 2004, ApJ, 607, 226
- [] Chen H.-W., Marzke R., McCarthy P.J., Martini P., et al., 2003, ApJ, 586, 745
- [] Daddi E., Cimatti A., Renzini A., Vernet J., Conselice C., et al., 2004, ApJ, 600, L127
- [] Dickinson M., Papovich C., Ferguson H., Budavári T., 2003, ApJ, 587, 25
- [] Erb D., et al. 2004, article in this conference proceedings
- [] Fontana A., Donnarumma I., Vanzella E., Giallongo E., et al., 2003, ApJ, 594, L9
- [] Franx M., Labbe I., Rudnick G., van Dokkum P.G., et al., 2003, ApJ, 587, L79
- [] Glazebrook K., Abraham R., McCarthy P., Savaglio S., et al. 2004, Nature, 430, 181
- [] Hernquist L., Springel V., 2003, MNRAS, 2003, 341, 1253
- [] McCarthy P.J., Le Borgne D., Crampton D., Chen H.-W., et al., 2004, ApJ, 614, L9
- [] Nagamine K., Cen R., Hernquist L, Ostriker J.P., Springel V., 2004a, ApJ, 610, 45
- [] Nagamine K., Cen R., Hernquist L, Ostriker J.P., et al., 2004b, ApJ, in press (astro-ph/0406032)
- [] Poli F., Giallongo E., Fontana A., Menci N., Zamorani G., et al., 2003, ApJ, 593, L1
- [] Steidel C.C., Shapley A.E., Pettini M., Adelberger K.L., et al., 2004, ApJ, 607, 226
- [] van Dokkum P., Franx M., Schreiber N.F., Illingworth G., et al., 2004, 611, 703