Dust attenuation in the nearby universe:
comparison between galaxies selected
in the ultraviolet
or
in the far-infrared
Abstract
We compare the dust attenuation properties of two samples of galaxies purely selected in the near-ultraviolet (NUV) band (1750-2750 ) and in the far-infrared (FIR) at 60 m . These samples are built using the GALEX and IRAS sky surveys over 600 square degrees. The NUV selected sample contains 95 galaxies detected down to mag (AB system). 83 galaxies in this sample are spirals or irregulars and only two of them are not detected at 60 m. The FIR selected sample is built from the IRAS PSCz catalog complete down to 0.6 Jy. Among the 163 sources, we select 118 star forming galaxies well measured by IRAS, all but 1 are detected in NUV and 14 galaxies are not detected in the far-ultraviolet (FUV) band (1350-1750 ). The dust to ultraviolet (NUV and FUV) flux ratio is calibrated to estimate the dust attenuation at both wavelengths. The median value of the attenuation in NUV is found to be mag for the NUV selected sample versus mag for the FIR selected one. Within both samples, the dust attenuation is found to correlate with the luminosity of the galaxies. Almost all the NUV selected galaxies and 2/3 of the FIR selected sample exhibit a lower dust attenuation than that expected from the tight relation found previously for starburst galaxies between the dust attenuation and the slope of the ultraviolet continuum. The situation is inverse for one third of the FIR selected galaxies: their extinction is higher than that deduced from their FUV-NUV color and the relation valid for starbursts.
1 Introduction
To quantify the star formation activity in the Universe, from low to high redshift or in individual galaxies we need an estimate as accurate as possible of the recent star formation rate in galaxies. Among various potential estimators, the far-infrared and ultraviolet luminosities are commonly used. Both emissions are expected to come from young stars (e.g. Kennicutt 1998 and references therein). The ultraviolet light is emitted by young stars and is theoretically directly connected to the recent star formation rate. However, the use of the ultraviolet emission to trace the star formation is largely hampered by the presence of the dust which absorbs and scatters the UV light; the far-infrared emission is not affected by this limitation. In fact the ultraviolet and FIR emissions are complementary: the ultraviolet light lost because of the dust absorption is re-emitted in FIR by the dust. This energy budget has been used to derive a measure of the dust attenuation (Xu & Buat, 1995; Meurer, Heckman, & Calzetti, 1999; Gordon et al., 2000). This attenuation is known to be very large in some objects and even if it remains modest in average in the nearby universe (Xu & Buat, 1995) it is crucial to correct the observed ultraviolet flux before any quantitative interpretation.
In this paper we consider a galaxy sample selected in the NUV for which most of the galaxies have been observed in FIR. Because of its selection, this sample will be directly comparable to optically (ultraviolet rest-frame) selected samples at higher redshift. We will derive the dust attenuation from the comparison between the far-infrared and the ultraviolet emissions and discuss variations of this attenuation with luminosity and FUV-NUV color of the galaxies. For comparison, we will also build a FIR selected sample of galaxies, most of these galaxies being detected in NUV. We will perform the same analysis as for the NUV selected sample
A similar pioneering work was already performed over only 35 deg2 and in a single ultraviolet wavelength (Iglesias-Páramo et al., 2004). Complementary approachs may consist in exploring variations of the FIR/UV ratio within single nearby galaxies (Boissier et al., Popescu et al. this volume)
2 The samples
Here, we briefly discuss how we select our samples.
Galaxy distances are calculated from their redshift measurements taken from
the NASA/IPAC Extragalactic Database
(NED), HyperLeda (http://leda.univ-lyon1.fr) and the IRAS PSCz (Saunders et al., 2000)
and assuming . For very
nearby galaxies (4 sources) their distances were found in the literature.
All magnitudes are expressed in the AB system.
Our NUV selected sample, down to mag, is built from the first observations of the GALEX All Imaging Survey (AIS). See Martin et al. and Morissey et al. (this volume) for details regarding the GALEX instrument and mission. We select only the frames with exposure times larger than or equal to 50 sec: the resulting field covers 615 deg2. We perform photometry using the IR0.2 calibration and apply a zero point offset of +0.039 mag in FUV and -0.099 mag in NUV. We mask bright stars and galaxies lying close to our targets. For each target, the sky background is measured by combining several individual nearby sky regions. NUV fluxes are extracted using elliptical apertures enclosing the total fluxes. FUV magnitudes are measured within the same aperture.
NUV and FUV fluxes are first corrected for Galactic extinction using the Schlegel et al. (1998) dust map and the Cardelli et al. (1989) extinction curve. A total of 95 sources brighter than mag are then selected. We exclude objects whose ultraviolet flux can be contaminated by other sources than young stars i.e. early type (2 ellipticals) and active galaxies (2 Seyfert 1, 2 Seyfert 2 and 1 QSO). Most of the remaining 88 sources are late-type spirals.
We search for a detection at 60 m for all the 88 sources using the IRAS
FSC (Moshir et al., 2000) and the Scan Processing and Integration Facility (SCANPI). 4
galaxies were not observed by IRAS. All other
sources but 3 are detected at 60 m.
For the 3 non detections, we adopt
a conservative upper limit of 0.2 Jy at 60m.
Among the 81 galaxies with an IRAS detection, 22 are contaminated by cirrus
or have close neighbours not resolved by IRAS.
We discard these measures from the quantitative
analysis of the FIR emission.
We are thus left with 59 sources with a NUV and a flux at 60 m and 3 NUV
sources
with only an upper limit at 60 m.
To construct the FIR selected sample, we start with the IRAS PSCz catalog (Saunders et al., 2000) which is complete down to 0.6 Jy at 60 m; we take advantage of the optical identification of the IRAS sources to search for a NUV detection. We select 163 IRAS sources over 509 deg2 detected at 60 m with a reliability larger than 50% and not contaminated by cirrus. 144 targets also have a flux at 100 m and the remaining have only upper limits. Among these 163 galaxies, 97 have a morphological type in NED or LEDA. We discard 4 ellipticals or lenticulars, 3 Seyfert 1 and 5 Seyfert 2 and 33 galaxies which have close neighbours not resolved by IRAS. We are thus left with 118 galaxies. NUV and FUV photometries are performed following the same prescriptions as for the NUV selected sample.
All but 1 galaxy are detected in NUV (S/N ratio larger than 3). 14 galaxies are not detected in FUV. For the non detections in NUV and/or FUV upper limits are estimated corresponding to a S/N ratio of 3.
3 The dust attenuation at ultraviolet wavelengths
3.1 Modeling
It was shown previously (Buat & Xu, 1996; Meurer, Heckman, & Calzetti, 1999; Gordon et al., 2000) that for ultraviolet measurements up to 2000 the dust to ultraviolet flux ratio is a robust tracer of dust attenuation in star forming galaxies regardless of the details of the extinction mechanisms (dust/star geometry, dust properties). Hereafter refers to the total dust emission and and are defined for each GALEX band as where is expressed in .
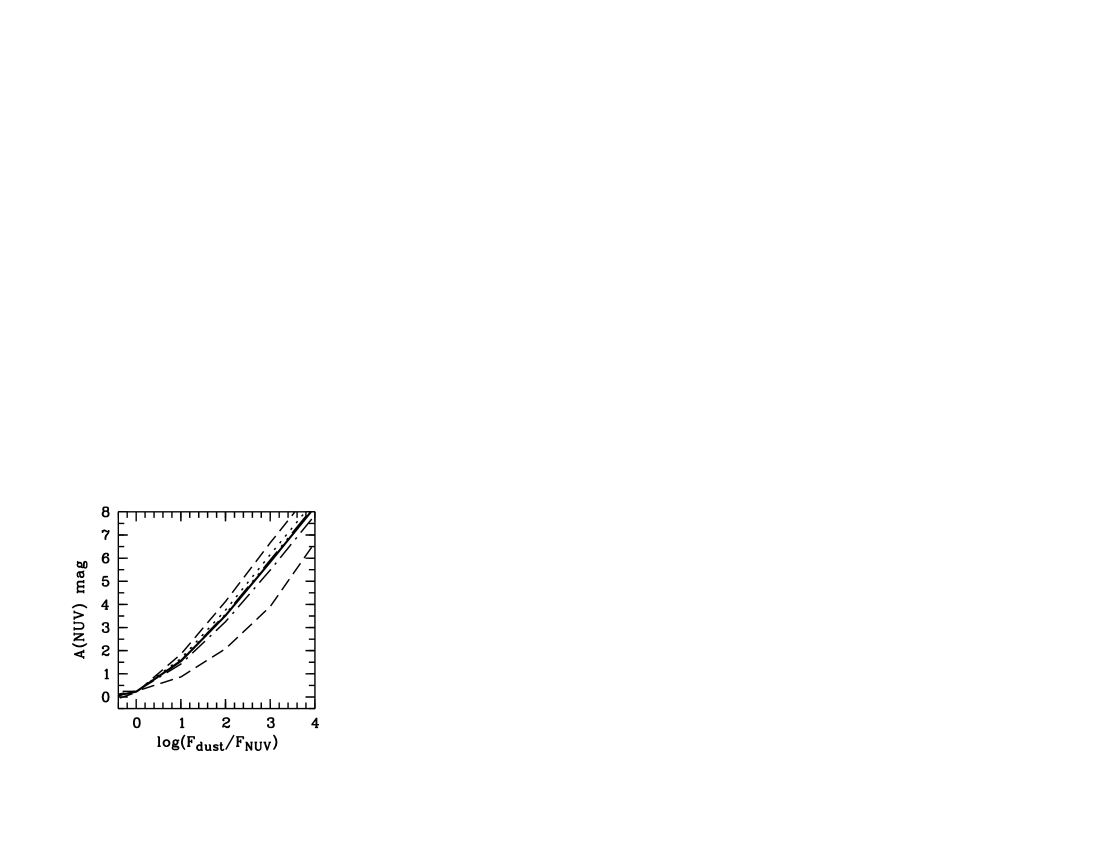
Since the NUV band of GALEX lies at longer wavelengths than 2000 , we must test the reliability of the ratio to estimate the dust attenuation for various scenarii of star formation. At this aim, we use the population synthesis code PEGASE (Fioc & Rocca-Volmerange, 1997) under different hytotheses of star formation rate (SFR) (Figure 1). The amount of dust emission is obtained by adding all the stellar emission absorbed by the dust. We try different configurations for the dust attenuation: the screen-like Calzetti’s attenuation law (Calzetti et al., 2000), a homogeneous mixture of dust and stars in a slab geometry with a Galactic or a LMC stellar extinction law (Buat & Xu, 1996) or a clumpy medium (Calzetti et al., 1994). We also include the time dependent scenario proposed by Charlot & Fall (2000). Within this frame, we develop another bi-variate model in which the attenuation of the light from stars younger than years follows the Calzetti’s law whereas older stars are supposed to be homogeneously mixed with the dust or to be distributed in a clumpy medium. All these models give very similar results for a given star formation history with a dispersion lower than 5 . In particular the exact form of the extinction curve (with or without a 2175 bump) does not affect the results. Each curve plotted in Figure 1 is the average over all these scenarii for a specific star formation rate. Similar plots are found with the FUV flux instead of the NUV one. Only the exponential decrease of the SFR with = 2 Gyr leads to a much lower attenuation for a given dust to NUV flux ratio: the dust heating by old stars becomes important and only a fraction of the dust emission is related to the ultraviolet absorption. Such a steep decrease of the SFR is typical of elliptical or lenticular galaxies (Gavazzi et al., 2002). All the other scenarii of star formation lead to a relative error lower than 20%. The calibration holds for both GALEX bands and the will be used to estimate the dust attenuation since more galaxies are detected in NUV than in FUV.
We perform polynomial fits on our models excluding the curves with 2 Gyr since the FIR and the NUV selections focus on active star forming galaxies and we exclude ellipticals and lenticulars from the study.
| (1) |
where and
| (2) |
where . These fits are fully consistent with the mean relations between the dust attenuation and the dust to ultraviolet flux ratio for both GALEX bands proposed by Kong et al. (2004) and Charlot & Brinchmann (private communication) for similar star formation histories.
3.2 The amount of dust attenuation
Before estimating the attenuations with the above formulae, we need to estimate the total dust emission. For the galaxies observed at 60 and 100 m we calculate this total dust emission following Dale et al. (2001). 3 galaxies from the NUV selected sample were not detected at 100 m: we use the mean value of the ratio found for the sample galaxies detected at both wavelengths to estimate their flux at 100 . The mean bolometric corrections are equal to and for the NUV and FIR selected sample respectively (the FIR flux is defined between 40 and 120 m (Helou et al., 1988)). These values are intermediate between the values found for starbursts and cirrus dominated galaxies (Calzetti et al., 2000; Rowan-Robinson, 2003).
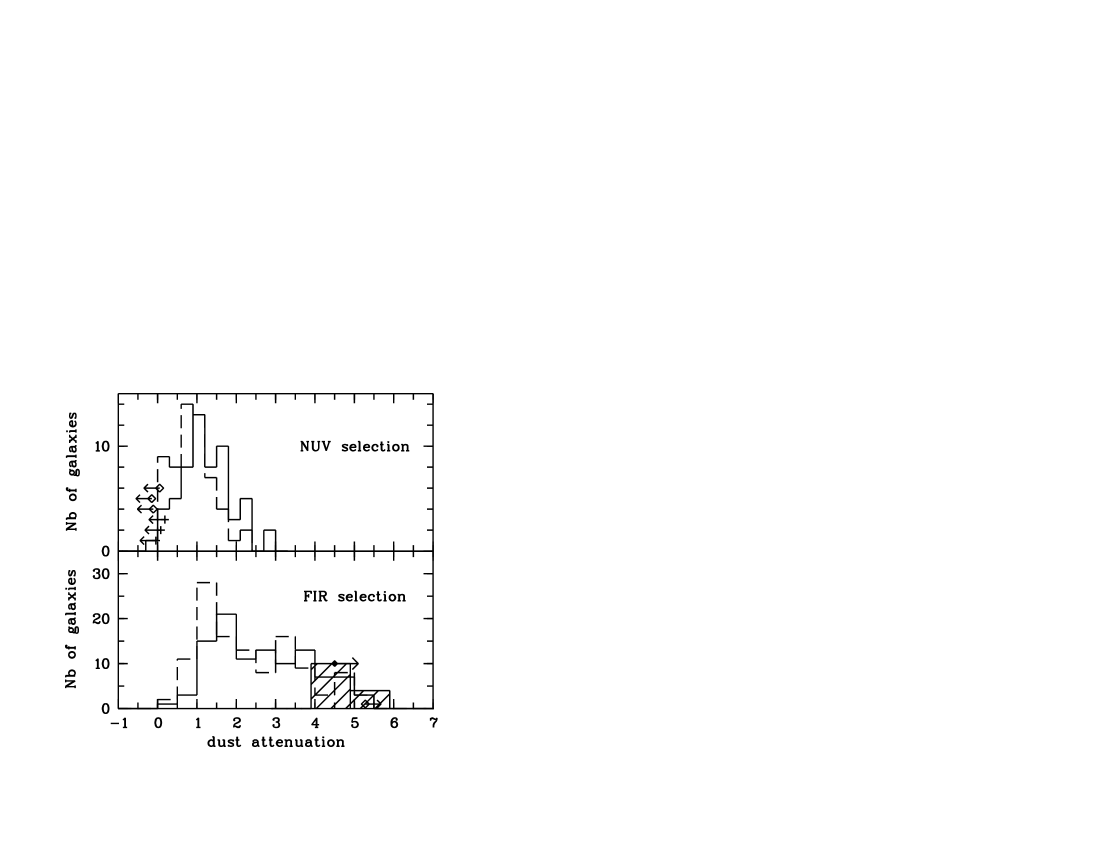
In the NUV selected sample, the median values of the dust attenuation in GALEX bands are found to be mag in NUV and and mag in FUV.
In the FIR selected sample, the median values of the dust attenuation are found larger: mag in NUV and mag in FUV. The galaxies not detected in FUV have a dust attenuation larger than mag in agreement with the large attenuations (4 mag) found in NUV. The histograms of the attenuations are given in Figure 2.
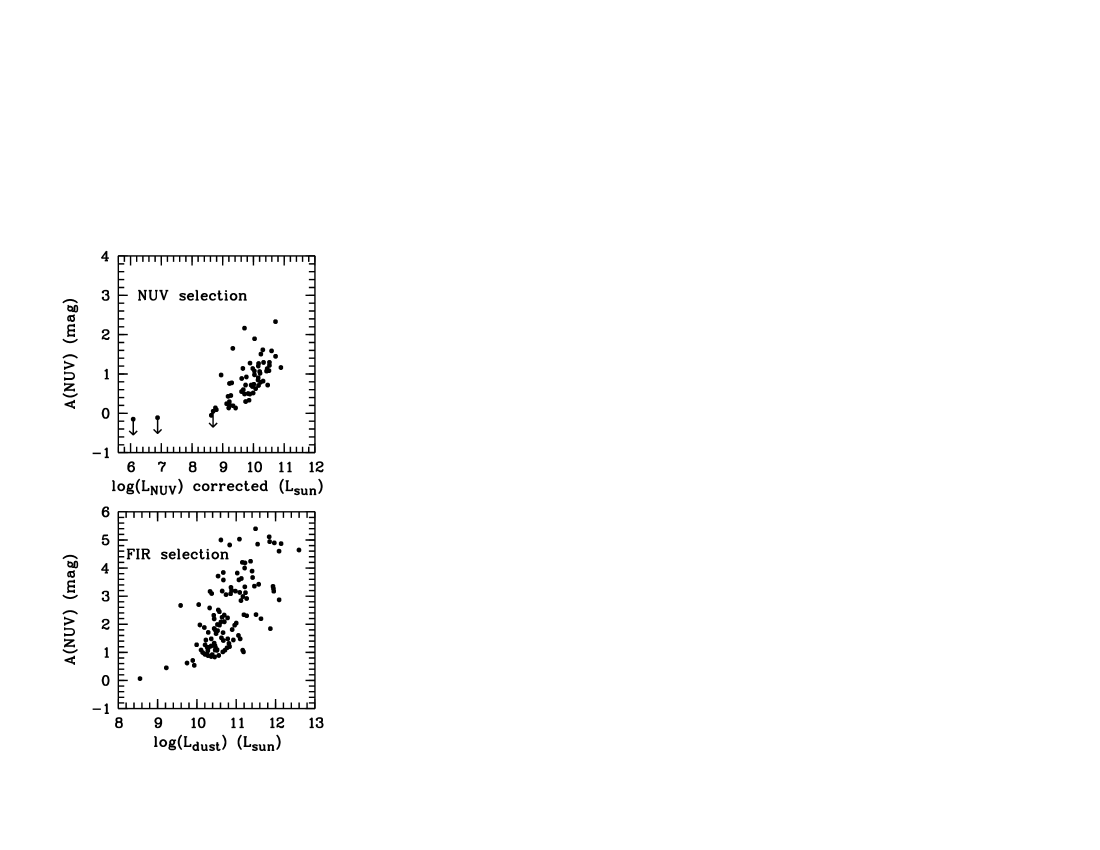
In Figure 3, the dust attenuation in the NUV band is compared to the intrinsic luminosity of the galaxies expected to be the best measurement of the recent star formation rate: the NUV luminosity corrected for the extinction for the NUV selected sample (left panel) and the dust luminosity for the FIR selected sample (right panel). In both cases the dust attenuation is found to increase with the luminosity. This result is consistent with findings of an increase of the dust attenuation with the star formation rate in nearby galaxies (Wang & Heckman, 1996; Hopkins et al., 2001). Vijh et al. (2003) proposed a law between the extinction and the luminosity at 1600 for bright Lyman break galaxies at : the extrapolation of this law to fainter objects predicts lower attenuations than those found for our NUV selected sample. This effect might be attributed to some evolution of the dust attenuation with redshift.
3.3 The mean dust attenuation in the local Universe
We can compare the dust attenuation found in our samples to the mean dust attenuation estimated from the FIR and NUV (or FUV) luminosity densities (e.g. Buat et al. 1999). At this aim we calculate the ratio of the FIR and NUV (FUV) luminosity densities and translate it to a mean dust attenuation. The FIR density is taken from Saunders et al. (1990): with h=0.7. The NUV and FUV luminosity density are derived from the new GALEX data (Wyder et al., this volume): and . Adopting we obtain which translates to dust attenuations of 1.1 mag and 1.6 mag in NUV and FUV respectively. These mean values are intermediate between those found with our FIR and NUV selection although closer to the dust attenuation found for the NUV selected galaxies. Therefore, as far as the dust attenuation is concerned, a NUV selection seems to be more representative of the mean galaxy properties in the local universe than a FIR selection.
3.4 FUV-NUV color and dust attenuation
Bell (2002) and more recently Kong et al. (2004) showed that the slope of the UV continuum (which can be traced by the FUV-NUV color) is not a reliable tracer of the dust attenuation in galaxies which are not experiencing a strong starburst. In Figure 4 is plotted the FUV-NUV color against the dust to FUV flux ratio for the NUV selected and the FIR selected galaxies. We keep only galaxies brighter than 20 mag in NUV and FUV in order to have a photometric error in each band lower than or equal to 0.15 mag. Almost all the NUV selected galaxies and a large fraction of the FIR selected ones lie below the curve followed by starburst galaxies (Meurer, Heckman, & Calzetti, 1999; Kong et al., 2004): they exhibit a lower (i.e. a lower attenuation) than starbursts for a given FUV-NUV color, as already found for non starbursting galaxies. Kong et al. (2004) explain this behavior by a variation of the ratio of present to past average star formation rate: our data are roughly consistent with a ratio varying from 1 to 0.1. About 1/3 of the FIR selected galaxies lie above the curve valid for starburst galaxies: their dust attenuation is larger than that expected from the FUV-NUV color. This trend is similar to that for Ultra-Luminous Infrared Galaxies (Goldader et al., 2002) although the dust attenuations found here are not as large as for the ULIRGs. The FUV-NUV color seems therefore unable to trace the dust attenuation in these galaxies.
References
- Bell (2002) Bell, E. 2002 ApJ, 577, 150
- Buat & Xu (1996) Buat, V. & Xu, C. 1996, A&A, 306, 61
- Buat et al. (1999) Buat , V., Donas, J., Milliard, B. & Xu, C. 1999, A&A, 352, 371
- Calzetti et al. (1994) Calzetti, D., Kinney, A.L. & Storchi-Bergmann, T. 1994, ApJ, 533, 682
- Calzetti et al. (2000) Calzetti, D., Armus, L., Bohlin, R. C., Kinney, A. L., Koornneef, J., & Storchi-Bergmann, T. 2000, ApJ, 533, 682
- Cardelli et al. (1989) Cardelli, J.,A., Clayton, G., & Mathis,J.,S. 1989, ApJ, 345, 245
- Charlot & Fall (2000) Charlot, S., Fall, M. 2000 ApJ, 539, 718
- Dale et al. (2001) Dale, D. A., Helou, G., Contursi, A., Silbermann, N. A., & Kolhatkar, S. 2001, ApJ, 549, 215
- Fioc & Rocca-Volmerange (1997) Fioc, M., Rocca-Volmerange, B. 1997, A&A, 326, 950
- Gavazzi et al. (2002) Gavazzi, G., Bonfanti, C., Sanvito, G., Boselli, & Scodeggio, M. 2002, ApJ, 576, 135
- Goldader et al. (2002) Goldader,J., D., Meurer, G., Heckman, T., M., Seibert, M., Sanders, D. B., Calzetti, D., Steidel, C., C. 2002, ApJ, 568, 651
- Gordon et al. (2000) Gordon, K. D., Clayton, G. C., Witt, A. N., & Misselt 2000, ApJ, 533, 236
- Helou et al. (1988) Helou, G., Khan, I. R., Malek, L., & Boehmer, L. 1988, ApJS, 68, 151
- Hopkins et al. (2001) Hopkins, A. M., Connolly, A., J., Haarsma, D. B., Cram, L. E. 2001 AJ, 122, 288
- Iglesias-Páramo et al. (2004) Iglesias-Páramo, J., Buat, V., Donas, J., Boselli, A., Milliard, B. 2004, A&A, 419, 109
- Kennicutt (1998) Kennicutt, R. C. 1998, ARA&A, 36, 189
- Kong et al. (2004) Kong, X., Charlot, S., Brinchmann, J., & Fall, S.M. 2004, astro-ph/0312474
- Meurer, Heckman, & Calzetti (1999) Meurer, G. R., Heckman, T. M., & Calzetti, D. 1999, ApJ, 521, 64
- Moshir et al. (2000) Moshir, M. et al. 1990, IRAS Faint Source catalogue, version 2.0
- Rowan-Robinson (2003) Rowan-Robinson, M. 2003, MNRAS, 344, 13
- Saunders et al. (1990) Saunders, W., Rowan-Robinson, M., Lawrence, A. et al. 1990, MNRAS, 242, 318
- Saunders et al. (2000) Saunders, W. et al. 2000, MNRAS, 317, 55
- Schlegel, Finkbeiner, & Davis (1998) Schlegel, D. J., Finkbeiner, D. P., & Davis, M. 1998, ApJ, 500, 525
- Steidel et al. (1999) Steidel, C. C., Adelberger, K. L., Giavalisco, M., Dickinson, M., & Pettini, M. 1999, ApJ, 519, 1
- Vijh et al. (2003) Vijh, U.P., Witt, A.N., Gordon, K.D. 2003, ApJ 587, 533
- Wang & Heckman (1996) Wang, B., Heckman, T. 1996, ApJ 457, 645
- Xu & Buat (1995) Xu, C., Buat, V. 1995 A&A, 293, L65