XMM-Newton observations of the Lockman Hole: III. A relativistic Fe line in the mean X-ray spectra of type-1 and type-2 AGN ††thanks: Based on observations obtained with XMM-Newton, an ESA science mission with instruments and contributions directly funded by ESA Member States and the USA (NASA)
Using the 770 ksec XMM-Newton survey of the Lockman Hole field in combination with extensive optical identifications of the AGN population, we derive an average rest-frame spectrum of AGN types-1 and 2. The most prominent feature in the averaged spectrum is a strong fluorescent Fe line. In both type-1 and type-2 AGN, a clear relativistic line profile is revealed. A laor line profile with an inner disk radius smaller than the last stable orbit of a Schwarzschild black hole is most consistent with the data, indicating that the average supermassive black hole has significant spin. Equivalent widths of the broad relativistic lines range between 400–600 eV. We used the disk reflection model to compare the observed strength of the line with the amplitude of the reflection component, concluding that to consistently describe the observations the average iron abundance should be about three times the solar value.
Key Words.:
Surveys – Galaxies: active – (Galaxies:) quasars: general – X-rays: general – galaxies: nuclei1 Introduction
The X-ray background is the echo of the growth of the Black Holes, which we see in the center of most galaxies today. A large fraction of the background has been resolved into discrete sources, being almost 100% below 2 keV and about 50% at 10 keV (Worsley et al. 2004). Since the peak of the background is at 30 keV, much still has to be resolved and we need detailed population synthesis models to understand the total background. A significant uncertainty still exists in the total flux of the XRB (Revnivtsev et al. 2003).
The observed background spectrum can be reproduced well by models folding the observed X-ray luminosity function and its evolution over cosmic time with AGN spectra observed through different amounts of neutral hydrogen column density following unified AGN models (Comastri et al. 1995, Gilli et al. 2001).
An important ingredient to the background synthesis models is the average X-ray spectrum of AGN, which at the moment has been largely taken from local samples of Seyfert-1 and Seyfert-2 galaxies. The typical model includes at least two parameters: the slope of the AGN spectrum and absorbing column (Mainieri et al. 2002). Here we explore the role of the fluorescent Fe line. A possibility to detect a feature in the cosmic spectrum arising from the Fe line has been first studied by Schwartz (1988), where narrow Fe lines were assumed. However, a diversity in line shapes have been recently reported, as relativistic iron lines have been discovered in some objects with ASCA (Tanaka et al. 1995) and confirmed with XMM-Newton (Wilms et al. 2001, Fabian et al. 2002). The most recent evidence is controversial. Only a small fraction of Seyfert galaxies seems to emit relativistic iron lines (Boller et al., in prep., Balestra et al. 2004) and the line shapes observed with XMM-Newton and Chandra are more complicated. Frequently a narrow component is observed in the Fe line and the analysis of the broad, relativistic component is often hampered by systematic uncertainties in modelling the continuum.
In this paper we have used the longest and most sensitive observation of the X-ray background by XMM-Newton, a 770 ksec observation in the Lockman Hole (Hasinger 2004). The fraction of optically identified sources with redshifts and a sufficient number of X-ray photons is quite high in this field, so that for the first time we are able to analyse the mean rest-frame spectra for a representative sample of type-1 and type-2 AGN at considerable redshifts. We find significant features in the average rest frame spectra: a broad line, with a peak at keV for the mean spectrum of type-1 AGN and a broad line, possible with a superposed narrow line with a peak at 6.4 keV for the mean type-2 spectrum. We model the broad component as a relativistically broadened fluorescent Fe line from the accretion disk around the Kerr (rotating) black hole (Laor 1991) with an equivalent width of eV and eV for the average spectrum of type 1 and 2 AGN, respectively.
The paper is structured as follows: §2 describes the observations, §3 the results of spectral analysis, with a discussion of the results presented in §4. We summarize in §5.
2 XMM-Newton observations and data reduction
The X-ray results reported in this paper are obtained from XMM-Newton observations of the Lockman Hole field, a special region in the sky with a extremely low Galactic hydrogen column density, cm-2 (Lockman et al. 1986).
The field was centered on the sky position RA 10:52:43 and DEC +57:28:48 (J2000) and observed during the three periods in 2000, 2001 and 2002 (PV, AO-1 and AO-2 phases). The remaining exposure time after cleaning from high background periods is approximately 770 ks. The PN and MOS data were preprocessed by the with the XMM standard Science Analysis System (SAS, version 5.3.3) routines, using the latest calibration data. We have derived the event files from the 16 individual observations of the Lockman Hole in the standard way (see Worsley et al. 2004).
Source and background spectra and the response matrices, arf and rmf, have been extracted for each source and each individual observation. The evselect tool is used to extract the spectrum and background region, which is defined as an annulus around the source, after masking out nearby sources. MOS1 plus MOS2 and independently pn source and background spectra and response matrices were combined for each source. Before spectral fitting, all spectra are binned with a minimum of 30 counts per bin in order to be able to apply the minimization technique. In this process, the background count rate is rescaled with the ratio of the source and background areas.
2.1 X-ray sample
Images, background maps and exposure maps were generated for each observation and detector individually in the standard 5 energy bands: 0.2–0.5, 0.5–2, 2–4.5, 4.5–7.5 and 7.5–12 keV. We ran the SAS source detection algorithm eboxdetect-emldetect on each instrument independently, using the five energy bands simultaneously. Afterwards we cross-correlated the pn source list with the lists obtained for MOS1 and MOS2 to build a complete unique catalogue of sources. As a last step we also cross-check our catalogue with the source catalogue by Mainieri et al. mai02 (2002) from the PV observation.
We selected a sample of 104 X-ray sources spectroscopically identified by Lehmann et al. (2001) and some additional spectroscopic redshifts for new XMM-Newton sources obtained at the Keck telescope in 2003 (Lehmann et al. lehmann05 (2005)) with counts larger than 200 in the 0.2–10 keV band. The bulk of the source identification comes from the flux limited ROSAT 0.5–2 keV sample. Most of these sources have been analysed individually by Mainieri et al. mai02 (2002). Mateos et al. mat05 (2005) present a detailed individual spectral analysis of the brightest sources, using the same data utilized in this paper.
In the following we will refer to type-1 and type-2 objects using the optical spectroscopic classification (see Schmidt et al. 1998, Lehmann et al. 2001). Our final sample includes 53 type-1 AGN, 41 type-2 AGN and 10 galaxies. Throughout the paper, errors correspond to the 90% confidence level for one interesting parameter ().
3 Results
3.1 Spectral analysis
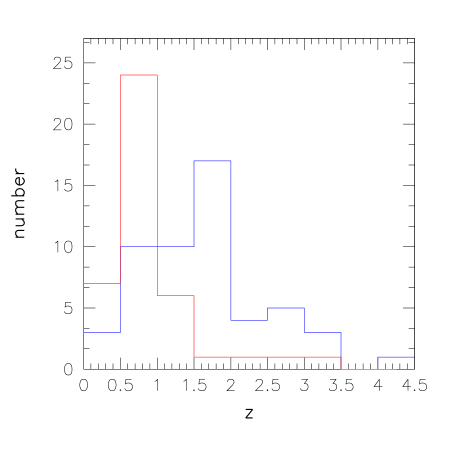
The redshift distribution of the sources in our sample in shown in Fig.1 and peaks at redshifts below 1 for type-2 AGN and close to 2 for type-1 AGN.
We used XSPEC (v11.2) for the spectral fitting analysis. All spectra have been extracted in the 0.2–10 keV band, MOS1 and MOS2 spectra have been merged. For every source we use a separate response matrix and ancillary response files, where a change in the filter between the observations is propagated as described in Mateos et al. mat05 (2005).
For every object in our sample we fit the spectrum with a single power law model modified by an intrinsic absorption, having the slope of the power law, its normalization and the absorbing column as free parameters. We save the ratio of the data to the model as well as a reconstructed unfolded spectrum. The next step consists of shifting the spectrum to the rest frame. For the ratio we simply increase the energies by the factor of , while for the unfolded spectra, we use the 2–10 keV rest frame energy band to renormalize the spectra to the same value for further averaging.
As the redshifts of the sources vary, their rest frame spectra have
different energy boundaries. To provide an average spectrum, we select a
common energy grid. We used a bin width of 0.25 keV for energies lower than
8 keV and a bin width 2 keV above. Such a choice is determined by the available counts. In a separate analysis, to study the Fe line profile in more detail, we rebinned the data using a binsize of 0.23 keV between 4 and 7 keV for the type-1 AGN spectra.
As the input spectra often have energy bins spread over two or more energy
bins of the output spectrum, in such instance we use the Monte-Carlo method
to choose the bin into which to add the data. As a final operation, we
normalize the flux in each energy bin of the output spectrum by the number
of points that were added to it. We propagate the errors accordingly.
Such an averaging is similar between the ratio and the unfolded spectra and both methods yield comparable results. As long as the redshifts of the objects in our sample are of order 1, it is possible to observe the rest frame averaged spectrum above 12 keV.
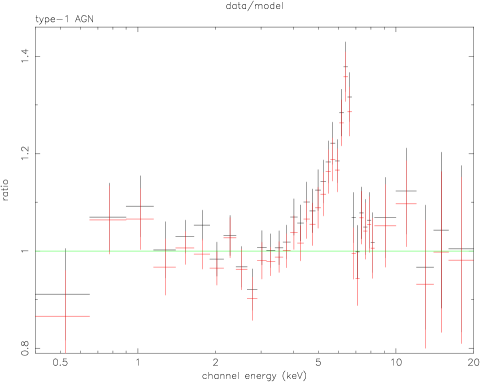
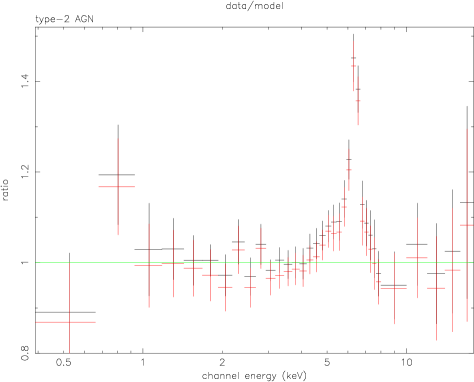
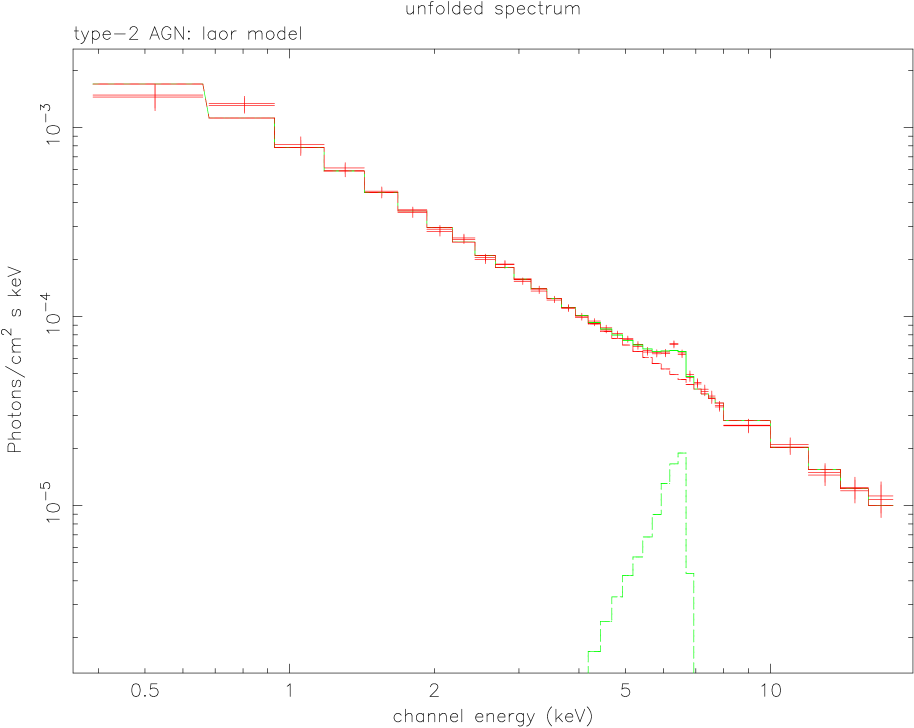
The averaged spectra for both type-1 and type-2 AGN show a prominent spectral feature at 6.4 keV. We observed an excess in the data/model ratio between 4–7 keV for the both type-1 and type-2 AGN (Fig. 2 and Fig. 3).
Such a feature can be due either to a broad emission line or to complex absorption. For the latter we have modelled the spectrum in terms of a partially-covered source (e.g. Boller et al. 2003) and obtain a good fit for the following parameters: , cm-2 and covering fraction . Such a strong partial-covering is usually not seen in nearby sources and to observe it in the average spectrum would require the individual sources to be very similar to each other. A variability analysis of the individual source components may be a useful test. In the remainder of this paper we explore the broad emission line interpretation.
3.2 Origin of the broad line feature in the type-1 AGN spectrum
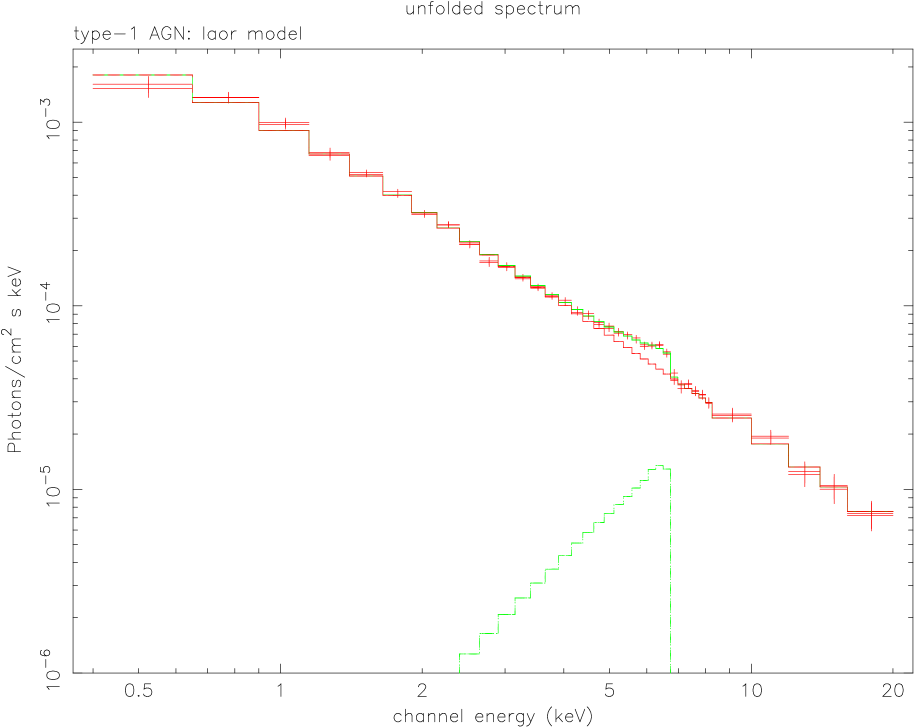
The energy of this broad line indicates that Fe atoms responsible for the line are in a low ionization state, with mean energy near 6.4 keV (in the rest-frame). Most probably such a broad and intense Fe line is due to low (moderate) ionization states of iron (i.e., Fe XVI). The line shape appears to be as predicted from disk theory and skewed toward energies lower than the rest energy of the emission line. The simplest interpretation of the skewed shape of the line is that it is due to Doppler and gravitational redshifts from the deep gravitational potential (the inner parts of a disc around a massive black hole). A strong red wing is indicative of gravitational redshifts close to a central black hole, and accretion disk models provide an excellent description of the data. Such line profile can be fitted with a relativistic profile from an accretion disc around either a Schwarzschild (non-rotating) or a Kerr (rotating) black hole (XSPEC models diskline and laor, respectively; Fabian et al. 1989; Laor 1991).
In both models we fixed the line energy to 6.4 keV and the emissivity index (-2 for diskline and 3 for laor) and fitted the rest of parameters: inner and outer radii and inclination angle of the disc (see Table. 1). The results for the inclination angle are close to the standard value of 30 deg observed for a wide sample of AGN, consistent with the sharp drop near 7 keV and observed peak around the rest energy (6.4 keV).
The laor and diskline model yield similar reduced , but the disk line model, at least for type-1 AGN spectra prefers an inner disk radius at the last stable orbit and an unreasonably small outer radius.
In order to estimate the errors for the equivalent widths, we assumed the relative errors to be the same as that of the line flux, because the errors in the continuum at the position of the Fe line position are negligible compared to this. It was found to have an average equivalent width of eV (laor model).
| Model | parameter | |||||||||
| Type-1 AGN | ||||||||||
| Energy | EW | |||||||||
| cm-2 | keV | eV | keV | deg | ||||||
| Gaussian | ||||||||||
| diskline | ||||||||||
| laor | ||||||||||
| Type-2 AGN | ||||||||||
| Energy | EW | |||||||||
| cm-2 | keV | eV | keV | deg | ||||||
| Gaussian | ||||||||||
| diskline | ||||||||||
| laor | ||||||||||
∗ fixed
3.3 Type-2 AGN
Our initial fit for the unfolded spectrum was an absorbed power law with a Gaussian component to represent the iron line. Moreover we used, as for type-1 AGN spectra, disk line models to fit our asymmetric line profiles. Disk line models provide a good fit to the red wing of the data. Results are shown in Table. 1. As an additional test, we use an additional zero-width Gaussian to fit a possible narrow line component in the Fe emission separately, which could come from reflection in material much further away from the accretion disk, e.g. in the torus, but this does not improve our significantly and therefore we neglect this Gaussian.
The unfolded spectrum for the type-2 AGN with skewed line wings looks similar to that of the type-1 AGN, except that an additional narrow iron line component at a rest energy keV seems to be present in the type-2 AGN.
Again, we assumed the relative error of the equivalent width to be that of the line flux. It was found to have an average equivalent width of eV (laor model).
4 Discussion
A Doppler-broadened line with a full width at half-maximum, km s-1 can only be produced in the inner region of a relativistic accretion flow by fluorescence (Fabian et al. 2002). The observed FWHM and EW is larger than the average value found in Seyfert 1 galaxies ( 500 eV, e.g. Nandra et al. 1997), but similar to the FWHM of some of the brightest nearby active galaxies (for example, to MCG-6-30-15 with z=0.007749).
One of the explanations for the large EWs for these objects can be given by a model including ionized disc reflection with lines and edges from different ionization stages of iron blurred together by relativistic effects (Ross & Fabian ros93 (1993), Fabian et al. 2002b). In this model, the value of the Fe abundance determines the relative importance of the line complex in respect to the comptonization bump, seen at energies exceeding 10 keV. Since the observed equivalent width of the broad Fe line is high, while the amplitude of a possible reflection component observed above 10 keV is small, this model yields a high Fe abundance as an explanation of the observation. This is in fact a novel method of measuring Fe abundance in QSO at X-rays, which in addition to the determination of redshifts will allow future X-ray surveys to give insight in the chemical evolution of the host environment of QSO. This model has been applied for several nearby objects and can account for all the observed spectral features, but yields a large iron overabundance of 3-7 solar (Tanaka et al. 2004, Boller et al. 2003). In our sample we also most likely obtain the large EW as the result of a high metallicity. To test this idea, we used the blurred ionised reflection models (Ross & Fabian ros93 (1993)) with an iron abundance of 3 solar (as needed for MCG-6-30-15) in order to obtain a high EW. The results describe our data very well.
An additional reason why our large equivalent width may be connected with a large metallicity is that most of our objects are quite distant and rather luminous AGNs. As shown by Shemmer et al. (2004), the metallicity is correlated with the accretion rate, which is in turn related to the luminosity. It is possible that the large equivalent widths are representative of a high metallicity, since these objects are both distant and luminous.
Our results are most consistent with a Laor model with inner disk radius well inside the maximum stable orbit for a Schwarzschild black hole, implying that the average X-ray bright AGN should contain rotating Kerr BH at their centres 111 The Laor (1991) model which is appropriate for spin a/m=0.998 gives a best fit . Dovčiak, Karas & Yaqoob (2003) plot the maximum redshift as a function of radius and spin (their Fig. 2). Assuming that the spectral fit is determined by the maximum redshift and that the emitting region is outside the radius of marginal stability (see Krolik & Hawley 2003 for a discussion of that point), corresponds to .. If this is the case, it implies that the spin will affect demographic arguments relating the AGN luminosity function to the mass function of remnant black holes in nearby glaxies (Sołtan 1982) since the radiative efficiency of accretion will increase. Indeed, this is postulated by recent work updating the Sołtan argument with modern galaxy – black hole correlation functions and AGN energetics based on hard X-ray surveys (Yu & Tremaine yutr02 (2002), Elvis, Risaliti & Zamorani elv02 (2002), Marconi et al. mar04 (2004)).Accretion is expected to build massive black holes with significant spin (Hughes & Blandford hug03 (2003); Volonteri et al. 2004).
The intensity of the relativistic line in our mean spectra implies that this line must be present in the majority of AGN in our sample. Using a similar technique we followed the same procedure with a source list and spectra from the XMM-Newton observation of the Chandra Deep Field South (Streblyanska et al. 2004). The results are consistent with our analysis of the LH and also with an independent analysis of the Chandra deep field data by Brusa et al. bru05 (2005). We also investigated, whether the signal could be dominated by a small number of objects with extremely bright features. For this purpose we applied a -clipping before averaging our spectral bins, but the resulting spectra do not differ significantly.
In future work we plan to investigate the dependence of the line on other parameters, such as redshift or luminosity. We will also consider a composite model with a range of inclinations.
5 Conclusions
This work includes analysis of EPIC-pn and MOS1/2 data. We present results of the X-ray spectral analysis of the 770 ksec deep survey observations obtained with XMM-Newton on the Lockman Hole. We have derived the average X-ray spectral properties of sources spectroscopically identified with the Keck telescopes. With data from the EPIC-pn and MOS detectors, we used a sample of 103 sources with redshift identification and photon counts . We used an averaging technique to determine average spectra of the different AGN populations. We parameterize the spectrum with a simple power law model. The continuum at 4–7 keV shows residuals above the power-law model, suggesting the presence of a strong broad feature, most likely a relativistic iron disk line. In the mean spectra of type-1 and type-2 AGN we find evidence for a broad line at rest-frame energy keV with EW eV and eV (laor model), respectively. We interpret this line as the fluorescent Fe line commonly observed in Seyfert galaxies. Our mean spectrum for the type-2 AGN indicates in addition to the broad line a narrow component.
The most interesting conclusions which follow from our analysis are:
The average rest-frame spectrum of the XRB sources shows a strong, relativistic iron line, possibly due to a high metallicity in the average population. The strong red wing of the line feature indicates some component of spin in the average black hole.
A very broad line feature is expected in the average X-ray background spectra (Fabian et al. 2000, Gilli et al. 2001), which should be included in future population synthesis models for the X-ray background.
In spite of the variety and complexity of Fe features at low z bright objects (both type-1 and type-2 Seyfert), the average line shape at higher redshift is consistent with a relativistic disk line for type-1 and type-2 AGN with some evidence of an additional narrow component for type-2 AGN.
These findings strongly reinforce the science case of the XEUS/Constellation-X mission; with the very large collecting area we can expect to measure the relativistic Fe line parameters of individual objects out to very high redshifts (z 10) and explore the evolution of black hole spin.
Acknowledgements.
We thank T. Boller for helpful comments and discussions that improved the manuscript. This work was supported by the German Deutsches Zentrum für Luft- und Raumfahrt, DLR project number 50 OR 0207 (A. Finoguenov) and the Max-Planck society, MPG. XB acknowledges financial support from the Spanish Ministerio de Educación y Ciencia, under project ESP2003-00812.References
- (1) Balestra, I., Bianchi, S., & Matt, G. 2004, A&A, 415, 437
- (2) Bardeen J. M., Press, W. H., Teukolsky, S. A. 1972, ApJ 178, 347
- (3) Boller Th., Gallo L., in prep.
- (4) Boller Th., Tanaka, Y., Fabian, A., et al. 2003, MNRAS, 343, 89
- (5) Brusa, M. et al. (in prep.)
- (6) Comastri, A. Setti, G., Zamorani, G. & Hasinger, G. 1995, A&A, 296, 1
- (7) Dovčiak, M., Karas, V., & Yaqoob T. 2003, ApJS, 153, 205, astro-ph/0403541
- (8) Elvis, M., Risaliti, G., Zamorani, G., 2002, ApJ 565, L75
- (9) Fabian, A. C., Rees, M. J., Stella, L., & White, N. E. 1989, MNRAS, 238, 729
- (10) Fabian, A. C., Iwashawa, K., Reynolds, C.S., & Young, A.J. 2000, PASP, 112, 1145
- (11) Fabian, A. C., Vaughan, S., Nandra, K., et al. 2002, MNRAS, 335, 1F
- (12) Fabian, A. C., Ballantyne, D. R.; Merloni, A., et al. 2002b, MNRAS, 331, 35F
- (13) Gilli, R., Salvati, M., & Hasinger, G. 2001, A&A, 366, 407
- (14) Hasinger G. 2004, Nuclear Physics B (Proc. Suppl.) 132, 86, (astro-ph/0310804)
- (15) Hughes, S. A., Blandford, R. D. 2003, ApJ 585, L101
- (16) Krolik, J. H., Hawley, J. F. 2002, ApJ 533, 754
- (17) Laor, A. 1991, ApJ, 376, 90
- (18) Lehmann, I., Hasinger, G., Schmidt, M., et al. 2001, A&A, 371, 833
- (19) Lehmann, I., et al., in prep.
- (20) Lockman, F. J., Jahoda, K., & McCammon, D. 1986, ApJ, 302, 432
- (21) Mainieri, V., Bergeron, J., Rosati, P., et al. 2002, A&A, 393, 425.
- (22) Marconi, A., Risaliti, G., Gilli, R., et al., 2004, MNRAS 351, 169
- (23) Mateos, S., Barcons, X., et al. 2005, A&A, (in preparation)
- (24) Nandra, K., George, I. M., Mushotzky et al. 1997, ApJ, 477, 602
- (25) Revnivtsev, M., Gilfanov, M., Sunyaev, R., et al. 2003, A&A, 411, 329
- (26) Rosati, P., Tozzi, P., Giacconi, R., et al. 2002, ApJ, 566, 667.
- (27) Ross, R. R., Fabian, A. C. 1993, MNRAS 261, 74
- (28) Soltan, A. 1982, MNRAS, 200, 115
- (29) Schmidt, M., Hasinger, G.,Gunn, J., et al. 1998, A&A, 329, 495
- (30) Schwartz D. A.,Tucker W. H. 1988, ApJ 332, 157
- (31) Shemmer, O., Netzer, H., Maiolino, R., et al. 2004, accepted by ApJ, astro-ph/0406559
- (32) Streblyanska, A., Bergeron, J., Hasinger, G., et al. 2004, A&A, (in preparation)
- (33) Tanaka, Y., Nandra, K., Fabian, A. C., et al. 1995, Nature, 375, 659
- (34) Tanaka, Y., Boller, Th., Gallo, L., et al. 2004, PASJ, 56, 9
- (35) Volonteri, M., Madau, P., Quataert, E., & Rees, M. 2004, submitted to AJ, astro-ph/0410342
- (36) Wilms, J., Christopher S., Begelman, M. C., et al. 2001, MNRAS, 328, 27
- (37) Worsley, M., Fabian, A. C., Mateos, S., et al. 2004, MNRAS 352, L28
- (38) Yu Q., Tremaine S. 2002, MNRAS 335, 965