Calculated spectra for HeH+ and its effect on the opacity of cool metal poor stars
Abstract
The wavelength and Einstein A coefficient are calculated for all rotation-vibration transitions of 4He1H+, 3He1H+, 4He2H+ and 3He2H+, giving a complete line list and the partition function for 4HeH+ and its isotopologues. This opacity is included in the calculation of the total opacity of low-metallicity stars and its effect is analysed for different conditions of temperature, density and hydrogen number fraction. For a low helium number fraction (as in the Sun), it is found that HeH+ has a visible but small effect for very low densities (g cm-3), at temperatures around 3500 K. However, for high helium number fraction, the effect of HeH+ becomes important for higher densities (g cm-3), its effect being most important for a temperature around 3500 K. Synthetic spectra for a variety of different conditions are presented.
1 INTRODUCTION
HeH+ is thought to be the first molecular species to appear in the Universe (Lepp et al. 2002). Consequently, stars formed from primordial material should contain some HeH+. Such stars probably exist, Kashlinsky and Rees (1983) proposed a route by which stars of mass as low as 0.2 M⊙ could be formed from primordial material. Moreover, the recent discovery of the very metal poor star HE 0107-5240 (Christlieb et al. 2002) has added credence to the possibility that low-mass primordial stars were formed. Observing such stars would provide much information about the early Universe, and could give an estimate of its age. Then, HeH+ could influence their formation and evolution. To have accurate information about the stellar formation and evolution, we need to have the necessary opacity data.
For zero-metallicity stars, the only contributors to the opacity are the various hydrogen and helium species, ions and electrons. Many hydrogen and helium species have already been included in calculated opacity of zero-metallicity stars but HeH+ has always been neglected in such calculations (Harris et al. 2003). However, HeH+ could be important because of its strong electric dipole moment. There appears to be no available opacity data for HeH+ and its isotopologues. Such an opacity is calculated in this work. These calculations provide predictions of the line intensity of HeH+, which also could be used to search for this molecular ion in the Universe.
There have been several previous attempts to detect extraterrestrial HeH+: none conclusive. Moorhead et al. (1987) tried to detect HeH+ in the planetary nebula NGC 7027 but failed. According to Cecchi-Pestellini and Dalgarno (1993), this failure arose from an incorrect estimate of the chemistry of HeH+ and hence of its concentration in the planetary nebula. Furthermore Moorhead et al. (1987) may not have observed the right volume of the nebula. Miller et al. (1992) tentatively identified two emission features in the spectra of supernova 1987A as due to HeH+. This observation has not been confirmed. The HeH+ j=1-0 rotational emission line may have been observed by the Infrared Space Observatory in NGC 7027 (Liu et al. 1997). Its identification is complicated by the near coincidence of its 149.14 m rotational transition with the 149.09 and 149.39 m lines of CH. Moreover, Rabadan et al. (1998) found that the electron impact excitation rate to the rotational level from is half that for . As a result, observation of both and emission lines should be possible. Observation of both these would give a much more secure detection of HeH+.
Having accurate theoretical predictions for the spectrum of low-metallicity stars should help to determine the best conditions to search for and detect HeH+. Knowing the spectrum of HeH+ should also aid its detection in other astrophysical environments. Zygelman et al. (1998) investigated the possibility for enhancement of the rate of formation of HeH+ in astrophysical environments when stimulated by the cosmic background radiation field. They found that the effects on the fractional abundance of HeH+ are small in the early Universe, in supernova ejecta and in planetary nebulae but may be important in quasar broad-line clouds.
As our calculations show (see below), it could be possible to detect HeH+ in cool helium stars. Such stars exist, Saio and Jeffery (2000) have observed and studied helium stars, and particularly V625 Her, for more than 20 years. They showed that the merger of two white dwarfs could lead to an extreme helium star (containing a number fraction of helium around 0.9). On the other hand, Bergeron and Leggett (2002) studied two cool white dwarfs SDSS 1337+00 and LHS 3250 and found that their observed energy distributions were best reproduced by models of cool extreme helium stars, and so these stars should be such objects. However, they did not take account of HeH+ in their atmosphere models (Bergeron et al. 2001). Similarly Stancil (1994) investigated the effect of the opacities of He and H in cool white dwarfs but neglected the effect of HeH+ which is however a more stable ion.
In this work we will investigate the effect of HeH+ on the opacity of zero-metallicity stars. In section 2 we will describe the steps leading to the calculation of the energy levels of all stable isotopologues of HeH+ and compute a spectroscopic line list and their partition function. In section 3 we explain how the opacity functions were calculated and use them in models of metal poor stars for different temperatures, densities and hydrogen number fractions. Finally, results are discussed in section 4.
2 CALCULATION OF THE LINE LIST
2.1 Transition Data
The program LEVEL 7.5 (Le Roy 2002) was used to obtain rotation-vibration transition frequencies and Einstein A coefficients. The core of the program determines discrete eigenvalues and eigenfunctions of the radial Schroedinger equation. We used LEVEL to calculate the number, energy and wavefunction of each vibration-rotational level for a given one-dimensional potential. These were then used to calculate Einstein coefficients for dipole transitions between all bound vibration-rotation levels of each isotopologue.
The Schroedinger equation which is numerically solved by the program is :
| (1) |
where is the effective reduced mass of the system, the rotational quantum number, the vibrational quantum number, is the effective potential of the molecule, being the distance between the two atoms of the molecule. is defined by:
| (2) |
where is the potential in the Born Oppenheimer approximation and are the adiabatic corrections.
The core of the calculation is to determine the eigenvalues and eigenfunctions of the effective potential . In order to obtain such information, one has to provide input data to the program. The physical data are the masses of the atoms of the diatomic molecule, its effective potential as a function of the internuclear distance and the dipole moment, also as a function of the internuclear distance .
For each isotopologue, was that calculated using the Born-Oppenheimer approximation by Kolos and Peek (1976). This potential was corrected for adiabatic effects (Bishop and Cheung 1979), which accounts for some of the coupling between electronic and nuclear motion. The corrections were given by Bishop and Cheung (1979) for 4HeH+ but as 4HeH+ and its isotopologues 4HeD+, 3HeH+ and 3HeD+ only differ in their reduced mass, we just had to replace the 4HeH+ reduced mass by the appropriate isotopologue’s reduced mass.
The effective potential allows for adiabatic effects. Adjusting the masses allows, at least partially, for non-adiabatic effects. We calculated energy levels for several reduced masses given by Coxon and Hajigeorgiou (1999). We tested the nuclear reduced mass, , which does not take account of the electrons, the atomic reduced mass , which takes full account of the electrons and the effective, , and dissociation, , reduced masses which have intermediate values. We compared our transition frequencies calculated using the dipole selection rules (=1, any) with the experimental transition frequencies tabulated by Coxon and Hajigeorgiou (1999). The results are summarised in tables 1 and 2. Use of the dissociation reduced mass leads to the best results (see tables 1 and 2). Since the dissociation reduced mass is the most appropriate for high-lying (near dissociation) levels, it should also be the best for levels yet to be observed experimentally. We therefore used this mass for all further calculations presented here.
| Experiment (cm-1) | Difference obs-calc (cm-1) | ||||||
| v’ | v” | J | P(J) transition | ||||
| 1 | 0 | 1 | 2843.9035 | 0.284 | 0.457 | 0.036 | 0.216 |
| 2 | 2771.8059 | 0.279 | 0.418 | 0.022 | 0.215 | ||
| 3 | 2695.0500 | 0.278 | 0.371 | 0.002 | 0.218 | ||
| 4 | 2614.0295 | 0.278 | 0.320 | 0.020 | 0.223 | ||
| 5 | 2529.134 | 0.278 | 0.266 | 0.043 | 0.228 | ||
| 6 | 2440.742 | 0.276 | 0.211 | 0.066 | 0.231 | ||
| 9 | 2158.140 | 0.268 | 0.037 | 0.136 | 0.240 | ||
| 10 | 2059.210 | 0.260 | 0.019 | 0.156 | 0.238 | ||
| 11 | 1958.388 | 0.250 | 0.074 | 0.174 | 0.234 | ||
| 12 | 1855.905 | 0.243 | 0.132 | 0.195 | 0.233 | ||
| 13 | 1751.971 | 0.225 | 0.181 | 0.206 | 0.221 | ||
| 2 | 1 | 1 | 2542.531 | 0.069 | 0.492 | 0.173 | 0.018 |
| 2 | 2475.814 | 0.067 | 0.456 | 0.159 | 0.019 | ||
| 5 | 2248.854 | 0.064 | 0.319 | 0.102 | 0.029 | ||
| 6 | 2165.485 | 0.070 | 0.260 | 0.072 | 0.040 | ||
| 7 | 2078.841 | 0.091 | 0.184 | 0.027 | 0.066 | ||
| 8 | 1989.251 | 0.089 | 0.129 | 0.005 | 0.069 | ||
| 9 | 1896.992 | 0.106 | 0.053 | 0.038 | 0.092 | ||
| 10 | 1802.349 | 0.114 | 0.016 | 0.072 | 0.105 | ||
| 11 | 1705.543 | 0.121 | 0.085 | 0.105 | 0.117 | ||
| 19 | 862.529 | 0.106 | 0.651 | 0.341 | 0.156 | ||
| 20 | 745.624 | 0.099 | 0.744 | 0.377 | 0.158 | ||
| 3 | 2 | 5 | 1966.356 | 0.043 | 0.175 | 0.051 | 0.023 |
| 17 | 833.640 | 0.096 | 0.650 | 0.336 | 0.147 | ||
| 18 | 719.769 | 0.098 | 0.752 | 0.380 | 0.158 | ||
| 5 | 4 | 11 | 901.963 | 0.060 | 0.522 | 0.259 | 0.102 |
| 12 | 807.806 | 0.078 | 0.614 | 0.309 | 0.127 | ||
| 6 | 5 | 8 | 863.378 | 0.048 | 0.521 | 0.252 | 0.092 |
| 9 | 782.925 | 0.044 | 0.575 | 0.274 | 0.093 | ||
| 7 | 6 | 4 | 817.337 | 0.127 | 0.624 | 0.342 | 0.173 |
| 5 | 760.367 | 0.151 | 0.681 | 0.380 | 0.200 | ||
| 7 | 5 | 12 | 938.200 | 0.327 | 1.758 | 0.573 | 0.136 |
| Experiment (cm-1) | Difference obs-calc (cm-1) | ||||||
| v | J” | J’ | frequency | ||||
| 0 | 0 | 1 | 67.053 | 0.002 | 0.037 | 0.015 | 0.002 |
| 1 | 2 | 133.717 | 0.004 | 0.074 | 0.030 | 0.003 | |
| 6 | 7 | 448.160 | 0.007 | 0.244 | 0.102 | 0.016 | |
| 10 | 11 | 657.221 | 0.026 | 0.313 | 0.121 | 0.005 | |
| 11 | 12 | 701.317 | 0.020 | 0.333 | 0.132 | 0.012 | |
| 12 | 13 | 741.706 | 0.026 | 0.336 | 0.130 | 0.007 | |
| 13 | 14 | 778.224 | 0.032 | 0.335 | 0.127 | 0.002 | |
| 14 | 15 | 810.708 | 0.038 | 0.330 | 0.121 | 0.004 | |
| 15 | 16 | 839.010 | 0.042 | 0.322 | 0.115 | 0.009 | |
| 16 | 17 | 862.984 | 0.043 | 0.313 | 0.110 | 0.011 | |
| 17 | 18 | 882.475 | 0.047 | 0.297 | 0.102 | 0.015 | |
| 18 | 19 | 897.334 | 0.035 | 0.290 | 0.106 | 0.005 | |
| 20 | 21 | 912.242 | 0.036 | 0.234 | 0.080 | 0.011 | |
| 21 | 22 | 911.704 | 0.033 | 0.200 | 0.068 | 0.011 | |
| 23 | 24 | 891.888 | 0.035 | 0.087 | 0.018 | 0.024 | |
| 24 | 25 | 870.298 | 0.028 | 0.009 | 0.012 | 0.025 | |
| 25 | 26 | 837.180 | 0.033 | 0.133 | 0.076 | 0.042 | |
| 1 | 10 | 11 | 598.829 | 0.018 | 0.270 | 0.107 | 0.009 |
| 11 | 12 | 637.767 | 0.013 | 0.282 | 0.114 | 0.014 | |
| 12 | 13 | 672.989 | 0.009 | 0.291 | 0.120 | 0.019 | |
| 13 | 14 | 704.270 | 0.019 | 0.281 | 0.111 | 0.009 | |
| 14 | 15 | 731.430 | 0.016 | 0.280 | 0.112 | 0.012 | |
| 15 | 16 | 754.235 | 0.019 | 0.266 | 0.104 | 0.007 | |
| 16 | 17 | 772.464 | 0.017 | 0.253 | 0.100 | 0.008 | |
| 17 | 18 | 785.837 | 0.015 | 0.235 | 0.093 | 0.008 | |
| 18 | 19 | 793.997 | 0.023 | 0.197 | 0.072 | 0.003 | |
| 19 | 20 | 796.490 | 0.027 | 0.156 | 0.052 | 0.010 | |
| 20 | 21 | 792.616 | 0.032 | 0.101 | 0.025 | 0.020 | |
| 21 | 22 | 781.245 | 0.048 | 0.019 | 0.019 | 0.042 | |
| 22 | 23 | 760.340 | 0.030 | 0.061 | 0.043 | 0.033 | |
| 23 | 24 | 724.933 | 0.043 | 0.254 | 0.135 | 0.063 | |
| 2 | 13 | 14 | 627.320 | 0.019 | 0.207 | 0.079 | 0.002 |
| 14 | 15 | 648.324 | 0.014 | 0.200 | 0.078 | 0.005 | |
| 15 | 16 | 664.559 | 0.015 | 0.180 | 0.069 | 0.003 | |
| 16 | 17 | 675.609 | 0.012 | 0.156 | 0.061 | 0.003 | |
| 17 | 18 | 680.895 | 0.014 | 0.119 | 0.044 | 0.001 | |
| 18 | 19 | 679.586 | 0.019 | 0.064 | 0.017 | 0.011 | |
| 19 | 20 | 670.340 | 0.024 | 0.010 | 0.018 | 0.023 | |
| 20 | 21 | 650.613 | 0.025 | 0.118 | 0.065 | 0.033 | |
Using SI units, the Einstein coefficient is related to the transition dipole by:
| (3) |
We used the electric dipole moment data for 4HeH+ given in Saenz (2003). These data could not be used directly as Saenz tabulates only the electronic dipole moment which is the contribution of the electrons to the dipole moment, without taking account of the nuclear charges of H and He. To use these data we first had to take account of H and He and then to translate the dipole to the centre of mass for each isotopologue, our results are given in table 3.
| / a0 | 4HeH+ | 3HeH+ | 4HeD+ | 3HeD+ |
|---|---|---|---|---|
| 0.6 | 0.14879 | 0.11879 | 0.06879 | 0.02879 |
| 0.8 | 0.24025 | 0.20025 | 0.13358 | 0.08025 |
| 1.0 | 0.35267 | 0.30267 | 0.21934 | 0.15267 |
| 1.1 | 0.41620 | 0.36120 | 0.26953 | 0.19620 |
| 1.2 | 0.48426 | 0.42426 | 0.32426 | 0.24426 |
| 1.3 | 0.55658 | 0.49158 | 0.38325 | 0.29658 |
| 1.4 | 0.63288 | 0.56288 | 0.44621 | 0.35288 |
| 1.45 | 0.67245 | 0.59995 | 0.47912 | 0.38245 |
| 1.5 | 0.71291 | 0.63791 | 0.51291 | 0.41291 |
| 1.6 | 0.79641 | 0.71641 | 0.58308 | 0.47641 |
| 1.8 | 0.97277 | 0.88277 | 0.73277 | 0.61277 |
| 2.0 | 1.15986 | 1.05986 | 0.89319 | 0.75986 |
| 2.2 | 1.35549 | 1.24549 | 1.06216 | 0.91549 |
| 2.4 | 1.55743 | 1.43743 | 1.23743 | 1.07743 |
Thus we obtained a line list of 4HeH+, 3HeH+, 4HeD+ and 3HeD+ transitions. Table 4 gives part of the line list: the astronomically most important transitions for 4HeH+. The full line list for this main isotopologue which contains 1431 lines, and the minor variants are available in electronic form at the Centre de Donnes astronomiques de Strasbourg (CDS) via http://cdsweb.u-strasbg.fr/cgi-bin/qcat?/MNRAS/???/???. These tables use the standard Kurucz format (Kurucz 2000).
| (nm) | A (s-1) | J’ | E’(cm-1) | J” | E”(cm-1) | code V’ | V” | iso |
|---|---|---|---|---|---|---|---|---|
| label’ | label” | |||||||
| 1770.0593 | 0.428986E+02 | 3.0 | 5850.293 | 2.0 | 200.765 | 102X 2 | X 0 | 14 |
| 1780.5247 | 0.384090E+02 | 2.0 | 5683.373 | 1.0 | 67.051 | 102X 2 | X 0 | 14 |
| 1794.8580 | 0.305583E+02 | 1.0 | 5571.471 | 0.0 | 0.000 | 102X 2 | X 0 | 14 |
| 1835.4404 | 0.824290E+02 | 0.0 | 5515.334 | 1.0 | 67.051 | 102X 2 | X 0 | 14 |
| 1861.9524 | 0.517642E+02 | 1.0 | 5571.471 | 2.0 | 200.765 | 102X 2 | X 0 | 14 |
| 3248.6434 | 0.365347E+03 | 3.0 | 3278.973 | 2.0 | 200.765 | 102X 1 | X 0 | 14 |
| 3301.8692 | 0.341654E+03 | 2.0 | 3095.638 | 1.0 | 67.051 | 102X 1 | X 0 | 14 |
| 3363.8480 | 0.283663E+03 | 1.0 | 2972.786 | 0.0 | 0.000 | 102X 1 | X 0 | 14 |
| 3516.0271 | 0.830802E+03 | 0.0 | 2911.170 | 1.0 | 67.051 | 102X 1 | X 0 | 14 |
| 3607.4759 | 0.542764E+03 | 1.0 | 2972.786 | 2.0 | 200.765 | 102X 1 | X 0 | 14 |
| 50098.8713 | 0.375132E+01 | 3.0 | 400.370 | 2.0 | 200.765 | 102X 0 | X 0 | 14 |
| 74786.5782 | 0.104399E+01 | 2.0 | 200.765 | 1.0 | 67.051 | 102X 0 | X 0 | 14 |
| 149140.4805 | 0.109163E+00 | 1.0 | 67.051 | 0.0 | 0.000 | 102X 0 | X 0 | 14 |
2.2 The Partition Function
The internal partition function is defined by:
| (4) |
where is Boltzmann’s constant. The energy of the level relative to the vibration rotation ground state is given by and its degeneracy by . is given by . As we computed all the energy levels, we used this data list and made a direct summation of each level i. The partition functions of 4HeH+ and its isotopologues are given in table 5.
| [K] | 4HeH+ | 4HeH+a | 3HeH+ | 4HeD+ | 3HeD+ |
|---|---|---|---|---|---|
| 10 | 1.00 | 1.00 | 1.01 | 1.00 | |
| 20 | 1.02 | 1.02 | 1.16 | 1.12 | |
| 50 | 1.45 | 1.40 | 2.09 | 1.93 | |
| 100 | 2.44 | 2.32 | 3.78 | 3.45 | |
| 200 | 4.51 | 4.26 | 7.20 | 6.54 | |
| 400 | 8.69 | 8.19 | 14.11 | 12.77 | |
| 600 | 12.93 | 12.17 | 21.17 | 19.12 | |
| 800 | 17.28 | 16.24 | 28.59 | 25.76 | |
| 1000 | 21.84 | 20.36 | 20.51 | 36.62 | 32.90 |
| 1500 | 34.79 | 32.36 | 32.53 | 60.43 | 53.87 |
| 2000 | 50.76 | 47.66 | 48.28 | 90.91 | 80.53 |
| 2500 | 70.54 | 66.55 | 65.52 | 129.45 | 114.10 |
| 3000 | 94.80 | 89.33 | 87.83 | 177.32 | 155.70 |
| 3500 | 123.90 | 116.35 | 114.58 | 235.36 | 206.00 |
| 4000 | 157.84 | 147.93 | 145.77 | 303.68 | 265.09 |
| 4500 | 196.32 | 184.42 | 181.10 | 381.76 | 332.47 |
| 5000 | 238.77 | 226.19 | 220.08 | 468.57 | 407.23 |
| 5500 | 284.56 | 273.61 | 262.10 | 562.82 | 488.24 |
| 6000 | 333.00 | 327.04 | 306.55 | 663.12 | 574.31 |
| 6500 | 383.44 | 386.87 | 352.82 | 768.13 | 664.27 |
| 7000 | 435.30 | 453.51 | 400.38 | 876.59 | 757.06 |
| 7500 | 488.05 | 527.35 | 448.75 | 987.41 | 851.74 |
| 8000 | 541.27 | 608.81 | 497.54 | 1099.61 | 947.50 |
| 8500 | 594.57 | 698.32 | 546.40 | 1212.41 | 1043.66 |
| 9000 | 647.67 | 796.29 | 595.07 | 1325.12 | 1139.65 |
| a Sauval and Tatum (1984). | |||||
We fitted the partition functions of the isotopologues to the standard form of Irwin (1981):
| (5) |
where =. The coefficients an are given in table 6.
| an | 4HeH+a | 4HeH+ | 3HeH+ | 4HeD+ | 3HeD+ |
|---|---|---|---|---|---|
| a0 | 2.3613 | 2.38224 | 2.34679 | 2.67542 | 2.61436 |
| a1 | 1.9733 | 1.79357 | 1.78517 | 1.8795 | 1.86015 |
| a2 | 0.6761 | 0.0539707 | 0.042402 | 0.108517 | 0.102426 |
| a3 | 0.0794 | 0.736706 | 0.726715 | 0.788349 | 0.782675 |
| a Sauval and Tatum (1984). | |||||
This fit reproduces all our data to within better than 0.9. For 4HeH+, our results agree reasonably with those of Sauval and Tatum, although our is significantly lower at high temperatures. We know of no data on the partition function for the other isotopologues.
3 The Opacity of Zero-Metallicity Stars
3.1 The Opacity of HeH+
The monochromatic opacity or absorption coefficient is given by the relation:
| (6) |
where for the particular combination of units of dipole moment in Debye, Einstein coefficients in s-1 and wavenumber in cm-1, the integrated intensity in cm per molecule, is given by:
| (7) | |||||
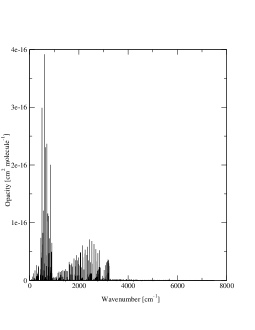
is the line profile, which is assumed to result from the Doppler effect, is the central frequency of line and is the frequency where the monochromatic opacity is calculated. To calculate we took account of the lines whose frequency was in the region []. The opacity function for one species is the set of all the values . So to compute the opacity function of the molecular ion HeH+, we had to obtain for all frequencies. We calculated the opacity functions of all the isotopologues of HeH+ and included them in the program LoMES (Harris et al. 2004, to be submitted) to take account of them in the calculation of the total opacity, see next section. In figure 1 we give the opacity of 4HeH+. Inspecting this shows that we can already assume that this molecular ion will only have an effect on the opacity for wavenumbers under 5000 cm-1.
3.2 Calculation of the Total Opacity
We used program LoMES which was written to calculate the effect of H (Harris et al. 2003). This program calculates the frequency-dependent continuous opacity, which is the total opacity. It uses the subroutines developed by Booth and Lynas-Gray (2002, private communication) and Harris et al. (2003) to calculate the continuous opacity contributions from H I, H-, He-, He I, He II bound-free and free-free, H free-free, Rayleigh scattering of He I, H2 and H I, Thompson scattering by e- and H free-free and bound-free. Finally, H I line absorption are included by using the STARK subroutine from the ATLAS12 program (Kurucz 1993). For more details concerning program LoMES, see Harris et al. (2004, to be submitted). Harris et al. (2003) showed that H influences the opacity of metal poor stars. H contributes to opacity both through electron donation and by direct absorption. In fact, in a zero-metallicity gas there are four different mechanisms which control the opacity (Lenzuni et al. 1991): collision-induced absorption by H2; Rayleigh scattering by H, H2 and He; Thomson scattering by e- and free-free and bound-free absorption by H-. The last mechanism dominates the opacity at densities which can be found in stellar atmospheres (10-10 g cm g cm-3), at temperatures between 3500 and 7000K and it was shown (Harris et al. 2003) that H, acting as an electron donor, increased the abundance of H- and hence the opacity. Furthermore, H was found to contribute up to 15 to the opacity via line absorption. This is far smaller than its indirect effect on the opacity through electron donation (it can increase the opacity by a factor of three). On the other hand, the effect of H on the opacity is only important at densities higher than 10-8 g cm-3. So, for very low-metallicity stars having a very low density, the molecular ion HeH+ could have an effect on their opacity because of its strong dipole moment, particularly in cases where the He to H ratio is high.
3.2.1 The Number Density of HeH+ and Its Isotopologues
In this work we use the LoMES equation of state subroutine which is an improved version of the equation of state used by Harris et al. (2003). LoMES was developed for use in modelling of very low-metallicity stellar atmospheres. It takes account of what are likely to be the 12 most common elements in very low-metallicity stars: H, He, C, N, O, Ne, Na, Mg, Si, S, Ca and Fe. The cat and anions of these atoms are accounted for as are the molecular ions H, H, H and HeH+. Finally LoMES currently considers for the molecules: CO, CN, C2, CH, OH, NH, NO, O2, N2, CS, HCN, H2O and their cat and anions.
LoMES uses the Saha equation to build a set of 13 non-linear simultaneous conservation equations. These equations are then solved for molecular equilibrium by using a multi-variable Newton-Raphson iteration. This technique has been well documented in the past (e.g. Kurucz 1970). The LoMES subroutine assumes a preset metal mix, and takes input of hydrogen, helium and metal number fraction, as well as temperature. The user can choose either density or pressure as the final state variable. LoMES returns the density or pressure along with the number densities of the 87 species including electrons.
In this work we focus on pure hydrogen-helium mixes, so that we set the metal number fraction to near zero (10-30). This allows us to avoid the potential numerical problems of setting the number fraction to zero, whilst the effects of the metals are insignificant.
The number density NHeH of HeH+ was calculated by the program and we had to find the proportions of the different isotopologues in the number density of HeH+. As we were interested in metal poor stars formed from primordial material, we considered that the proportions of the isotopologues of HeH+ were the same as in the primordial Universe.
To find these proportions, we used data given in Coc et al. (2004). They used both standard big bang nucleosynthesis (SBBN) and recent WMAP results to calculate the primordial 4He mass fraction and the abundance ratio of D/H and 3He/H. Both SBBN and WMAP are used to determine the baryonic density (density of ordinary matter) in the Universe. The SBBN is a method, based on nuclear physics in the early Universe whereas WMAP studies the cosmic microwave background anisotropies to deduce the baryonic parameter (where is the Hubble constant expressed in units of 100 km s-1 Mpc-1). The WMAP+SBBN results were Yp = 0.2479 0.0004 for the 4He mass fraction, 3He/H = (1.04 0.04) 10-5 and D/H = (2.60) 10-5.
Thus, we used number densities of : 1.2510-4 NHeH for 3HeH+, 2.6010-5 NHeH for 4HeD+, 3.2610-9 NHeH for 3HeD+, [1- (1.2510-4+2.6010-5 +3.2610-9)]NHeH for 4HeH+.
The total opacity was obtained by summing each opacity multiplied by the corresponding density fraction. We investigated the effect of HeH+ on the opacity of zero-metallicity stars for different conditions, the results are discussed in the next section.

4 RESULTS AND DISCUSSION
In order to find the importance of HeH+ in zero-metallicity stars, we have calculated the total opacity for different temperatures , densities and hydrogen number fractions Xn. The total opacity takes account of all the hydrogen and helium species including H but with or without HeH+ to investigate its effect.
First we made a calculation using the solar hydrogen number fraction (Xn=0.92) and a temperature of 3500 K where the effect of H is maximum (Harris et al. 2003). The effect of H on the opacity is only important at high densities (10-8 g cm-3).
As a result, for low-metallicity stars having very low density, we find very weak lines caused by the molecular ion HeH+. HeH+ contributes to opacity only for wavenumbers between 0 and 5000 cm-1 (see figure 1).
At temperatures higher than 4000 K neither HeH+ lines nor H lines are visible, that is because the opacity created by H- increases much faster with the temperature than the opacity created by HeH+ and the effect of H is only important for temperatures lower than 3500 K.
At lower temperatures, around 3000 K, H lines dominate and no HeH+ lines are visible.
Finally, for densities higher then 10-8 g cm-3 one can neglect HeH+ lines if the number fraction of helium is solar. However they become visible, but not very important, at densities lower than 10-10 g cm-3 and for a temperature around 3500 K.
We then decreased the hydrogen number fraction (Xn=0.8 to 0.1), that means increased the helium number fraction. We found that HeH+ lines become more important as the helium number fraction increases.
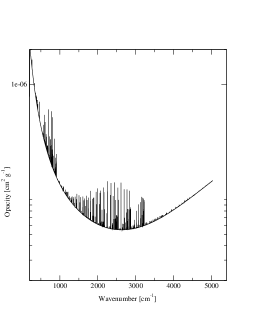
Keeping the hydrogen number fraction equal to 0.1, we varied the temperature and the density. With this high helium number fraction, HeH+ lines are clearly visible for higher densities from 10-8, even 10-6 g cm-3, their maximum effect is for a density of 10-9 g cm-3 and a temperature of 3500 K (see figure 2).
For a high helium number fraction, HeH+ lines become important even for densities around 10-8 g cm-3 and are more important for a temperature around 3500K. Thus the helium number fraction seems to be the most important parameter in determining the role of HeH+. Thus, if one hopes to detect HeH+ in a star’s atmosphere, the best conditions are a very low density (g cm-3), a temperature around 3500 K and a high number fraction of helium.
As H, HeH+ influences the opacity by direct absorption and by electron donation, but our tests showed the latter is unimportant compared to the direct absorption. Indeed, we checked the effect of HeH+ as an electron donor. For a hydrogen number density of 0.1 or less, the effect of the electron donation by HeH+ becomes important but only for high densities ( g cm-3).
5 CONCLUSION
We have calculated all the energy levels of 4HeH+, 3HeH+, 4HeD+ and 3HeD+ and the Einstein coefficients corresponding to each rotation-vibrational transitions and pure rotational transitions. Thus we have obtained complete line lists for all the isotopologues of HeH+. These transition data could also be important for nebular and interstellar studies. The partition functions of each isotopologues have been computed by direct summation of the energy levels. These data have been then used to calculate the opacity of HeH+.
The total opacity has been calculated for zero-metallicity gas, taking account of the isotopic composition of the primordial Universe. We have used an updated version of the program which was used to investigate the effect of H by Harris et al. (2003). The total opacity has been calculated for different temperatures, densities and number fraction of hydrogen.
We have checked the validity of Harris et al.’s (2003) effective neglect of the molecular ion HeH+ when they studied the effect of H. Their results are correct because they were interested in high densities, around 10-6 g cm-3 and in a solar helium number fraction. However, HeH+ lines become visible for very low densities (10-10 g cm-3) when the helium number fraction is solar, and for temperatures near 3500 K. Moreover, when the helium number fraction is high (0.9), HeH+ lines can be strongly seen for higher densities (10-6 g cm-3) and are still more important for a temperature around 3500 K and a density of 10-9 g cm-3.
The stars whose observed energy distributions were analysed by Bergeron and Leggett (2002) seem to satisfy these conditions. Indeed, Bergeron and Leggett (2002) studied two cool white dwarfs LHS 3250 and SDSS 1337+00 and showed that the best predictions for their observed energy distributions were given by simulations using extreme helium compositions. They concluded that their cool white dwarfs should have helium-rich atmospheres and effective temperatures below 4000 K. The simulations closest to their observations for these stars were for low masses (less than 0.7 M⊙), temperatures around 3300 K and very high He to H ratios (more than 103). These stars seem to be good candidates to look for HeH+. HeH+ appears to have been largely neglected in atmospheric models for cool white dwarfs (Stancil 1994, Bergeron et al. 2001). A study on the effects of including HeH+ in cool helium rich white dwarfs will be presented elsewhere (Harris et al. 2005).
ACKNOWLEDGEMENT
We thank Tony Lynas-Gray for helpful discussions, the UK Particle Physics and Astronomy Research Council (PPARC) and the Engineering and Physical Sciences Research Council (EPSRC) for funding. EAE is also grateful to the Rgion Rhne Alpes for supporting her visit to University College London.
References
- Adams & Smith (1981) Bergeron P., Leggett S.K., 2002, ApJ, 580: 1070-1076
- Adams & Smith (1981) Bergeron P., Leggett S.K., Ruiz M. T., 2001, ApJS, 133: 413-449
- Adams & Smith (1981) Bishop D.M., Cheung L.M., 1979, J. Molec. Spect., 75, 462-473
- Adams & Smith (1981) CDS, Centre de Donnes astrnomiques de Strasbourg, France, http://cdsweb.u-strasbg.fr/
- Adams & Smith (1981) Cecchi-Pestellini C., Dalgarno A., 1993, ApJ, 413: 611-618
- Adams & Smith (1981) Christlieb N., Bessell M. S., Beers T. C., Gustafsson B., Korn A., Barklem P. S., Karlsson T., Mizuno-Wiedner M., Rossi S., 2002, Nature, 419, 904
- Adams & Smith (1981) Coc A., Viangioni-Flam E., Descouvemont P., Adahchour A., Angulo C., 2004, ApJ, 600: 544-552
- Adams & Smith (1981) Coxon J.A., Hajigeorgiou P.G., 1999, J. Molec. Spect., 193, 306-318
- Adams & Smith (1981) Dabrowski I., Herzberg G., 1976, Transaction New York Academy of Sciences
- Adams & Smith (1981) Faure A., Tennyson J., 2001, MNRAS 325, 443-448
- Adams & Smith (1981) Green T.A., Browne J.C., Michels H.H., Madsen M.M., 1974, J. Chem. Phys., vol. 61, No 12
- Adams & Smith (1981) Harris G.J., Polyansky O.L., Tennyson J., 1998, J. Chem. Phys., vol. 109, No 17
- Adams & Smith (1981) Harris G.J., 2002, An ab initio HCN/HNC Rotational-Vibrational Line List and Opacity Function for Astronomy. Thesis, department of Physics and Astronomy, University College London, University of London
- Adams & Smith (1981) Harris G.J., Lynas-Gray A.E., Miller S., Tennyson J., 2004, ApJ, 600: 1025-1034
- Adams & Smith (1981) Harris G.J., Lynas-Gray A.E., Miller S., Tennyson J., 2005, ApJ Lett, submitted.
- Adams & Smith (1981) Irwin A.W,. 1981, ApJ Suppl, 45 621, Klashlinsky A., Rees M.J., 1983, MNRAS, 205, 995
- Adams & Smith (1981) Klashlinsky A., Rees M.J., 1983, MNRAS, 205, 995
- Adams & Smith (1981) Kolos W., Peek J.M., 1976, Inter. J. Quant. Chem., vol. X,217-224
- Adams & Smith (1981) Kolos W., 1976, J. Chem. Phys., 12 381-386
- Adams & Smith (1981) Kurucz, R. L., 1970, Smithsonian Obs. Spec. Rep. No. 308.
- Adams & Smith (1981) Kurucz R.L., 1993, in IAU Colloq, 138, Peculiar versus Normal Phenomena in A-Type and Related Stars, ed. Dworetsky M.M., Castelli F., Faraggiana R. (ASP Conf. Ser. 44; San Fransisco: ASP), 87
- Adams & Smith (1981) Kurucz R.L., 2000, http://kurucz.harvard.edu/linelists.html
- Adams & Smith (1981) Lebedev V.S., Presnyakov L.P., Sobel’man I.I., 2000, Astron. Rep., 44, 338
- Adams & Smith (1981) Lenzuni P., Chernoff F.P., Salpeter E.E., 1991, ApJ, 76: 759-801
- Adams & Smith (1981) Lepp S., Stancil P.C., Dalgarno A., 2002, J. Phys. B35, R57
- Adams & Smith (1981) Le Roy R.J., 2002, LEVEL 7.5, University of Waterloo Chemical Physics Research Report CP-655 and http://scienide.uwaterloo.ca/ leroy/level/
- Adams & Smith (1981) Liu X.-W., Barlow M.J., Dalgarno A., Tennyson J., Lim T., Swinyard B.M., Cernicharo J., Cox P., Baluteau J.-P., P quignot D., Nguyen-Q-Rieu, Emery R.J., Clegg P.E., 1997, MNRAS, 290, L71-L75
- Adams & Smith (1981) Miller S., Tennyson J., Lepp S., Dalgarno A., 1992, Nature, 355, 420
- Adams & Smith (1981) Moorhead J.M., lowe R.P., Maillard J.-P.,Wehlau W.H., Bernath P.F., 1988, ApJ, 326: 899-904
- Adams & Smith (1981) Morel P., 1997, AA, 124, 597
- Adams & Smith (1981) Morel P., Baglin A., 1999, AA, 345, 156
- Adams & Smith (1981) Rabadan I., Sarpal B.K., Tennyson J., 1998, MNRAS, 299, 171-175
- Adams & Smith (1981) Saenz A., 2003, Phys. Rev. A 67, 033409
- Adams & Smith (1981) Saio H., Jeffery C.S., 2000, MNRAS, 313,671
- Adams & Smith (1981) Sauval A.J., Tatum J.B., 1984, ApJS, 56: 193-209
- Adams & Smith (1981) Stancil P.C., 1994, ApJ, 430, 360
- Adams & Smith (1981) Zygelman B., Stancil P.C., Dalgarno A., 1998, ApJ, 508: 151-156