MASS SEGREGATION AND THE INITIAL MASS FUNCTION OF SUPER–STAR CLUSTER M82-F11affiliation: Based on observations made at the W.M. Keck Observatory, which is operated as a scientific partnership among the California Institute of Technology, the University of California and the National Aeronautics and Space Administration. The Observatory was made possible by the generous financial support of the W.M. Keck Foundation.
Abstract
We investigate the Initial Mass Function and mass segregation in super–star cluster M82-F with high resolution Keck/NIRSPEC echelle spectroscopy. Cross-correlation with template supergiant spectra provides the velocity dispersion of the cluster, enabling measurement of the kinematic (virial) mass of the cluster when combined with sizes from NICMOS and ACS images. We find a mass of based on near-IR light and based on optical light. Using PSF-fitting photometry, we derive the cluster’s light-to-mass () ratio in both near-IR and optical light, and compare to population synthesis models. The ratios are inconsistent with a normal stellar initial mass function for the adopted age of 40–60 Myr, suggesting a deficiency of low-mass stars within the volume sampled. King model light profile fits to new HST/ACS images of M82-F, in combination with fits to archival near-IR images, indicate mass segregation in the cluster. As a result, the virial mass represents a lower limit on the mass of the cluster.
1 Introduction
Star formation in starburst galaxies can be resolved into young, dense, massive “super–star clusters” (SSCs) that represent a substantial fraction of new stars formed in a burst event (Meurer et al. 1995; Zepf et al. 1999). SSCs identified from the ground two decades ago (e.g., Arp & Sandage 1985; Melnick et al. 1985) have been spatially resolved in the nearest cases by the Hubble Space Telescope (HST) during the last decade using WFPC in visible light (e.g., O’Connell et al. 1994; Whitmore & Schweizer 1995).
Optical studies of SSCs in dusty star forming regions are hampered by high extinction. The development over the past decade of new high spatial resolution near-infrared imaging and high spectral resolution spectroscopic instruments, including NICMOS aboard HST and the NIRSPEC spectrometer at the W. M. Keck Observatory, has led to a wealth of new data on SSCs. In the optical, the Advanced Camera for Surveys (ACS) imager on HST has substantially improved resolution over the standards set by WFPC2. These new instruments have enabled direct measurement of structural parameters and determination of virial masses for even heavily reddened, optically-invisible clusters.
In addition to being a significant mode of star formation in starburst galaxies, SSCs are important for study of the formation of high mass stars, galaxy stellar populations and evolution, and physical conditions analogous to high-redshift star formation. Numerical simulations by Portegies Zwart et al. (2004) further suggest that runaway mergers of high mass stars deep in the potential well of dense SSCs lead to the creation of intermediate-mass black holes, a possible missing link between stellar mass black holes and the supermassive black holes found in the centers of galaxies. Especially important is the stellar initial mass function (IMF), for which SSCs are ideal laboratories: coeval populations with enough stars to extensively sample the IMF. Critical to understanding the IMF is detection of low-mass stars, the light of which is swamped by high luminosity supergiants. Measurement of the kinematic mass of the clusters represents the only means of detecting and quantifying the contribution of low-mass stars.
At a distance of Mpc (Freedman et al. 1994), M82 is the nearest massive starburst galaxy. Lipscy & Plavchan (2004) find that at least 20% of the star formation in M82 is occuring in SSCs. The galaxy’s high inclination of 81∘ (Achtermann & Lacy 1995) and prevalent dust lead to large, patchy extinction; near-IR observations are required to overcome this obstacle in characterizing the SSC population. The nuclear starburst in M82 contains over 20 SSCs that are prominent in the near-infrared, with typical ages of years (Förster Schreiber 1998). These young, massive clusters offer an excellent opportunity to search for variations in the IMF.
Early studies (Rieke et al. 1980; McLeod et al. 1993) of the IMF in the M82 starburst used ground-based observations and were necessarily global in scale; these studies indicated an abnormal IMF for the starburst. An influential work by Rieke et al. (1993) used population synthesis models to constrain the IMF. They concluded that the large -band luminosity of the M82 starburst relative to the dynamical mass required the IMF to be significantly deficient in low-mass stars () relative to the solar neighborhood.
Local examination of star formation regions on the scale of individual SSCs provides an important test for the assertion of an abnormal, “top-heavy” IMF. Satyapal et al. (1997) used -resolution near-IR images to identify pointlike sources and found that at this scale starburst models could match observations without invoking a high-mass biased IMF. McCrady et al. (2003) used high-resolution () HST/NICMOS images and near-IR Keck/NIRSPEC spectroscopy to measure the kinematic (virial) masses of two individual near-IR-bright super–star clusters in the nuclear starburst. Comparison of derived light-to-mass ratios and population synthesis models indicate that cluster MGG-9 has a normal IMF, while MGG-11 may be deficient at the 1- level in low-mass stars ( M⊙). This work indicates that the IMF may vary on the scale of individual clusters, and bears on the ongoing debate over the role of physical conditions in a star formation environment in determining the mass distribution function of newly-formed stars.
The brightest optically-visible cluster within 500 pc of the center of the galaxy is M82-F. Smith & Gallagher (2001, hereafter SG01) studied the cluster in detail using optical spectra and HST/WFPC2 images to estimate the cluster’s virial mass. Based on population synthesis models, they determined that M82-F is too luminous for its assumed age, and must therefore have a top-heavy IMF. With most of its mass in stars of M⊙ and a deficiency of long-lived, low-mass stars, the authors suggested that the cluster is “doomed” and will begin to dissolve due to stellar evolution over the next 1–2 Gyr. We examine some of the limitations of their data in Section 4.4. SG01 noted the possibility that their data could instead reflect mass segregation, which would lead to underestimation of the cluster’s mass. Using NICMOS images, McCrady et al. (2003) measured a smaller radius for M82-F in near-IR images, suggesting that observed light-to-mass ratios may be systematically overestimated due to mass segregation.
Mass segregation cannot be observed directly via star counts for clusters in which individual stars are unresolved. However, Sternberg (1998) notes that a mass-segregated cluster should appear smaller in the UV and IR (light dominated by red supergiant stars) than in the optical (where the light is dominated by intermediate-mass main sequence stars).
In this paper, we characterize the IMF of the super star cluster M82-F and investigate indications of mass segregation. We measure the cluster stellar velocity dispersion using new high spatial resolution Keck/NIRSPEC echelle spectra and present analysis of new, high-resolution, multi-waveband optical images of the cluster from the High Resolution Camera on the HST Advanced Camera for Surveys (ACS). As discussed in Section 3, these new images represent a significant improvement in the characterization of the physical structure of M82-F. We fit two-dimensional light profiles to the cluster in the ACS and archival HST/NICMOS images, and derive the kinematic mass and light-to-mass ratio. Section 2 describes the observations used in this work, Section 3 presents analysis of the data and determination of key cluster parameters, and Section 4 discusses mass segregation and the form of the IMF in M82-F.
2 Observations
We observed super star cluster M82-F (MGG-F) with the 10-m Keck II telescope on 2003 January 19, using the facility near-infrared echelle spectrometer NIRSPEC. We obtained high-resolution (), cross-dispersed spectra in the wavelength range 1.51–1.75 m using the NIRSPEC-5 order-sorting filter. The data fall in seven echelle orders, ranging from through 50. The cluster was nodded along the slit, with successive nods separated by arcsec (seeing was ). Seven separate integrations, each 600 seconds in duration, provided a total time of 4200 seconds on the cluster. The spectra were dark subtracted, flat-fielded and corrected for cosmic rays and bad pixels. The curved echelle orders were then rectified onto an orthogonal slit-position/wavelength grid based on a wavelength solution from sky (OH) emission lines. Each pixel in the grid has a width of nm. We sky-subtracted by fitting third-order polynomials to the two dimensional spectra column-by-column.
The spectra were extracted using Gaussian weighting functions matched to the wavelength-integrated cluster profile. Atmospheric calibration was performed using the spectrum of HD 173087, a B5V star. The calibration star was observed at an airmass of 1.94, consistent with the airmass range (1.76–2.07) of the M82-F observations. To account for photospheric absorption features (particularly Brackett series and helium lines) and continuum slope, the calibration star spectrum was divided by a spline function fit. The resulting atmospheric absorption spectrum was divided into the cluster spectra to recover absorbed flux. The individual extracted spectra have an average signal-to-noise ratio (S/N) of per pixel and S/N per pixel when all integrations are combined. For comparison, the optical spectra used in SG01 have S/N per pixel of 15–25.
For photometric measurements and structural parameters, we obtained new high-resolution optical images of M82-F. The images were taken 2002 June 7 with the ACS High Resolution Camera (HRC) in the F435W, F555W and F814W filters (corresponding approximately to the Johnson , and filters). Exposure times for the images are 1320 seconds, 400 seconds, and 120 seconds, respectively. Additional observations in the F250W filter were taken on 2003 Jan 20, with exposure time of 10,160 seconds. ACS/HRC has a plate scale of 25 mas per pixel and is thus critically sampled at 477 nm. We relied on pipeline reduction (CALACS) for bias correction, dark subtraction and flatfielding. The resulting set of “FLT” images were processed with the Multidrizzle package (Koekemoer et al. 2002) to reject cosmic rays, mask bad pixels and create a “drizzled” image for each filter, corrected for geometric distortions.
In the near-IR, we used archival HST/NICMOS images in the F160W and F222M filters. For details on these data and their reduction, see McCrady et al. (2003).
3 Analysis
3.1 Stellar Velocity Dispersion
To derive the kinematic mass of a cluster using the virial theorem, we need a measurement of the internal velocity dispersion in the cluster and a characteristic radius. Figure 1 shows a portion of the NIRSPEC echelle spectrum of M82-F, compared to a series of template supergiant spectra. Features found in the spectra of supergiant stars are readily identified in the cluster spectrum, although they appear “washed out” due to the stellar velocity dispersion. Especially prominent are the rovibrational CO bandheads and numerous Fe and OH lines. We have assembled an atlas of high-resolution NIRSPEC spectra of supergiant stars for use in cross-correlation analysis (McCrady et al. 2003), from which we determine the dominant spectral type and line-of-sight velocity dispersion. Based upon the peak of the cross-correlation function (Figure 2), the -band spectrum of M82-F most closely matches spectral types in the range of K4I–M0I. The line-of-sight velocity dispersion based on cross-correlation with templates in this range is km s-1. The value of decreases as a function of the similarity to the template spectrum as measured by the peak value of the cross-correlation function. It is therefore possible that the stated value reflects some template mismatch bias due to our limited template spectra atlas, but this effect is small ( 0.5 km s-1).
3.2 Cluster Size and Mass
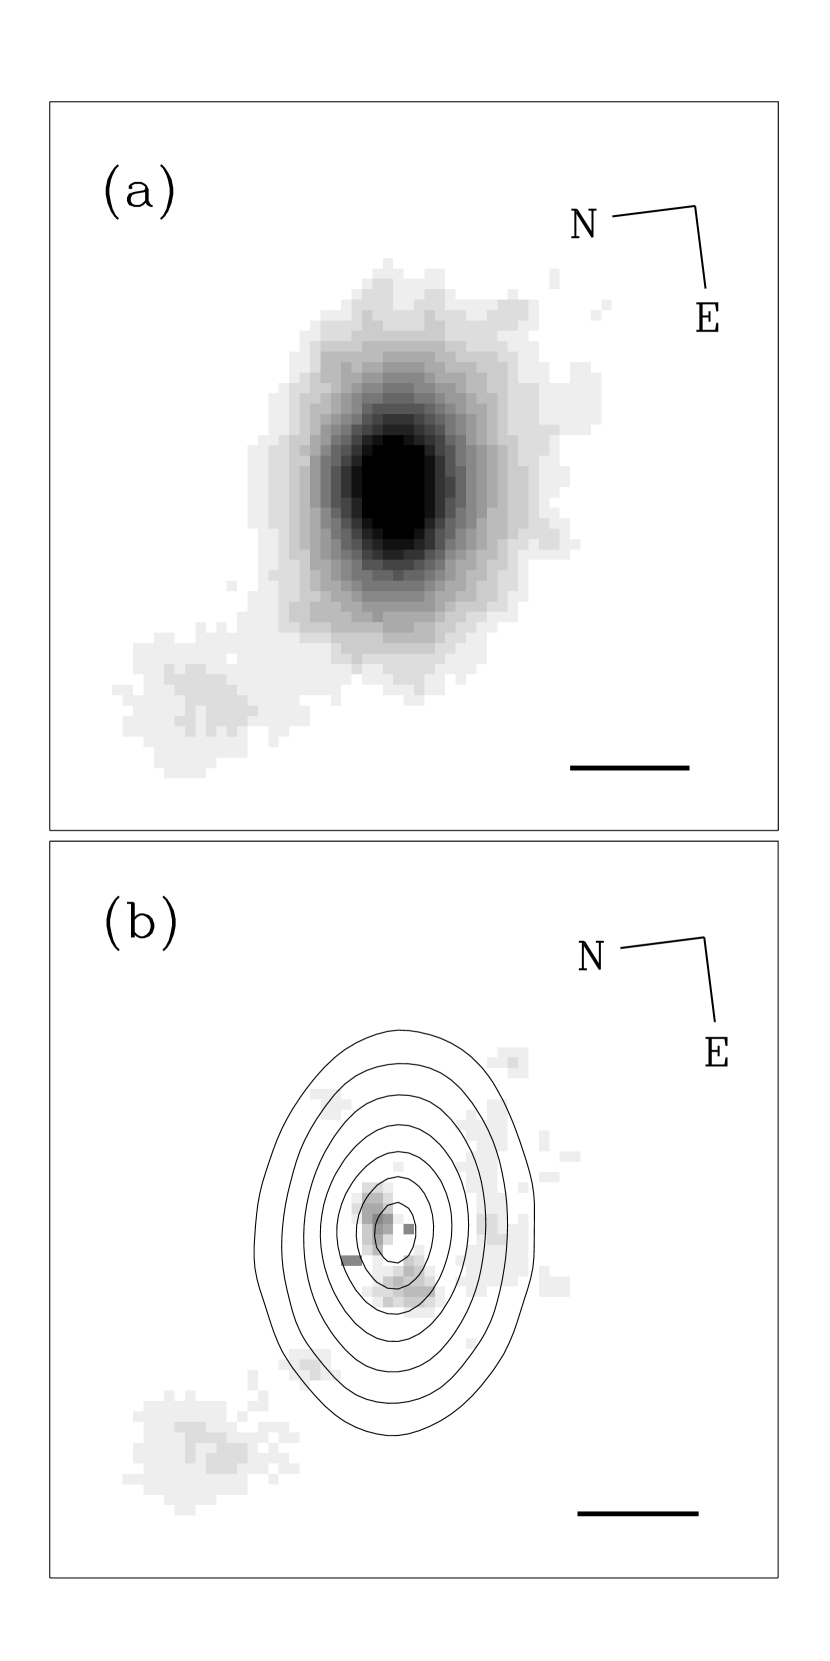
The simplest approach to determine the cluster mass is to measure the half-light radius, assume that light traces mass, the cluster is spherical, and the velocity dispersion is isotropic, then apply the virial theorem. M82-F presents a difficulty for this method: HST images (Figure 3) clearly show that the cluster is elliptical in projection and cannot, therefore, be spherical. To measure the radius, we fit the cluster using an elliptical version of the empirical King (1962) model:
| (1) |
where and are the characteristic lengths of the minor and major axes, respectively, is a scaling constant and acts as a “tidal radius,” truncating the profile beyond a particular scale length. The fit therefore has four free parameters (, , and ) to describe the light profile and three more to describe the centroid location and position angle. The King model is convolved with a model PSF from Tiny Tim (Krist 1995) and compared to the image. Fit parameters are determined by iterative search over parameter space, using a Levenburg-Marquardt least-squares fit. Figure 3 shows the fit and residuals for the ACS/HRC F814W image of M82-F.
The half-light radius in projection along the major axis, , is the semimajor axis of the ellipse that encloses half the flux in the fitted King model. We determine numerically by summing the flux in a series of ellipses with the axial ratio defined by and . Monte Carlo simulations of clusters indicate that , and are significantly covariant; however, the fitted projected half-light radius along a given axis is accurate to about 2 percent. The half-mass radius may be determined by assuming that light traces mass and deprojecting by dividing by 0.766 (Spitzer 1987).
McCrady et al. (2003) fit a spherical King model to M82-F in the NICMOS F160W image and found a projected half-light radius of mas. Our elliptical King function fit to the same image found along the major axis and along the minor axis. At the adopted distance of M82, the projected half-light radii along the major and minor axes are thus pc and pc, respectively.
To account for the ellipticity of the cluster, we assume it is an oblate spheroid and compute the gravitational potential assuming that the cluster is homoeoidal (Binney & Tremaine 1987, Section 2.3). The numerical constant in the virial mass formula may be separated into factors dependent upon the central concentration and the ellipticity. The compact core plus extended envelope structure of star clusters is similar to an polytrope (Spitzer 1987, p. 13). For an polytropic oblate ellipsoid with an isotropic velocity dispersion, the virial mass is:
| (2) |
where the eccentricity is , and and are the equatorial and polar radii of the oblate spheroid, respectively. Figure 4 shows the fitted cluster half-light radii in projection along the major and minor axes for the NICMOS and ACS images. The observed axial ratio, , represents a lower bound on the ratio ; an oblate cluster will appear rounder than its intrinsic shape unless viewed directly along the equatorial plane. Averaging over all possible inclinations, we find that the observed axial ratio of corresponds to a most-likely intrinsic axial ratio of with . We represent the uncertainty on the viewing inclination as the difference between the angle-averaged value and the lower bound.
We believe the ellipticity of the cluster is intrinsic, rather than the result of differential reddening. Extinction is very low at 2.2 m, and therefore the observed shape in the F222M images is very likely intrinsic. Moreover, the axial ratio is constant within the uncertainties across all wavebands from 0.4 to 2.2 m (Figure 4). If the ellipticity were due to the distribution of dust around the cluster, the axial ratio should change as a function of wavelength as the extinction is expected to vary significantly between and . The axial ratio does appear to increase sharply at the shortest HST/ACS waveband (F250W). We interpret this as a result of scattering of cluster light by dust outside the cluster. The ACS images show strong spatial variations in extinction in the immediate vicinity of M82-F. Scattering and absorption in the ultraviolet compromise the quality of the fit to the light profile at very short wavelengths.
Combining the NIRSPEC velocity dispersion with the NICMOS radius and estimated eccentricity, we calculate an -band virial mass of M⊙ for M82-F. The subscript on the mass is used to emphasize that the virial mass is computed from a velocity dispersion and size measured in the band. In this manner we minimize systematic errors by measuring both variables from the light of the same stars and may seek variations between different wavebands.
3.3 Optical Results & Photometry
SG01 found a velocity dispersion of km s-1 for M82-F based on cross-correlation analysis using cluster spectra in the 601–759 nm range (overlapping the ACS F814W bandpass). They concluded that the cluster spectrum most closely matches their template K stars, consistent with the Starburst99 prediction that K II stars dominate the spectrum at the inferred cluster age (discussed in Section 4.1). We adopt these results to measure the cluster mass with optical data.
In the ACS F814W image, we measure a half-light radius of mas. Using this value and the SG01 velocity dispersion, we find an -band virial mass of M⊙ for M82-F. This is significantly lower than the optically-derived SG01 mass estimate of M⊙ due to more accurate measure of the cluster’s half-light radius (see Section 4.4).
Photometry was derived by integrating over the fitted King models and applying the appropriate conversion factors for each instrument and filter. Details of the PSF fitting photometry and spectral energy distribution are presented in a companion paper (Vacca et al. in prep.). The observed cluster in-band luminosities as defined in McCrady et al. (2003), not corrected for extinction, are L⊙ and L⊙.
4 Discussion
By comparing the derived light-to-mass () ratio of M82-F to population synthesis models, we may characterize the IMF of the cluster. Critical to this analysis are the cluster age and line-of-sight extinction.
4.1 Age
The spectrum of M82-F immediately places upper and lower bounds on the cluster’s age. There is no evidence of nebular emission in the - or -band, which indicates the absence of O stars and a minimum cluster age of 6–7 Myr. Förster Schreiber (1998) finds none of the features expected of AGB stars for the nuclear region of M82, setting an upper limit of years. For more precise limits on the age, we turn to population synthesis modelling. As noted in Section 3, the F160W light of M82-F most closely matches template spectral types in the range of K4I–M0I. Gilbert (2002) used Starburst99 population synthesis models to determine the flux-weighted average spectral type as a function of age for coeval stellar populations. In the -band, the cluster light is dominated by K4–M0 stars for a brief period around 15 Myr and during the ages of 40–60 Myr. SG01 used Starburst99 models to fit the H and He I absorption profiles in optical spectra. They found that the best fits to the wings of the Balmer line and depth of the helium line suggest an age of Myr. This is consistent with the dominant spectral type of the -band light, and we therefore adopt an age range of 40–60 Myr for M82-F.
4.2 Extinction
SG01 used photometry to determine line-of-sight extinction of . Applying the Cardelli et al. (1989) extinction law () to the this value gives and .
As an independent test, we calculate synthetic colors for the near-IR dominant evolved K4–M0 stars based on the Pickles (1998) stellar spectral library. The synthetic [F160W] [F222M] color for a K4I star is 0.35, versus 0.52 for M0I. From our photometry, we find [F160W] [F222M] = for M82-F, at the blue end of the expected color range. This implies that -band extinction to M82-F is quite small, essentially negligible.
The optical (600-800 nm) light of the cluster is expected to be dominated by KII stars (SG01). Synthetic [F555W] [F814W] colors for these stars in the Pickles library range from 1.19 to 1.45, versus the measured for M82-F. For a standard () interstellar extinction curve, this color excess gives to 0.66 mag.
To calculate the light-to-mass ratio, we need to deredden the cluster. We adopt extinction of and based on the synthetic photometry results. For sake of comparison, Figure 5 reflects both these estimates and the extinctions implied by the SG01 estimate of .
The Galactic dust map of Schlegel et al. (1998) indicates Galactic extinction along the line of sight to M82-F of , and . This provides a cross-reference for the estimated extinction.
4.3 The IMF
We determine the luminosity and virial mass of the cluster independent of any assumptions about the IMF. This is in contrast to photometric mass determinations, which are based on cluster colors and ages and must therefore assume an IMF. Our method enables us to constrain the cluster IMF by comparing observed light-to-mass ratios in various wavebands to population synthesis models (Sternberg 1998; McCrady et al. 2003).
By applying the adopted extinction corrections for M82-F, we find de-reddened light-to-mass ratios of (L⊙/M⊙) at 1.6m and at 0.8m. Figure 5 compares the measured ratio to population synthesis model predictions for two fiducial IMF forms. We used Starburst99 version 4.0, with an instantaneous burst, solar metallicity (McLeod et al. 1993) and the Hillier & Pauldrach atmosphere models. The derived ratio of M82-F is too high for the standard Kroupa (2001) IMF over the full range of stellar masses (0.1–100 M⊙). Rather it appears that the cluster’s IMF is deficient in low-mass stars. For example, the ratio is roughly consistent with a Salpeter (1955) IMF truncated at a lower mass of about 2 M⊙. If the cluster age were approximately 15 Myr, the derived ratios would be consistent with the Kroupa IMF; an independent determination of the cluster’s age could rule out this possibility.
In our analysis we assume a particular form for the IMF (i.e., Kroupa or Salpeter power laws) and modify the lower-mass cutoff to generate the observed ratio at the adopted age. This method allows us to test the top-heavy IMF hypothesis — if the observed ratio is fit with an IMF extending down to 0.1 M⊙, as in cluster MGG-9 in McCrady et al. (2003), there is no need to invoke an abnormal IMF. In the present case, a normal (Kroupa) IMF cannot explain the relatively large ratio of the cluster. An elevated lower-mass cutoff is not required, however. The observed ratios could be caused at the cluster’s age by flattening the slope of the IMF, which would change the relative proportions of stellar masses. Although our data do not distinguish between changes to the lower mass cutoff or IMF slope, it is evident that the IMF is different than the Kroupa form, and different from other nearby SSCs in the M82 nuclear starburst.
A similar study has been conducted by Mengel et al. (2002) in the Antennae (NGC 4038/4039). They determined virial masses and light-to-mass ratios for a sample of five bright SSCs, and compared the results to various IMF forms using population synthesis models. The clusters studied by Mengel et al. appear to exhibit a range of IMFs, with some evidence of dependence on location within the merger environment. In contrast, Larsen et al. (2004) measured virial masses for five clusters in nearby galaxies and found light-to-mass ratios consistent with a Kroupa or Salpeter IMF. They found no evidence for a deficiency of low-mass stars in these clusters.
4.4 Optical Images
The ACS observations, designed specifically to study the properties of M82-F, represent a significant advance in quality over all earlier optical images. O’Connell et al. (1995) imaged the cluster with the pre-repair mission Planetary Camera in 1992. The cluster fell at the edge of or between chips on the detector in their - and -band equivalent images, and they deemed their -band deconvolution “not highly reliable.” SG01 used archival WFPC2 images in the F439W, F555W and F814W filters (de Grijs et al. 2001). These images were designed for a separate study of M82, and were not ideal for M82-F. The cluster fell on the WF4 CCD, and were significantly undersampled due to the 100-mas pixels. The two longer-wavelength images were both saturated in the cluster core. The ACS/HRC images used exposure times specifically designed for study of M82-F, and with 25 mas pixels, are critically sampled above 477 nm. SG01 did not deconvolve the PSF from the WFPC2 F439W image, instead estimating the broadening heuristically. By contrast, we treated the PSF more rigorously using a model PSF as described in Section 2. Both the O’Connell et al. (1995) and SG01 studies found a projected half-light radius of mas for M82-F, using images at 555 nm and 439 nm, respectively. Our fits to the major axis of the cluster in ACS/HRC images yield significantly smaller projected half-light radii of mas and mas at 555 nm and 435 nm, respectively. These values are more precise and more accurate than the radii determined from the lower-resolution optical data in earlier works.
4.5 Mass Segregation
The axial ratio of M82-F is in all but the shortest wavelength image (Figure 4). Fits to the images show a distinct trend of decreasing cluster size with increasing wavelength. Light at shorter wavelengths is increasingly dominated by hotter stars still on the main sequence. In a coeval population, these stars will be intermediate mass stars. Longer wavelength light is dominated by cooler evolved stars, stars originally more massive than those at the cluster’s main sequence turnoff point. The negative correlation between cluster size and observed wavelength suggests that the massive red evolved stars that dominate the near-IR light are more centrally concentrated than the intermediate-mass main sequence stars which dominate the optical light (Sternberg 1998).
A key assumption of our method is that light traces mass within the cluster. Mass segregation renders the interpretation of the light-to-mass ratio problematic. The near-IR measurements presented here trace the light of supergiant stars — the most massive stars currently present in the cluster. If there is mass segregation, the near-IR virial measurement probes only the core of the cluster, i.e., mass contained within the volume populated by these highest-mass stars. As such, the derived mass would be a lower limit and the IMF of the entire cluster may follow the Kroupa form. In this case, the IMF measured in the core would appear “top-heavy” because of mass segregation. A nearby example of this effect is the young, massive cluster R136 in the 30 Doradus nebula in the Large Magellanic Cloud (LMC). Brandl et al. (1996) found that the mass function in R136 steepens with increasing distance from the cluster center, indicating strong mass segregation.
At the adopted cluster age, stars more massive than M⊙ have exploded as supernovae, and stars in the 6–8 M⊙ range have evolved off the main sequence (Schaller et al. 1992). If we assume that the core consists solely of stars that are (and remnants of progenitors which were) larger than 2 M⊙ as indicated by the ratio, integration of the Kroupa IMF implies that the measured core mass represents only one-third of the current cluster mass. The remaining stars (with masses smaller than 2 M⊙) would be distributed outside the core. This distribution of stars would thus require a total cluster mass of M⊙ to be consistent with a Kroupa IMF for the population of the entire cluster.
Mass segregation is generally associated with the gradual equipartition of energy via stellar encounters in old globular clusters (Spitzer 1987). High mass stars sink to the center of a cluster through dynamic interactions over the course of the relaxation time, typically of order years for a globular cluster. We do not expect M82-F to exhibit mass segregation over its full extent at its adopted age. If we assume an average stellar mass of 0.87 M⊙ for a full Kroupa IMF, the half-mass relaxation time (Meylan 1987) for M82-F is years — roughly an order of magnitude longer than the cluster’s current age.
Recent studies, however, have found evidence of mass segregation in significantly younger clusters. Hillenbrand & Hartmann (1998) found that the highest mass stars in the 0.8 Myr-old Orion Nebula Cluster are preferentially located in the cluster center, and that stars down to 0.3 are less centrally concentrated than more massive stars within the inner 1.0 pc. The massive cluster R136 is mass segregated at an age of only 3 Myr (Brandl et al. 1996). Less massive LMC clusters NGC 1805 (de Grijs et al. 2002a), NGC 1818, NGC 2004 and NCG 2100 (Gouliermis et al. 2004) as well as NGC 330 (Sirianni et al. 2002) in the Small Magellanic Cloud all display mass segregation at ages of 10–50 Myr.
Numerical simulations demonstrate that segregation of a cluster’s most massive stars occurs much more rapidly than the half-mass relaxation time (Gerhard 2000). Indeed, if high mass stars are somehow concentrated at the center of the cluster at the time of formation, the relaxation timescale there will be shorter. Dynamical mass segregation will thus proceed more rapidly at the core, on the order of a few crossing times (de Grijs et al. 2002a). Based on the measured velocity dispersion and half-light radius, the crossing time for M82-F is years. This is significantly less than the age of the cluster, which implies that the core has had time to undergo mass segregation. de Grijs et al. (2002b) showed that the cores of SSCs may undergo significant dynamical evolution in as little as 25 Myr. The young age of M82-F relative to its half-mass relaxation time may therefore imply rapid mass segregation for the massive stars or support aggregation (Bonnell & Bate 2002) as a mechanism for high mass star formation.
5 Summary
We present new, high resolution Keck/NIRSPEC echelle spectrometry and new HST/ACS imaging of the super–star cluster M82-F. The main results of this study are:
-
1.
Measuring the stellar velocity dispersion and half-light radius of the cluster in the -band, we find a virial mass of M⊙ within the half-light radius. In the -band we find a mass of M⊙, which supersedes the larger value quoted by SG01.
-
2.
The cluster’s light-to-mass ratio in the - and -bands are inconsistent with a Kroupa IMF over the full range of stellar masses from 0.1 to 100 M⊙. This may be due to a top-heavy IMF, with a lower mass cutoff of about 2 M⊙.
-
3.
The cluster is successively larger at each shorter wavelength imaged. We interpret this result as due to mass segregation, even at cluster’s young age of about 50 Myr.
-
4.
Mass segregation tends to overstate the ratio, as our observations of -band light are insensitive to the mass of stars at radii larger than the volume occupied by red supergiant stars. As such, the measured mass represents a lower limit on the mass of the entire cluster.
-
5.
The IMF of M82-F differs from the IMF of nearby SSC MGG-9. The IMF in the nuclear starburst of M82 thus varies from cluster to cluster. This may be due to either IMF variation that is inconsistent with a single, “universal” form or the degree of mass segregation within individual clusters.
References
- Achtermann & Lacy (1995) Achtermann, J. M. & Lacy, J. H. 1995, ApJ, 439, 163
- Arp & Sandage (1985) Arp, H. & Sandage, A. 1985, AJ, 90, 1163
- Binney & Tremaine (1987) Binney, J. & Tremaine, S. 1987, Galactic dynamics (Princeton, NJ, Princeton University Press)
- Bonnell & Bate (2002) Bonnell, I. A. & Bate, M. R. 2002, MNRAS, 336, 659
- Brandl et al. (1996) Brandl, B., Sams, B. J., Bertoldi, F., Eckart, A., Genzel, R., Drapatz, S., Hofmann, R., Loewe, M., & Quirrenbach, A. 1996, ApJ, 466, 254
- Cardelli et al. (1989) Cardelli, J. A., Clayton, G. C., & Mathis, J. S. 1989, ApJ, 345, 245
- de Grijs et al. (2002a) de Grijs, R., Gilmore, G. F., Johnson, R. A., & Mackey, A. D. 2002a, MNRAS, 331, 245
- de Grijs et al. (2002b) de Grijs, R., Johnson, R. A., Gilmore, G. F., & Frayn, C. M. 2002b, MNRAS, 331, 228
- de Grijs et al. (2001) de Grijs, R., O’Connell, R. W., & Gallagher, J. S. 2001, AJ, 121, 768
- Förster Schreiber (1998) Förster Schreiber, N. M. 1998, PhD thesis, Lugwig-Maximilians-Universität München
- Freedman et al. (1994) Freedman, W. L., Hughes, S. M., Madore, B. F., Mould, J. R., Lee, M. G., Stetson, P., Kennicutt, R. C., Turner, A., Ferrarese, L., Ford, H., Graham, J. A., Hill, R., Hoessel, J. G., Huchra, J., & Illingworth, G. D. 1994, ApJ, 427, 628
- Gerhard (2000) Gerhard, O. 2000, in ASP Conf. Ser. 211: Massive Stellar Clusters, ed. A. Lançon & C. M. Boily (San Francisco: ASP), 12
- Gilbert (2002) Gilbert, A. M. 2002, PhD thesis, Univ. of California, Berkeley
- Gouliermis et al. (2004) Gouliermis, D., Keller, S. C., Kontizas, M., Kontizas, E., & Bellas-Velidis, I. 2004, A&A, 416, 137
- Hillenbrand & Hartmann (1998) Hillenbrand, L. A. & Hartmann, L. W. 1998, ApJ, 492, 540
- King (1962) King, I. 1962, AJ, 67, 471
- Koekemoer et al. (2002) Koekemoer, A. M., Fruchter, A. S., Hook, R. N., & Hack, W. 2002, in The 2002 HST Calibration Workshop, ed. S. Arribas, A. Koekemoer, & B. Whitmore (Baltimore: STScI), 339
- Krist (1995) Krist, J. 1995, in ASP Conf. Ser. 77: Astronomical Data Analysis Software and Systems IV, ed. R. Shaw, H. E. Payne, & J. E. Hayes, Vol. 4 (San Francisco: ASP), 349
- Kroupa (2001) Kroupa, P. 2001, MNRAS, 322, 231
- Larsen et al. (2004) Larsen, S. S., Brodie, J. P., & Huner , D. A. 2004, AJ, in press (astro-ph/0407373)
- Lipscy & Plavchan (2004) Lipscy, S. J. & Plavchan, P. 2004, ApJ, 603, 82
- McCrady et al. (2003) McCrady, N., Gilbert, A. M., & Graham, J. R. 2003, ApJ, 596, 240
- McLeod et al. (1993) McLeod, K. K., Rieke, G. H., Rieke, M. J., & Kelly, D. M. 1993, ApJ, 412, 111
- Melnick et al. (1985) Melnick, J., Moles, M., & Terlevich, R. 1985, A&A, 149, L24
- Mengel et al. (2002) Mengel, S., Lehnert, M. D., Thatte, N., & Genzel, R. 2002, A&A, 383, 137
- Meurer et al. (1995) Meurer, G. R., Heckman, T. M., Leitherer, C., Kinney, A., Robert, C., & Garnett, D. R. 1995, AJ, 110, 2665
- Meylan (1987) Meylan, G. 1987, A&A, 184, 144
- O’Connell et al. (1994) O’Connell, R. W., Gallagher, J. S., & Hunter, D. A. 1994, ApJ, 433, 65
- O’Connell et al. (1995) O’Connell, R. W., Gallagher, J. S., Hunter, D. A., & Colley, W. N. 1995, ApJ, 446, L1
- Pickles (1998) Pickles, A. J. 1998, PASP, 110, 863
- Portegies Zwart et al. (2004) Portegies Zwart, S. F., Baumgardt, H., Hut, P., Makino, J., & McMillan, S. L. W. 2004, Nature, 428, 724
- Rieke et al. (1980) Rieke, G. H., Lebofsky, M. J., Thompson, R. I., Low, F. J., & Tokunaga, A. T. 1980, ApJ, 238, 24
- Rieke et al. (1993) Rieke, G. H., Loken, K., Rieke, M. J., & Tamblyn, P. 1993, ApJ, 412, 99
- Salpeter (1955) Salpeter, E. E. 1955, ApJ, 121, 161
- Satyapal et al. (1997) Satyapal, S., Watson, D. M., Pipher, J. L., Forrest, W. J., Greenhouse, M. A., Smith, H. A., Fischer, J., & Woodward, C. E. 1997, ApJ, 483, 148
- Schaller et al. (1992) Schaller, G., Schaerer, D., Meynet, G., & Maeder, A. 1992, A&AS, 96, 269
- Schlegel et al. (1998) Schlegel, D. J., Finkbeiner, D. P., & Davis, M. 1998, ApJ, 500, 525
- Sirianni et al. (2002) Sirianni, M., Nota, A., De Marchi, G., Leitherer, C., & Clampin, M. 2002, ApJ, 579, 275
- Smith & Gallagher (2001) Smith, L. J. & Gallagher, J. S. 2001, MNRAS, 326, 1027
- Spitzer (1987) Spitzer, L. 1987, Dynamical Evolution of Globular Clusters (Princeton, NJ, Princeton University Press, 1987)
- Sternberg (1998) Sternberg, A. 1998, ApJ, 506, 721
- Vacca et al. (in prep.) Vacca, W. D., McCrady, N., Graham, J. R., & Lehnert, M. D. in prep.
- Whitmore & Schweizer (1995) Whitmore, B. C. & Schweizer, F. 1995, AJ, 109, 960
- Zepf et al. (1999) Zepf, S. E., Ashman, K. M., English, J., Freeman, K. C., & Sharples, R. M. 1999, AJ, 118, 752