Abundances of C, N, O in slightly evolved stars in the globular clusters NGC 6397, NGC 6752 and 47 Tuc††thanks: Based on data collected at the European Southern Observatory, Chile (ESO LP 165.L-0263)
Abundances of C and N are derived from features due to the CH G-band and to the UV CN band measured on high resolution () UVES spectra of more than 40 dwarfs and subgiants in NGC 6397, NGC 6752 and 47 Tuc. Oxygen abundances (or upper limits) are available for all stars in the sample. Isotopic ratios 12C/13C were derived from the CH molecular band. This is the first determination of this ratio in unevolved dwarf stars in globular clusters. By enlarging the sample of subgiants in NGC 6397 studied in Gratton et al. (2001), we uncovered, for the first time, large variations in both Na and O also in this cluster. The origin of the chemical inhomogeneities must be searched for outside the stars under scrutiny. Our data indicate that in unevolved or slightly evolved stars in these clusters C abundances are low but not zero, also in stars with large N-enhancements and O-depletions, and that the isotopic ratios 12C/13C are low, but never reach the equilibrium value of the CN-cycle. When coupled with the run of O and Na abundances, these findings possibly require that, in addition to CNO burning and captures, some triple process is also involved: previously evolved intermediate-mass AGB stars are then the most likely polluters.
Key Words.:
Stars: abundances – Stars: evolution – Stars: Population II – Galaxy: globular clusters1 INTRODUCTION
After H and He, C, N, O are, together with Ne, the most abundant elements in the Universe. As such, they are key ingredients in a large number of astrophysical issues. Their abundances in metal-poor stars are tracers of the nucleosynthetic sites that contributed to the different phases of galactic evolution. Moreover, they are important contributors to the opacity in stellar interiors and act as catalysts in the CNO-cycle of H-burning.
Stars of globular clusters (GCs) offer an ideal diagnostic in order to understand stellar evolution for low and intermediate stellar masses. However, since the pioneering study of Osborn (1971) it is known that a spread in the light elements (C, N, O, but also among heavier species such as Na, Al and Mg) is present among cluster stars of similar evolutionary phase, unlike their analogs in the galactic field (e.g. Gratton et al. 2000 and references therein). Among these last, C and N abundances follow well defined evolutionary paths, with two episodes of mixing, the first one related to the first dredge-up and the second one after the red giant branch (RGB) bump, when the molecular weight barrier created by the maximum inward penetration of the outer convective envelope is canceled by the outward expansion of the H-burning shell. The first episode was theoretically predicted by Iben (1964); while the second one is not present in canonical non-rotating models, it may be easily accomodated in models where some type of circulation is activated e.g. by core rotation (Sweigart & Gross 1978; Charbonnel 1994). Gratton et al. (2000) showed that among field stars no variations corresponding to these mixing episodes are observed for the remaining elements (namely, O and Na): again, this agrees with models, that do not allow deep enough mixing along the RGB. Clearly this pointed toward a peculiarity of globular cluster stars.
As shown by Denisenkov & Denisenkova (1989), and later in a more quantitative way by Langer et al. (1993), the observed star-to-star scatter in cluster stars may be explained by the CNO-cycle and the accompanying proton-capture reactions at high temperature. More uncertain is where these reactions occurred, whether in the observed star themselves, prior to an internal (extra- or enhanced-) very deep mixing episode, or elsewhere, perhaps in some form of H-burning at high temperature taking place e.g. in now extinct intermediate-mass AGB stars (IM-AGB), followed by ejection of polluting matter (see Gratton, Sneden and Carretta 2004 for an updated review and references on the huge literature on this subject).
Evidences from red giants are ambiguous, since both mixing (causing a decrease of [C/Fe] as a function of luminosity, see Bellman et al. 2001 and references therein) and pollution/accretion of processed matter (e.g. Yong et al. 2003, Sneden et al. 2004) might be invoked to explain observations.
Cleaner conclusions can be drawn from unevolved or slightly evolved stars, where no mixing is expected and inner temperatures are not high enough to permit the capture reactions in the NeNa and AlMg cycles. However, up to a short time ago, only low-dispersion observations of molecular bands of hydrides such as CH and NH or bi-metallic molecules such as CN were available to study the chemical composition of faint GC turn-off (TO) dwarfs or subgiants (SGB). More important, no O indicator was accessible, since the atmospheric cutoff and the low throughput of existing spectrographs severely hampered the use of OH bands in the UV regions, and the remaining O features are only observable on high dispersion spectra.
In spite of these limitations, a number of studies (see e.g. Briley et al. 2004b and references therein) uncovered that large spreads in the CH and CN band strengths, anticorrelated with each other, do exist in unevolved stars in several GCs. The only explanation must necessarily rest on an event that polluted the material forming these stars, likely early in the cluster lifetime.
Previous results from the present program (Gratton et al. 2001, Carretta et al. 2004) provided further strong evidences favouring primordial abundance variations. Deriving the first reliable O abundances in cluster dwarfs, we found a clear anticorrelation between Na and O among TO and SGB stars in NGC 6752 and 47 Tuc. In NGC 6397, early results were not conclusive, but they were hampered by small number statistics. Similar anticorrelations were found also for Mg and Al. These facts require some non internal mechanism.
However, after initial successes (see e.g. Ventura et al. 2001), more recent models of metal-poor IM-AGB stars met serious problems in reproducing the O-Na anticorrelation and related phenomenology (Denissenkov & Herwig 2003; Fenner et al. 2004; Herwig 2004), and unveiled that not only Hot Bottom Burning occurs (HBB), but also vigorous H-burning at somewhat cooler temperatures during the interpulse phases. To overcome these problems, Denissenkov & Weiss (2004) recently proposed that the site for the capture reactions is the interior of RGB stars slightly more massive than those currently observed in globular clusters, and that they exchanged mass with the currently unevolved stars where the anomalous abundances are observed.
In the present paper we complete the analysis of the spectra presented in Gratton et al. (2001) and Carretta et al. (2004) by including detailed abundances of C, N and O. From these abundances and from isotopic 12C/13C ratios, measured for the first time in such unevolved stars, we suggest that both triple- captures in He-burning, to form fresh 12C, and typical H-burning processing at high temperatures are required to reproduce the observed pattern of abundances in these stars. If confirmed, this would exclude the possibility that mass-exchange with RGB stars might be responsible for the observed abundances. In the discussion, we will also comment on other possible shortcomings of this hypothesis.
Furthermore, we also present results for Na and O abundances in a more extended sample of subgiants in NGC 6397, showing that large variations, anticorrelated with each other, in these two elements do exist also in this metal-poor cluster.
2 OBSERVATIONS
Details of observations are given in Gratton et al. (2001; Paper I) and Carretta et al. (2004). Briefly, spectra were acquired using the Ultraviolet-Visual Echelle Spectrograph (UVES) mounted at the ESO VLT-UT2 within several runs (June and September 2000; August and October 2001, July 2002) of the ESO Large Program 165.L-0263 (P.I. R. Gratton). On the whole, we have observational material for 6 dwarfs and 9 subgiant stars in NGC 6397, 9 dwarfs and 9 subgiants in NGC 6752 and 3 dwarfs and 9 subgiants in 47 Tuc. Relevant data for the observed stars are given in Gratton et al. (2001) and Carretta et al. (2004). Those for the additional subgiants in NGC 6397 are the same as given for the other subgiants in Gratton et al. (2001).
Data were acquired using the dichroic beamsplitter #2. In the blue arm we used the CD2, centered at 420 nm, to cover both the CH G-band at Å and the CN UV system at Å. The spectral coverage is about 356-484 nm. The CD4, centered at 750 nm (covering 555-946 nm), was adopted in the red arm. Observations in the run of June 2000 (mostly for NGC 6397) were made with a slightly different setup, resulting in a spectral coverage 338-465 nm in the blue and 517-891 nm in the red. Slit length was always 8 arcsec, while the slit width was mostly set at 1 arcsec (corresponding to a resolution of 43000). In a few cases, according to the seeing conditions, this value was slightly modified downward or upward.
In NGC 6397 and NGC 6752, typical exposure times were hour for subgiants, while in 47 Tuc we doubled this time. Each turn-off star was observed for a total of about 4 hours, split into several exposures. At we reached a typical value of the per pixel of , increasing to for stars in NGC 6397.
3 ATMOSPHERIC PARAMETERS
The adopted values of the atmospheric parameters are discussed in detail in Gratton et al. (2001) and Carretta et al. (2004). Here we only recall the main features of the analysis, that was also applied to the 6 newly observed SGB stars in NGC 6397.
We compared effective temperatures from observed colours (both Johnson and Strömgren were used) with spectroscopic temperatures derived from fitting Balmer lines (namely H). This approach was devised to derive precise values of the reddenings on the same scale for both cluster stars and field stars. These were used in the estimate of accurate distances to these clusters (see Gratton et al. 2003).
Average values of temperatures were finally used for stars of NGC 6752 and NGC 6397. However, in 47 Tuc we found that the adoption of individual Teff’s for the subgiant stars provided best agreement with the values given by line excitation. Adopted values for 47 Tuc are given in Table 2 of Carretta et al. (2004).
Values of the surface gravity were derived from the location of stars in the colour magnitude diagram; an age of 14 Gyr and corresponding masses were assumed.
Estimates of the microturbulent velocity for each star were derived, as usual, by eliminating trends of abundances with expected line strengths. Again, average values for each group of stars in similar evolutionary phases were adopted in NGC 6397 and NGC 6752.
Finally, the overall model metallicities [A/H] were chosen as equal to the Fe abundances that best reproduce the measured equivalent widths (), using the model atmospheres from the Kurucz (1995) grid with the overshooting option switched off.
4 ANALYSIS
4.1 Carbon and isotopic ratios
Carbon abundances for the program stars were obtained from a comparison of observed and synthetic spectra in the wavelength region from 4300 Å to 4340 Å. This spectral region includes the band head of the (0-0),(1-1) and (2-2) bands of the A2-X2 transitions of CH. We used newly derived line lists from Lucatello et al. (2003). Briefly, the starting line list was extracted from Kurucz’s database (Kurucz CD-ROM 23, 1995), including atomic species and molecular lines of C2, CN, CH, NH and OH. A few lines, missing in the Kurucz database, were added from the solar tables (Moore, Minnaert & Houtgast 1966); when unidentified, we arbitrarily attributed these lines to Fe I, with an excitation potential of EP=3.5 eV.
The dissociation potential of CH has been determined with high accuracy at eV (Brzozowoski et al. 1976), while band oscillator strenghts were modified in order to reproduce the observed solar spectrum (Kurucz et al. 1984), using the solar carbon abundance of Anders and Grevesse (1989). We found that, in order to have a good match, a corrective factor of 0.3 dex in the values of the electronic transitions and a shift of 0.05 Å in wavelength were required, with respect to the values given by Kurucz. As found by many authors (see e.g. Grevesse & Sauval 1998), high excitation CH lines listed by Kurucz are missing in the spectra of the Sun and other stars, due to pre-dissociation. We omitted from our line list those lines rising from levels with excitation potential over 1.5 eV.
The excellent match of the synthetic spectrum with the observed solar spectrum in part of the G-band region is shown in Figure 1.
Using the appropriate atmospheric parameters, synthetic spectra in the spectral region 4300-4340 Å were computed varying [C/Fe] in steps of 0.2 dex, in the range from 0.3 to 0.7 dex. A constant oxygen abundance [O/Fe] = 0 was adopted in all these computations. The exact values affect only negligibly the derived C abundances, since for stars warmer than K the coupling of C and O is not relevant.
After the synthesis computations, the generated spectra were convolved with Gaussians of appropriate FWHM to match the broadening mechanisms (in particular that due to the instrumental response) of the observed spectra. Carbon abundances were then derived from a set of 15-17 CH features within the region under scrutiny, inspecting by eye all features, and computing an average value for each star.
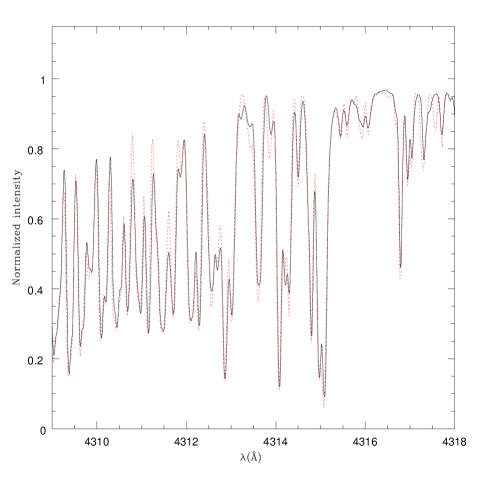
Results are summarized in Table 1, while Figure 2 shows two examples of the synthetic spectrum fits to the observed CH features for a subgiant (star 478) and a turn-off star (star 1012) in 47 Tuc. The average deviations of the abundances from the individual observed features in [C/Fe] are 0.10-0.12 dex.

Isotopic ratios 12C/13C were estimated from spectrum synthesis in the two regions 4228-4240 Å and 4360-4372 Å containing various clean features of 13CH (see e.g. Sneden, Pilachowski and Vandenberg 1986; Gratton et al. 2000). Synthetic spectra were computed using the C abundances for each star derived from the G-band synthesis and the appropriate atmospheric parameters, and a range for the 12C/13C values. The adopted isotopic ratios were derived as the averages from several features in both regions.
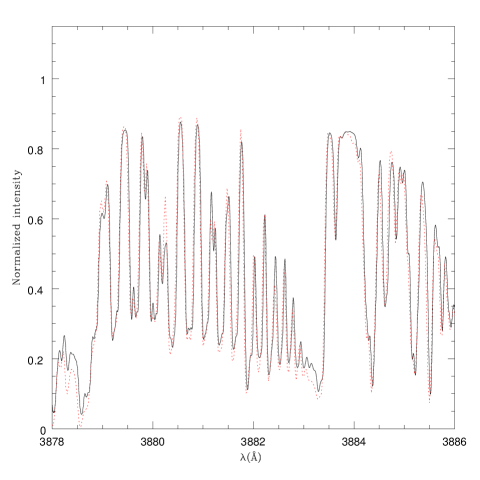
4.2 Nitrogen
Since the violet CN band at 4200 Å is vanishingly weak in warm metal-poor stars (see Cannon et al. 1998, but see below the case of 47 Tuc), we used the UV CN band and derived N abundances from a number of CN features in the wavelength range 3876-3890 Å, where the bandhead of the bands of the UV system lies, again using line lists optimized by Lucatello et al. (2003). These lists use a CN dissociation potential of 7.66 eV from Engleman and Rouse (1975); a corrective factor of -0.3 dex in the of the electronic transitions was applied also in this case, with respect to the values listed by Kurucz. In Figure 3 the comparison between the observed solar spectrum (Kurucz et al. 1984) and the synthetic spectrum computed with the optimized line list is shown.
Carbon abundances derived above from synthesis of the CH bands were adopted in the computation of synthetic spectra, relevant for individual stars, together with the appropriate atmospheric parameters (from Gratton et al. 2001 and Carretta et al. 2004).
In the case of 47 Tuc, which is about 1.3 dex and 0.7 dex more metal-rich than NGC 6397 and NGC 6752, respectively, we were able to use also the violet CN band strengths at Å in order to estimate the N abundances, at least in the subgiant stars. A procedure similar to that described above was used to compute synthetic spectra in the region from 4202 Å to 4226 Å, with the proper C abundance for each star. The N abundances resulted to be in very good agreement with those derived from the synthesis of the 3880 Å region, so for the subgiants in 47 Tuc the [N/Fe] values are those obtained as the average of N abundances in the two regions.
No observations for the NH band were available for our program stars, apart from the very first run (June 2000), where the setup covered the region from 3376 to 3560 Å, missed in the following observing runs. In this run stars in both NGC 6397 and NGC 6752, but not in 47 Tuc were observed. This choice of the setup was driven by the consideration that the expected of the spectra of the (fainter) stars in NGC 6752 and 47 Tuc was so low that likely no meaningful abundances could be obtained.
For these spectra of NGC 6397 stars, we then prepared a line list in the spectral range 3400-3410 Å, where some NH lines lie, using again the solar spectrum as a starting point; however, in order to obtain a good match, the values of NH lines in Kurucz’s list had to be lowered by about 0.5 dex. Results of the NH synthesis in stars of NGC 6397 are given in the next Sect.
4.3 Oxygen and Sodium
Oxygen abundances in these warm stars were derived almost exclusively from the permitted near-IR triplet at 7771-75 Å, as discussed at length in Gratton et al. (2001) and Carretta et al. (2004). Only for one subgiant in 47 Tuc could we measure the forbidden [O I] lines. For the other stars, the very weak [O I] line was masked by much stronger telluric features, so that no reliable abundance could be derived. Final abundances and upper limits are given in Table 1, corrected for non-LTE effects as described in Gratton et al. (1999), from statistical equilibrium calculations based on empirically calibrated collisional H I cross sections. The appropriate corrections were also applied to the Na abundances, derived from the strong doublet at 8183-94 Å.
5 RESULTS
Derived abundances for C, N, O and isotopic ratios 12C/13C for stars in NGC 6397, NGC 6752 and 47 Tuc are listed in Table 1. Carbon isotopic ratios could not be reliably derived for stars in NGC 6397 and dwarfs in NGC 6752; only upper limits for C and N abundances were obtained for dwarf stars in NGC 6397, due to the weakness of the features and the low ratio in the blue region of the spectra.
Table 1 also lists, for an easier comparison of the relevant elements involved in H-burning at high temperatures, the abundances of Na taken from the previous papers of this series (Gratton et al. 2001, Carretta et al. 2004). For the 6 subgiants in NGC 6397 observed in July 2002, newly derived Na and O abundances are also shown in this Table, where stars are ordered according to increasing Na abundances.
| Star | [C/Fe] | [N/Fe] | [O/Fe] | [Na/Fe] | 12C/13C |
| NGC 6397 - dwarfs | |||||
| 1905 | +0.50 | 2.0 | +0.24 | +0.09 | |
| 202765 | +0.50 | 1.5 | +0.33 | +0.13 | |
| 201432 | +0.50 | 1.5 | +0.21 | +0.15 | |
| 1543 | +0.50 | 1.5 | +0.28 | +0.28 | |
| 1622 | +0.50 | 2.0 | +0.23 | +0.35 | |
| NGC 6397 - subgiants | |||||
| 706 | +0.10 | 0.5 | +0.54 | 0.48 | |
| 760 | +0.10 | 0.5 | +0.39 | 0.43 | |
| 777 | +0.15 | +0.2 | +0.39 | 0.25 | |
| 737 | +0.15 | +1.4 | 0.06 | +0.19 | |
| 793 | 0.10 | +1.2 | 0.06 | +0.23 | |
| 703 | +0.00 | +1.5 | 0.06 | +0.30 | |
| 206810 | 0.07 | +1.3 | 0.31 | +0.32 | |
| 729 | 0.10 | +1.4 | 0.06 | +0.48 | |
| 669 | +0.01 | +1.3 | +0.31 | +0.53 | |
| NGC 6752 - dwarfs | |||||
| 4428 | +0.09 | +1.1 | +0.33 | 0.29 | |
| 4383 | +0.12 | +1.2 | +0.57 | 0.18 | |
| 202316 | +0.12 | +1.5 | +0.27 | 0.06 | |
| 4341 | +0.21 | +1.4 | +0.20 | +0.20 | |
| 4661 | 0.20 | +1.4 | 0.35 | +0.29 | |
| 4458 | 0.20 | +1.5 | +0.02 | +0.31 | |
| 5048 | 0.20 | +1.5 | 0.30 | +0.37 | |
| 4907 | 0.20 | +1.5 | 0.25 | +0.58 | |
| 200613 | 0.20 | +1.7 | +0.62 | ||
| NGC 6752 - subgiants | |||||
| 1406 | 0.13 | +0.0 | +0.44 | +0.02 | 9 |
| 1665 | 0.28 | +1.0 | +0.10 | 11 | |
| 1445 | 0.42 | +1.2 | +0.14 | 5 | |
| 1400 | 0.25 | +1.0 | +0.38 | +0.20 | 9 |
| 1563 | 0.33 | +1.3 | +0.42 | +0.26 | 5 |
| 1461 | 0.32 | +1.3 | +0.28 | 5 | |
| 202063 | 0.37 | +1.2 | +0.53 | +0.31 | 3 |
| 1460 | 0.49 | +1.4 | 0.29 | +0.42 | 5 |
| 1481 | 0.51 | +1.3 | +0.51 | 4 | |
| NGC 104 - dwarfs | |||||
| 1081 | 0.13 | 0.50 | +0.57 | 0.34 | 10 |
| 1012 | 0.10 | 0.30 | +0.48 | 0.14 | 10 |
| 975 | 0.13 | 0.30 | +0.40 | +0.22 | 10 |
| NGC 104 - subgiants | |||||
| 482 | 0.16 | +0.10 | +0.61 | +0.06 | 12 |
| 206415 | 0.11 | 0.25 | +0.52 | +0.10 | 10 |
| 201075 | 0.12 | 0.30 | +0.41 | +0.11 | 9 |
| 433 | 0.32 | +1.10 | +0.24 | 10 | |
| 456 | 0.28 | +1.00 | +0.28 | 12 | |
| 201600 | 0.50 | +1.10 | +0.30 | 10 | |
| 435 | 0.31 | +0.70 | +0.31 | 9 | |
| 429 | 0.35 | +0.50 | 0.01 | +0.31 | 6 |
| 478 | 0.30 | +0.90 | +0.37 | 9 | |
-
Values of [N/Fe] in the subgiants of 47 Tuc are the average of the abundances estimated from the synthesis of the 3883 Å and the 4215 Å regions.
In the following, some features of the analysis of individual clusters are discussed.
47 Tuc
Being much more metal-rich than the other two clusters, 47 Tuc is the only one for which we were able to obtain meaningful lower limits of the isotopic ratios 12C/13C for dwarf stars. The values found are listed in last column of Table 1.
For the three dwarfs, the rather low quality of the spectra in the blue hampered a precise determination of the isotopic ratio. Hence, we choose to smooth somewhat the spectra, degrading the resolution to enhance the . However, even in this case, the best result we could secure is that the ratio 12C/13C is in these turn-off stars.
It should be noticed that these are, to our knowledge, the first determinations, of the 12C/13C isotopic ratios in stars less evolved than the RGB-bump in GCs.
NGC 6752
For dwarfs in NGC 6752, the quality of spectra does not allow a clearcut determination of the C abundances in the O-poor dwarfs, which are very rich in N but with low C abundances. Hence, in these warm stars, the features of CH are rather weak, and we adopted the following procedure, in order to obtain a more reliable estimate.
The spectra of individual dwarf stars with low or not detected oxygen were summed up and this coadded spectrum was then used to derive an abundance of C through comparison with synthetic spectra. Our best estimate is [C/Fe]. Analogously, the N abundances were then derived from the region 3876-3890 Å using [C/Fe] dex and synthetic spectra computed with different values of the [N/Fe] ratio. Notice that apparently there are no N-poor dwarfs, and only one N-poor subgiant, in our sample.
NGC 6397
In some stars of NGC 6397, acquired with the bluest setup during our first run, we were able to investigate the NH molecular bands. The great advantage of using the hydrides bands in metal-poor clusters like NGC 6397 is that bands of bi-metallic molecules like CN become vanishingly weak at low metallicity, due to their quadratic dependence on the metal abundance. Figure 4 shows the observed spectrum of the subgiant star 206810 as compared to five synthetic spectra computed with different [N/Fe] ratios. The lines of NH are clearly observed and the best match is obtained with the synthetic spectrum computed with [N/Fe] dex, in very good agreement with the value that was derived from the CN bands. This supports our derivation of the N abundance for the subgiants in this cluster.

In Figure 5 the same comparison is made with the average spectrum obtained from the three dwarfs in NGC 6397 having the best spectra in the UV, namely stars 202765, 201432 and 1543. The resulting average spectrum was decontaminated for a relevant (about 20% of the total value) contribution of scattered light due to the sky, not properly taken into account by our spectrum extraction procedure (note that these lines lie at the extreme UV edge of the observed spectrum).

In this average spectrum we cannot firmly conclude that NH lines are actually observed: only some lines, but not all, are detected, and even these are very close to the noise level. The comparison with synthetic spectra in this region shows that a reasonable fit might be achieved at [N/Fe] dex: a value greater than 2.0 dex is clearly excluded. This upper limit is however more stringent that that derived from the CN lines.
6 DISCUSSION
6.1 The light elements: C and N
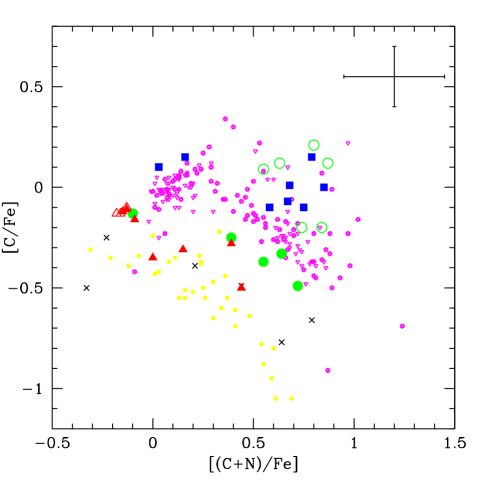
Variations of the abundances of C and N in the examined stars, as derived from the features of the G-band and UV CN band, respectively, are shown in Figure 6. Typical error bars are also shown; they are conservative estimates, including both the scatter from the observed individual lines of CH and CN and the effect (almost negligible) of errors in the adopted atmospheric parameters (see Gratton et al. 2001 and Carretta et al. 2004 for the estimates of these uncertainties).
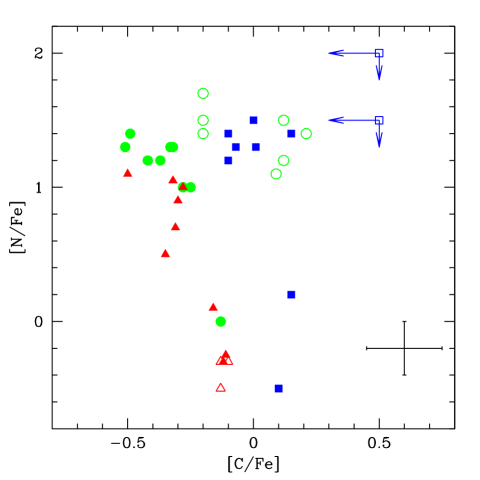
In 47 Tuc the dwarfs are clustered around [C/Fe] dex, [N/Fe] dex, while the subgiants seem to be divided into two distinct groups, one with low N-high C and the other with low C-high N. Abundances of N and C seem to be anticorrelated in the other two clusters tt, even if for NGC 6397 we derived only upper limits for dwarfs, and the evidence of anticorrelation is somewhat weaker in the subgiants, with respect to stars in NGC 6752 and 47 Tuc111Note that at [N/Fe] and [C/Fe] there are subgiant stars in NGC 6397, where in Figure 6 only one point is displayed..
Even taking into account the small number statistics, it does not seem premature to conclude that in all 3 clusters there are a few subgiants with very low N abundances, well separated from high-N/low-C subgiants. The average C abundance of the 3 low-N subgiants in 47 Tuc is [C/Fe] dex ( dex, 3 stars), whereas the 6 subgiants with high N abundances have an average of [C/Fe] (=0.08). This difference in [C/Fe] is very similar to the one between the N-poor subgiant in NGC 6752 ([C/Fe]) and the average obtained from the other (N-rich) subgiants: [C/Fe] (, 8 stars). The spread in C abundances is smaller (about 0.15 dex) for subgiants in NGC 6397: in this case we obtain [C/Fe] dex (0.12 dex, 3 stars) and [C/Fe] dex (0.10 dex, 6 stars) respectively for N-poor and N-rich stars.
From these numbers we note what is immediately apparent in Figure 6: while the spread in [N/Fe] is well above 1 dex, in each cluster there is a rather small variation in C abundances. Since the C/N ratio in C-rich, N-poor stars is roughly solar ( dex), N in N-rich stars cannot be produced only by transformation of C into N. Furthermore, even if carbon is a minority species in these stars, the residual C observed in N-rich stars is much more than that expected for material processed by CN-cycle at high temperature ([C/Fe]; see Langer et al. 1993)
6.2 Comparison with previous works
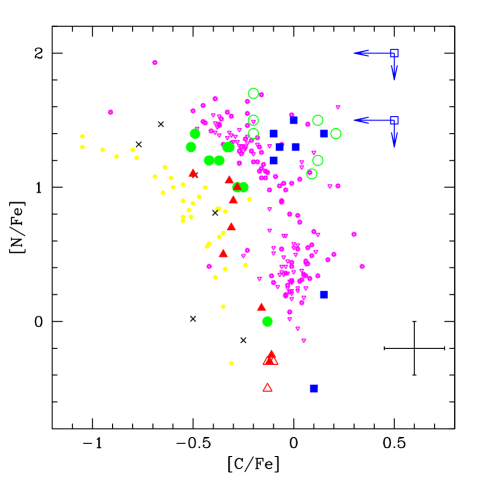
The anti-correlation between C and N abundances, already known from low resolution spectra, is confirmed by our high dispersion spectra. To show this, we reproduced in Figure 7 a similar plot shown by Briley et al. (2004a) with abundances of C and N for unevolved or slightly evolved stars in a number of clusters. While zero-point offsets are likely present between our data set and the [C/Fe] and [N/Fe] values derived by Briley et al. (as shown by mean ridge lines for 47 Tuc), the behaviour is essentially the same. In all clusters examined so far, variations in C and N are anti-correlated with each other, with N showing large spreads, with respect to the more modest scatter in C abundances. Only among the SGB stars in M5 studied by Cohen et al. (2002) does the spread in C seem to equal the spread in N, and the most C-poor stars have a C depletion close to that expected by complete CN-cycling.
Is this C-N anticorrelation tied to evolutionary phenomena occurring within the stars themselves or are we seeing the outcome of an already established nucleosynthesis implanted early in the material? To answer this question, we have to look into the evolutionary status of our program stars and seek for relationships with luminosity.
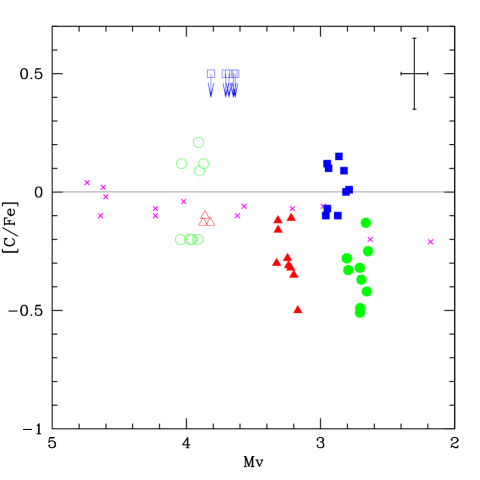
In Figure 8 we plotted the [C/Fe] values of all program stars in the three clusters as a function of the absolute magnitude of the stars. Distance moduli are those corrected for the effect of binarity in Gratton et al. (2003). As a reference, we also plotted halo field stars from Gratton et al. (2000), in the same luminosity range; we only considered field stars in the range [Fe/H] , that closely matches the metallicity range of our three globular clusters. This figure shows that the C abundance drops moderately (less than a factor of 2) both in field and cluster stars at the expected luminosity for the first dredge-up, in agreement with the standard stellar evolution models.
Admittedly, the magnitude range is rather limited, but we can extend it by using literature data available for bright giants in the studied clusters. In Figure 9 we added to our data also C measurements for red giants in NGC 6397 (Briley et al. 1990), NGC 6752 (Suntzeff and Smith 1991) and 47 Tuc (Brown et al. 1990). In all cases, the absolute magnitude scale is that defined by Gratton et al. (2003).
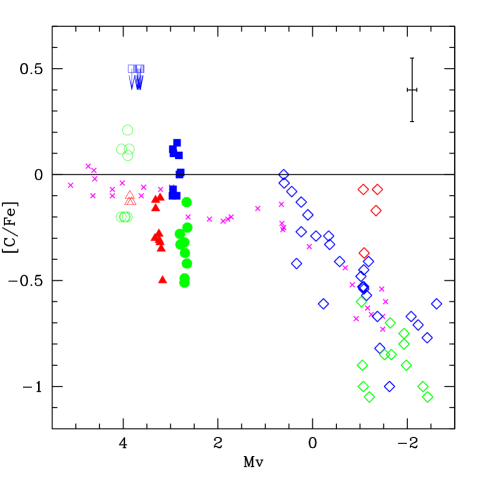
Despite the heterogeneity of data sources and methods used to obtain the C abundances (low-dispersion spectroscopic measurements of the G-band in stars of NGC 6397 by Briley et al. 1990; infrared spectra of the first overtone CO bands for stars studied by Suntzeff and Smith 1991 in NGC 6752; moderately high resolution spectra of the CN red system and of the G-band for stars in 47 Tuc by Brown et al. 1990; synthesis of high resolution spectra of the UV CN system and of the G-band in our program stars), and offsets between the bright giants and the unevolved stars might be present, the overall pattern among cluster stars seems to follow rather well the one defined by ”undisturbed” field stars. Namely, the second step-like decrease in [C/Fe] ratios around the red giant branch bump () seems to be present also for cluster stars. This is explained (e.g. Sweigart and Mengel 1979; Charbonnel 1995; Gratton et al. 2000) as the onset of a second mixing episode during the red giant evolution of a population II star, once the molecular weight barrier established by the retreating convective envelope is wiped out by the advancing shell of H-burning. From now on, CN-processed material is able to reach the surface layer, where a further decrease of C is visible, as shown by Figure 9.
We conclude that in spite of a larger (intrinsic) scatter, the same mixing episodes observed among field stars can be traced also among cluster stars.
This result is not new. Very recently, Smith and Martell (2003) used the same field sample by Gratton et al. (2000) and literature data for C abundances in red giants in M 92, NGC 6397, M 3 and M 13 to show that the rate of decline of [C/Fe] on the RGB as a function of is very similar between cluster and halo field giants. Our study, however, has the advantage of sampling regions along the RGB well below the so called bump in the RGB luminosity function, where standard theories for extra-mixing (see e.g. Sweigart and Mengel 1979) fix the threshold in magnitude for the onset of additional mixing. In globular clusters the chemical anomalies can be traced down to very faint magnitudes and we clearly detect a steady increase in the average C abundance going from red giants to subgiants and to dwarf stars.
Figure 9 also shows another well known feature: cluster stars seems to reach more extreme C depletions than those experienced by field analogs, as clearly indicated by red giants in NGC 6752 and, partly, by giants in NGC 6397.
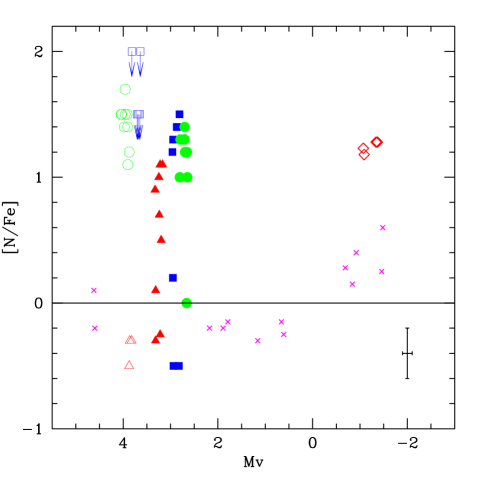
The analogous plot for N abundances, in Figure 10, also reveals an extreme behaviour of cluster stars. Spreads in [N/Fe] are very large in cluster dwarfs and subgiants with respect to field stars of similar evolutionary status. Moreover, when coupled with literature data (from Brown et al. 1990), a hint for increasing [N/Fe] at increasing luminosity seems to appear for stars in 47 Tuc. On the other hand, no clear indication of such increase in NGC 6752 is present.
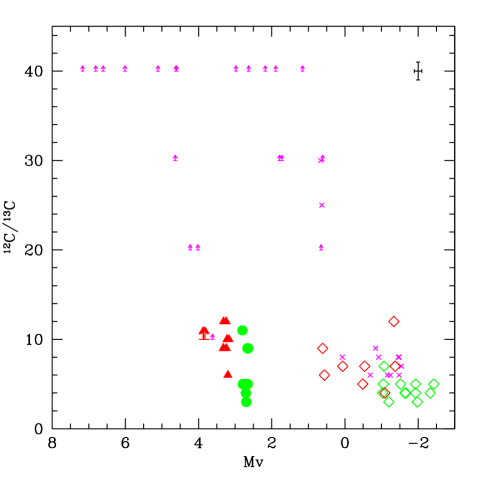
Finally, Figure 11 shows the isotopic ratios 12C/13C measured in program stars as compared to the field database of Gratton et al. (2000), as well as the literature data available for these clusters. Also in this case, cluster stars show extremely low values of the isotopic ratios, when compared to the field stars of similar magnitude. However, the interesting feature here is that the 12C/13C values are not at the CN-cycle equilibrium value, not even for stars that are extremely N-rich. For these stars one would expect a value of , at odds with our findings. Even considering literature data for bright giants, their isotopic ratios seem to be somewhat lower than those in field stars but always at a level slightly higher than the equilibrium value.
6.2.1 First conclusions from light elements
In summary, the analyses of C and N and the relative abundances of the carbon isotopes in slightly evolved globular cluster stars show that:
-
•
there are moderately small variations in C abundances, anticorrelated to (large) variations in N abundances. However, except for a few stars in M5, the C is generally not as low as expected for CN-cycling material. In no dwarf or early subgiant do we find C abundances as low as those observed in (all) highly evolved RGB stars, i.e. stars brighter than the RGB-bump.
-
•
N shows a large spread and, with the cautionary warning of a rather limited range in sampled magnitudes, does not seem to have a particular increase at the first dredge-up position. Note that a large fraction of dwarfs and early subgiants have N abundances as high as those observed in highly evolved RGB stars (Figure 10).
-
•
the isotopic ratios 12C/13C are low but do not reach the equilibrium value of .
From these observations, it is already clear that no unevolved star has the same surface composition as highly RGB stars, as required by some recent scenarios advocated to explain the O-Na anticorrelation (Denissenkov and Weiss 2004). Rather, the observed pattern resembles much more that predicted by the evolutionary models of the most massive intermediate-mass, low metallicity AGB stars (e.g., Ventura et al. 2002, 2004). According to these models, these stars have complete CNO cycling at the base of the convective envelope and the coupling of nucleosynthesis plus release of processed matter into the protocluster clouds or onto second-generation stars is able to produce a surface composition where C is depleted, but not to values as low as those expected from CN-cycling, because some fresh 12C produced by triple reactions is dredged up to the surface, N is enhanced and the carbon isotopic ratio approaches the equilibrium value, due to the large enhancement of 13C. Apparently, this is almost exactly the chemical composition of the unevolved cluster stars under scrutiny.
At this point of our discussion, however, this assertion is not yet proven, because dilution with material not contaminated by CNO burning could be invoked to explain the observed trends for C and N abundances. Observations of heavier elements involved in high temperature capture reactions may give a deeper insight.
6.3 Oxygen and Sodium
Looking now at heavier elements (O and Na), we proceed along a path of stronger Coulomb barriers. The temperatures involved are much higher and we are considering deeper regions in the H-burning shell.
The well known Na-O anticorrelation (see Gratton, Sneden and Carretta 2004 for a recent review) is summarized in Figure 12 for our program clusters. In this Figure we also added the available literature data, which is mostly for bright red giant stars, even if, apart from a few cases, no systematic studies have been performed for these 3 clusters, often used as calibrators. Abundances of Na and O in NGC 6397 include 2 stars studied by Norris and Da Costa (1995) and 2 stars from Castilho et al. (2000). For 47 Tuc, additional data are from Norris and Da Costa (1995) and Carretta (1994). For NGC 6752, we added 6 stars from Norris and Da Costa (1995), 4 stars from Carretta (1994) and the bright red giants studied by Yong et al. (2003). Individual values of Na and O for the bump stars in NGC 6752 analyzed by Grundahl et al. (2002) have not been published anywhere, therefore they are not used. Whenever possible, as in the Yong et al. sample, we started from original and values, bringing them onto a homogeneous scale by using the average [Fe/H] values and the solar values adopted in the present study.
Note that values for our dwarfs and subgiants do include corrections for departures from LTE. For literature data, this was possible only for stars analyzed in Carretta (1994). However, since O abundances are usually derived in red giants from the forbidden [O I] doublet, these corrections are negligible. NLTE corrections for Na abundance might be of more concern in giants, depending on what lines were used in the various analyses, but the overall appearence of Figure 12 shows that if there are some offsets, they are rather small.
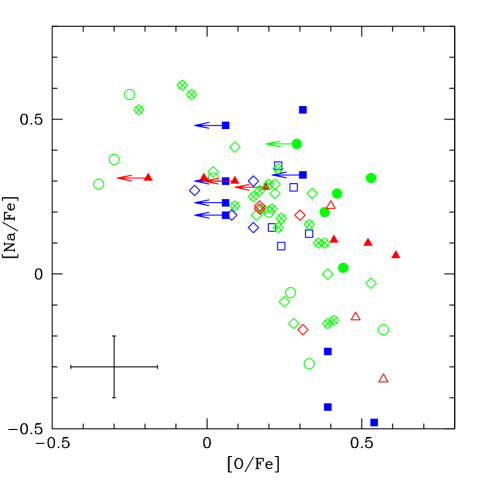
The O-Na anticorrelation is in fact very well defined for all clusters; there seem not to be large differences among the different clusters over the metallicity range sampled, nor among stars of different evolutionary status within a given cluster. For the first time, the existence of a Na-O anticorrelation also among stars in NGC 6397 is clearly shown. This Figure shows among slightly evolved cluster stars the same trends that have previously been observed among the red giant stars of several globular clusters.
The difference with respect to field stars is striking. With their highly homogeneous sample, Gratton et al. (2000) convincingly showed that field stars have constant Na and O abundances, not anticorrelated with each other. The obvious implication is that in cluster stars there is something else able to alter simultaneously the abundances of these two elements.
To get a deeper insight, we show in Figure 13 and Figure 14 the derived abundances of C and N, respectively, for program stars as a function of the [Na/Fe] ratio.
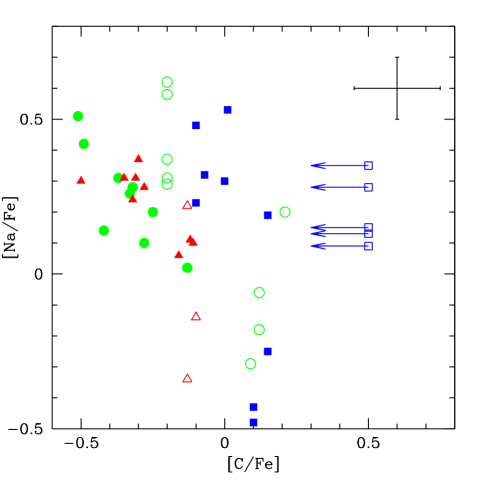
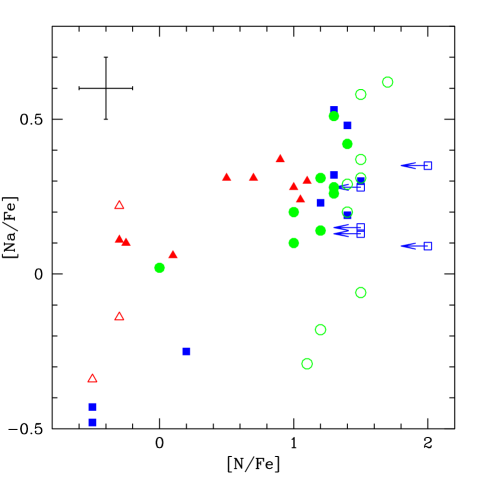
In all three clusters, Figure 13 and Figure 14 clearly show a trend for C and N abundances to decrease and increase respectively with the increase of Na abundances. In particular, the C-Na anticorrelation closely mimics the well-known O-Na anticorrelation, summarized in Figure 12.
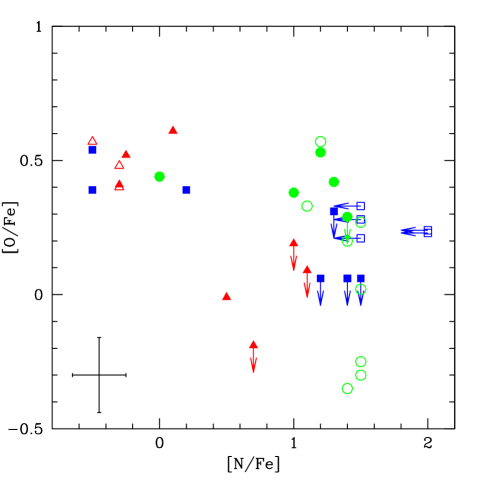
Furthermore, while turn-off stars show a large range in Na abundances (at almost constant C), carbon abundances are anticorrelated with Na abundances for SGB stars. On the other hand, N abundance correlates well with sodium among subgiant stars, even if the anticorrelation is less evident among TO stars. Finally, O is anticorrelated with N, as shown in Figure 15.
The overall distribution of light elements seems to point out that processes of proton-capture are at work. In the atmospheres of the stars studied we are just seeing the products of these reactions. In this case, the line of thought is the same as in Gratton et al. (2001): turn-off stars do not reach the temperature regime where the ON and NeNa cycles required to produce the Na-O anticorrelation are active, and moreover these stars have convective envelopes that are too small to have efficiently mixed the ashes of these nuclear processes up to the surface. The same conclusion holds also for subgiants.
The bottom line is that what we are seeing are the by-products of nuclear burning and dredge-up in stars, that are now not observable, but that have returned their elements to the intracluster medium or directly to the surface of the presently observed stars.
6.4 CNO arithmetic
Having now also O abundances at hand for program stars, it is possible to test in another way if the observed pattern of C, N, O abundances can be explained by the CNO-cycle alone. In fact, in this hypothesis it is only the relative content of C, N and O that may change, as a consequence of different reaction rates; their sum has to be constant.
In Figure 16 the C abundances are plotted as a function of the sum CN for our program stars and, as a reference, for stars with abundances from low dispersion studies, as in Figure 7.
From this Fig. one has the impression that the sum CN increases with decreasing C abundance; this is confirmed by computing Kendall’s , which implies that this anti-correlation is highly significative, at the 99.3% level. Hence the observed pattern cannot be due simply to a transformation of C into N by the incomplete CN-cycle of H-burning.
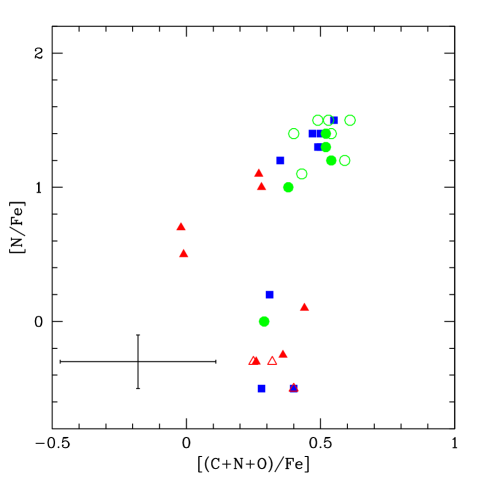
The possible alternatives are then either that the ON-cycle is also involved, adding N freshly produced from O, or that some variable amount of already existing N is superimposed on the effects of CN reconversion. In this regard, clearcut evidence is provided by Figure 17, where the run of [N/Fe] as a function of the total sum CNO is shown. Over a spread in N of almost 2 dex, the sum remains almost (but not exactly, see below) constant; this by itself implies that the complete CNO-cycle has been at work to produce the observed pattern. Once more, neither subgiants nor, in particular, unevolved turn-off stars are able to forge elements (such as Na) that require high-temperature proton-capture reactions. Moreover, they are unable to mix in their convective envelopes such products to the atmospheric layers; hence, we are forced to conclude that the CNO cycle was at work in stars other than those presently observed.
The best candidates at hand are the intermediate-mass AGB stars.
Another class of possible polluters was recently suggested by Denissenkov and Weiss (2004). According to their computations, as well as those previously reported by Denissenkov and Herwig (2003), nucleosynthesis in IM-AGB stars with strong O-depletion is not accompanied by large Na production (hence, the matter is not Na-enhanced as required by the Na-O anticorrelation); instead, strong Mg depletions are expected, and this has never been observed in globular cluster stars. Similar results has been recently obtained by Herwig (2004) and Fenner et al. (2004). As a way out, Denissenkov and Weiss (2004) suggested that peculiar CNO abundances, as observed in unevolved cluster stars, might be a result of the H-burning shell in upper RGB stars of mass slightly larger than those presently observed in GCs, provided that they have experienced some degree of extra-mixing (see Denissenkov and Herwig 2003), followed by mass transfer onto less evolved stars.
6.4.1 A simple dilution model
So far, it has been shown (i) that globular cluster stars exhibit the same mixing episodes observed for field stars; (ii) that no slightly evolved cluster star has an abundance pattern the same as that observed among stars close to tip of the red giant branch; and (iii) that there may be an excess in the sum of C+N+O in N-rich stars, that can possibly be attributed to some 12C in excess with respect to the predictions of the complete CNO cycle.
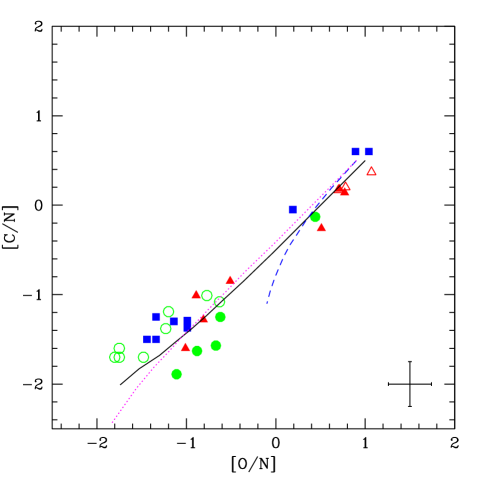
To test how various schemes work to explain these observational facts, we will consider here simple models for the dilution of the products of CNO burning at various temperatures, and will compare their predictions with the run of the [C/N] ratio against [O/N] ratio shown in Figure 18, as well as with the other pieces of information we have gathered.
When constructing our dilution models, we started noticing that in the complete CNO-cycle at high temperature ( K), at equilibrium the O abundance is decreased much more than the C abundance (factors of about 50 and 6, respectively: Langer et al. 1993). This is quite different from the case of the incomplete CN-cycle at low temperature ( K), where the C abundance is decreased by a factor of 6, as before, but the O abundance is not modified.
Testing the scenario of pollution by the complete CNO-cycle
We started by considering the standard scenario of pollution by the complete CNO-cycle. Let be the fraction of gas forming unevolved stars in globular clusters that has been burnt through the complete CNO-cycle and let us assume the remaining gas to be of primordial composition. It follows that the abundance of C and O in the mixed gas with respect to the initial composition is: , where is the abundance of C and O at the equilibrium of the CNO-cycle (0.17 and 0.02 for C and O, respectively). The N abundance can be derived by the constraint that the total CNO abundance is constant.
If we assume that initially [C/N]=0.5 and [O/N]=1.0 (which is approximatively the composition of N-poor stars in the three clusters: see Figure 18), we may then predict the values of [C/N] and [O/N] for different fractions of the gas consumed in the complete CNO-cycle, with being the original composition. This trend is shown as a solid line in Figure 18. This line reproduces fairly well the location of observational points in Figure 18, albeit it predicts somewhat too low C abundances for N-rich dwarfs. Dilution factors adequate to reproduce N-rich stars are . Such values also allow reproducing the isotopic ratio 12C/13C observed in unevolved stars. Moreover, with these factors we might quite easily obtain a Li abundance roughly similar to the original one, provided that the diluting material be Li-rich (as expected from some of the IM-AGB stars: Ventura et al. 2001).
On the other hand, with such large dilution factors, the models by Langer et al. (1993) would predict too much Na, by more than a factor of about 10; this is because in these models Na is produced also by 20Ne. In order to reproduce the observations we would need that Na be forged only from 22Ne.
Testing the scenario of polluting RGB stars
Let us now use a similar model to test the scenario envisioned by Denissenkov and Weiss (2004) of pollution by RGB stars. In this case, mixing occurs in a fraction of upper-RGB stars and afterward a transfer of material onto the dwarfs occurs.
Let us assume that the upper-RGB stars might have either one of the following 2 compositions: (i) a chemical composition typical of field upper-RGB stars (N-poor, i.e. N only coming from incomplete CN-cycle) or (ii) a composition from very deep mixing, where complete-CNO cycle and Na-enrichment are involved. For these stars we will use the most extreme case observed (i.e. N-rich). Note that in both groups of stars all Li is destroyed. The starting compositions () assumed are then: 8.60/8.00/8.90/6.30/9.11, 8.60/7.50/9.30/5.80/9.38, 7.50/9.33/8.40/6.80/9.38 and 8.00/8.50/9.30/5.80/9.38 for the solar, original, N-rich and N-poor cases, respectively.
By varying the dilution factor , we obtain the abundance pattern for the two cases original+ (N-rich) and original+ (N-poor). Results are overplotted as a dotted (magenta) line and a dashed (blue) line, respectively, over our data in Figure 18. The first case is very similar to the case made above for the complete CNO cycle, differences being only due to the slightly different assumptions made about the compositions.
If this scenario is correct, it would be expected that the observed points should lie between the two lines. Actually, the line representing pollution by N-poor stars does not reproduce the observations; on the other hand, the line representing N-rich stars fits the data reasonably well (although not as well the N-rich dwarfs), requiring values similar to those obtained in the previous subsection.
The inadequacy of models with pollution by N-poor stars is evident when noticing that within this scheme we should expect to find C-poor, Na-poor stars. However, these stars are not observed at all (see Figure 13). The inference is that in globular clusters there are no dwarfs polluted by RGB stars with a chemical composition typical of field RGB stars. Within this scheme it should then be assumed that only stars experiencing very deep mixing polluted unevolved stars. One would then be forced to conclude that only a fraction of RGB stars, and only those in clusters, lose a great amount of mass, and that these very same stars do experience also very deep mixing, likely due to the same physical mechanism (rotation? binarity?).
An additional problem with this scheme is that N-rich giants have generally no Li at their surface. We would then expect that Li be depleted by a factor of 2 to 5 in main sequence stars of globular clusters like NGC 6397, in contrast with observations (Bonifacio et al. 2002).
There are further additional concerns in a mechanism involving pollution by RGB stars. The lost material ends up polluting other stars. It cannot be a simple surface pollution: in fact, in this case there should be also noticeable differences between dwarfs and subgiants (due to different masses of the convective envelopes) which is not observed. Since most of the unevolved stars observed in clusters like NGC 6397 and NGC 6752 are N-rich, the total amount of mass lost by these RGB stars should be large, about 80 of the cluster mass. This seems unlikely, since an RGB star cannot lose more than of its mass, the remaining being locked in the degenerate core. Another problem concerns the epoch when this pollution occurred. In fact, if the mass was lost in recent times, one would expect a large numbers of young stars, obviously not observed. On the other hand, IM-AGB stars may eject almost 80% of their mass (see e.g. Marigo et al. 1998), hence the mass requirement in this case would be met if the original initial mass function (IMF) of the cluster stars is not too steep, allowing to form many AGB stars. Evidences for a flatter local IMF are discussed, in this context, by e.g. D’Antona (2004) and Briley et al. (2001).
6.4.2 The triple- scenario
As pointed out in the previous discussion, another problem is evident from Figure 18. The dilution models predict that stars having [O/N] should have [C/N], whereas our observations show [C/N]. This suggests the presence of an additional source of 12C, very likely through the triple process. A similar excess of 12C is also suggested by the 12C/13C isotopic ratio. Let us in fact assume that is the fraction of 12C produced by triple and the fraction of 12C resulting by CNO-processing. Hence, we may write for 13C (which is produced only by the CNO-cycle) 13C = , where is the equilibrium value of the isotopic ratio 12C/13C. We can now re-write the fraction of 12C from CNO by subtracting the contribution of 13C and of 12C by triple, i.e. as 12C = 13C = -, hence as . The observed C isotopic ratio is then = from which, with simple algebra, the fraction of 12C due to triple is
By using an observed ratio (see Table 1) of about 8, we derive that about 60% of the C observed is likely to come from triple burning.
This estimate compares well with what is known from models of IM-AGB stars. In fact, typical estimates of the C abundance in NGC 6752, [C/Fe] corresponds to a mass fraction of of 12C, a value entirely consistent with model predictions for a 5 M⊙ star of similar metallicity (Ventura et al. 2004).
Up to now, our conclusions are based only on the observation that there is too much C, with respect to the very large N-enhancements, and carbon isotopic ratios too high to be explained purely with a re-arrangement of elements involved in the CNO-cycle. However, other additional evidence comes from the O abundances. In the low-O, low-C region of Figure 18 the existence of a sort of plateau also suggests that the products of triple are involved. This is not very clear in subgiants, but quite evident in dwarfs, whose C abundances have not been modified by the first dredge-up.
7 CONCLUSIONS
Summarizing, we can consider various mass ranges of likely polluters that contributed to the chemical composition in stars presently observed:
-
•
metal-poor stars in the intermediate mass range, say , are the classical donors considered for CH-stars (McClure and Woodsworth 1990). This is likely not the correct mass range for typical stars polluting globular clusters, since they also produce consistent amounts of process elements, that are not seen to vary in cluster stars.
-
•
stars less massive than this range (the range considered by Denissenkov and Weiss 2004) are also unlikely. Apart from the possible excess of 12C discussed above, either (i) they release a large mass to be successively accreted, and this is unlikely, since the polluted stars would have then a large mass range, the cluster TO would be smeared out and we would end up with a cluster mostly composed of blue stragglers222Actually, we think that the mechanism proposed by Denissenkov and Weiss (2004) is indeed active in a minority of globular cluster stars belonging to binary systems, producing the blue straggler stars with the classical McCrea (1964) mechanism; or (ii) they provide a small amout of polluting mass. This second possibility is also unpalatable because a thin layer accreted on the surface of a main sequence star would be diluted when the stars climb toward the SGB phase by the extension of the convective envelope. The evidence of large spread in C, N, O, Na abundances at all luminosities (see Briley, Cohen and Stetson 2002) strongly argues against a simple contamination of stellar surface.
-
•
finally the stars more massive than the above range are just the IM-AGB stars that, at the present, are in our opinion the best candidate polluters.
Finally, we must recall that at least half or even 2/3 of stars observed in globular clusters seem to be heavily affected by large alterations in their chemical composition. In order to explain this with mass exchange from a RGB star onto a companion in a binary system, we would probably end up with a huge number of low-mass X-ray binaries in GCs, at odds with observations.
In summary, our findings and discussion strongly suggest that the polluters were intermediate mass AGB stars, and upper RGB stars.
On the other hand, the scenario in which IM-AGB stars are the primary contributors in shaping the chemical mix of the early cluster environment still has to face problems (Denissenkov and Herwig 2003, Denissenkov and Weiss 2004, Herwig 2004, Fenner et al. 2004): current models do not seem to reproduce the required observational pattern. It must be however reminded that, as noticed by Denissenkov and Weiss, the yields computed from models of these stars strongly depend on two poorly known physical inputs, namely the treatment of mass loss and the efficiency of convective transport (see also Ventura et al. 2002). Further progress in stellar modeling is strongly urged.
Acknowledgements.
This research has made use of the SIMBAD data base, operated at CDS, Strasbourg, France. We thank the ESO staff at Paranal (Chile) for their help during observing runs, Elena Sabbi for useful discussion on LMXB’s in GCs, and the referee for very careful reading of the manuscript.References
- (1) Anders, E., Grevesse, N. 1989, Geochim. Cosmochim. Acta, 53, 197
- (2) Armosky, B.J., Sneden, C., Langer, G.E., Kraft, R.P. 1994, AJ, 108, 1364
- (3) Bellman, S., Briley, M.M., Smith, G.H., Claver, C.F. 2001, PASP, 113, 326
- (4) Bergbusch, P.A., VandenBerg, D.A. 2001, ApJ, 556, 322
- (5) Bonifacio, P., Pasquini, L. Spite, F., Bragaglia, A., Carretta, E. et al. 2002, A&A, 390, 91
- (6) Briley, M.M., Bell, R.A., Hoban, S., Dickens, R.J. 1990, ApJ, 359, 307
- (7) Briley, M.M., Cohen, J.G. 2001, AJ, 122, 242
- (8) Briley, M.M., Cohen, J.G., Stetson, P.B. 2002, ApJ, 579, L17
- (9) Briley, M.M., Cohen, J.G., Stetson, P.B. 2004a, AJ, 127, 1579
- (10) Briley, M.M., Harbeck, D., Smith, G.H., Grebel, E.K. 2004b, AJ, 127, 1588
- (11) Briley, M.M., Smith, G.H., Clavier, C.F. 2001, AJ, 122, 2561
- (12) Brown, J.A., Wallerstein, G., Oke J.B. 1990, AJ, 100, 1561
- (13) Brzozowski, J., Bunker, P., Elander, N., Erman, P. 1976, ApJ, 207, 414
- (14) Cannon, R.D., Croke, B.F.W., Bell, R.A., Hesser, J.E., & Stathakis, R.A. 1998, MNRAS, 298, 601
- (15) Carretta, E., Gratton, R.G., Bragaglia, A., Bonifacio, P. & Pasquini, L. 2004, A&A, 416, 925
- (16) Carretta, E. 1994, Ph.D. Thesis, University of Padova
- (17) Castilho, B.V., Pasquini, L., Allen, D.M., Barbuy, B., & Molaro, P., 2000, A&A 361, 92
- (18) Charbonnel, C. 1994, A&A, 282, 811
- (19) Charbonnel, C. 1995, ApJ, 453, L41
- (20) Cohen, J.G., Briley, M.M., Stetson, P.B. 2002, AJ, 123, 2525
- (21) D’Antona, F. 2004, Mem.SAIt, 75, 388
- (22) Denisenkov, P.A., Denisenkova, S.N. 1989, A.Tsir., 1538, 11
- (23) Denissenkov, P.A., Herwig, F. 2003, ApJ, 590, L99
- (24) Denissenkov, P.A., Weiss, A. 2004, ApJ, 603, 119
- (25) Engleman, R., Rouse, P.E. 1975, JQSRT, 15, 831
- (26) Fenner, Y., Campbell, S., Karakas, A.I., Lattanzio, J.C., & Gibson, B.K. 2004, MNRAS, in press (astro-ph/0406360)
- (27) Gratton, R.G., Carretta, E., Eriksson, K., & Gustafsson, B. 1999, A&A 350, 955
- (28) Gratton, R.G., Sneden, C., Carretta, E. 2004, ARA&A, in press
- (29) Gratton, R.G., Sneden, C., Carretta, E., & Bragaglia, A. 2000, A&A, 354, 169
- (30) Gratton, R.G., Bonifacio, P., Bragaglia, A., Carretta, E., Castellani, V. et al. 2001, A&A, 369, 87
- (31) Gratton, R.G., Bragaglia, A., Carretta, E., Clementini, G., Desidera, S., Grundahl, F., Lucatello, S. 2003, A&A, 408, 529
- (32) Grevesse, N., Sauval, A.J. 1998, Space Science Rev., 85, 161
- (33) Grundahl, F., Briley, M., Nissen, P.E., Feltzing, S. 2002, A&A, 385, L14
- (34) Herwig, F., 2004, ApJ, 605, 425
- (35) Iben, I.Jr. 1964, ApJ, 140, 1631
- (36) James, G., François, P., Bonifacio, P., Bragaglia, A., Carretta, E. et al. (2004), A&A, 414, 1071
- (37) Kurucz, R.L. 1995, CD-ROM 13, Smithsonian Astrophysical Observatory, Cambridge
- (38) Kurucz, R.L. 1995, CD-ROM 23, Smithsonian Astrophysical Observatory, Cambridge
- (39) Kurucz, R.L., Furenlid, I. & Brault, J. 1984, National Solar Observatory Atlas, Sunspot, New mexico, National Solar Observatory, 1984
- (40) Langer, G.E., Hoffman, R., & Sneden, C. 1993, PASP, 105, 301
- (41) Lucatello, S., Gratton, R.G., Cohen, J.G., Beers, T.C., Christlieb, N., Carretta, E. & Ramirez, S. 2003, AJ, 125, 875
- (42) Marigo, P., Bressan, A., Chiosi, C. 1998, A&A, 331, 564
- (43) McClure, R.D., Woodsworth, A.W. 1990, ApJ, 352, 709
- (44) McCrea, W.H. 1964, MNRAS, 128, 147
- (45) Moore, C.E., Minnaert, M.G.J., Houtgast, J. 1966, The solar spectrum 2935 Å to 8770 Å, NBS, Mono, 61
- (46) Norris, J.E., & Da Costa, G.S. 1995, ApJL, 441, L81
- (47) Osborn, W. 1971 Observatory, 91, 223
- (48) Shetrone, M.D. 2003, ApJ, 585, L45
- (49) Smith, G.H., Martell, S.L. 2003, PASP, 115, 1211
- (50) Sneden, C., Pilachowski, C.A., Vandenberg, D.A. 1986, ApJ, 311, 826
- (51) Sneden, C., Kraft, R.P., Guhathakurta, P., Peterson, R.C., Fulbright, J.P. 2004, AJ, 127, 2162
- (52) Suntzeff, N.B., & Smith, V. 1991, ApJ, 381, 160
- (53) Sweigart, A.V., & Gross, P.G. 1978, ApJS, 36, 405
- (54) Sweigart, A.V., & Mengel, J.G. 1979, ApJ, 229, 624
- (55) Ventura, P., D’Antona, F., Mazzitelli, I. 2002, A&A, 393, 215
- (56) Ventura, P., D’Antona, F., Mazzitelli, I, 2004, in Astrophysical Impact of Abundances in Globular Cluster Stars, F. D’Antona & G. Da Costa eds., MSAIt, 75, 335
- (57) Ventura, P. D’Antona, F., Mazzitelli, I., & Gratton, R. 2001, ApJ, 550, L65
- (58) Yong, D., Grundahl, F., Lambert, D.L., Nissen, P.E., Shetrone, M.D. 2003, A&A, 402, 985