Spectroscopic analysis of tremendous–outburst–nova candidates ††thanks: Based on observations collected at the European Southern Observatory, La Silla, Chile
In the course of a long-term project investigating classical novae with large outburst amplitudes, we have performed optical spectroscopy of several old–nova candidates. We here present the spectra of the candidates V630 Sgr, XX Tau, CQ Vel, V842 Cen, and V529 Ori, that hitherto lacked such classification. While the first four show typical spectra for cataclysmic variables, and can thus be identified as such, V529 Ori is probably misclassified. Of special interest are the two systems XX Tau and V842 Cen, which show all signs for being low mass transfer systems. As such they can be used to judge the evolution scenarios for novae. In particular, given the rather young age of their outburst, it appears more likely that these systems are not on their way into hibernation, (i.e., cutting off mass transfer for a longer period of time), but are simply settling down towards their original configuration of comparatively low, but steady, mass transfer, such as for dwarf novae.
Key Words.:
stars: novae – stars: individual: V630 Sgr, XX Tau, CQ Vel, V842 Cen, V529 Ori1 Introduction
Novae are a subclass of cataclysmic variable stars (CVs) (see Warner warn95 (1995) for a general introduction on these objects) and hence are interacting binary systems, which consist of a white dwarf primary accreting mass from a main sequence like late type secondary star. In the subclass of novae the such gradually increasing hydrogen–rich material on the surface of the white dwarf, has at one point reached a critical mass which resulted in a thermonuclear runaway, the nova explosion.
The evolution of CVs generally represents an evolution towards shorter periods due to continuous loss of angular momentum by magnetic braking and gravitational radiation. Near an orbital period of 78 min, however, the secondary star becomes degenerate, and the loss of mass now leads to an increase of the separation and thus an increasing orbital period. At this period minimum the thermal timescale of the secondary becomes longer than the timescale of angular momentum loss by gravitational radiation, leading to a drastic increase of the evolutionary lifetime of the CV near this point. Evolutionary models predict that the vast majority of CVs should have already evolved beyond that point, yielding a concentration of systems close to the period minimum (Stehle et al. steh+96 (1996)). This, however, is in sharp contrast to the observed period distribution (Ritter & Kolb ritt+98 (1998)). It can be in part understood as a possible observational bias, as these systems are supposed to inhabit very low mass–transfer rates and thus to be intrinsically very faint (Stehle et al. steh+97 (1997)). Dwarf novae that show very large outburst amplitudes, so–called TOADs (tremendous outburst amplitude dwarf novae), are therefore generally seen as good candidates for being evolved CVs (Howell et al. howe+97 (1997)).
The outburst mechanism of a classical nova is a physically different phenomenon than the disc outburst of a dwarf nova. Still, it is reasonable to suspect a similar correlation between the outburst amplitude – measured as the difference between the outburst peak magnitude and the quiescence magnitude of the post nova – and the mass transfer rate of the post nova. It can be assumed that the absolute magnitude of a nova explosion differs only slightly for different systems, as it depends mainly on the mass of the white dwarf (Livio livi92 (1992)), the latter depending only weakly on the orbital period (Ritter & Kolb 1998). Recent studies show that accretion discs may reform within months after a nova outburst (Retter et al. rett+98 (1998)). Therefore, similar to the case of dwarf novae, an intrinsically faint system would be indicated by an unusual large outburst amplitude. The low intrinsic brightness might be either due to the CV being at high inclination (see Warner warn87 (1987) for a detailed analysis of the inclination/outburst amplitude dependency) or because the post nova inhabits a faint accretion disc with a low mass–transfer rate. We therefore use this phenomenological approach to examine the nova population for a possible subclass of low mass transfer systems.
The existence of such a tremendous outburst nova (TON) population could strengthen the so–called ‘hibernation scenario’, which proposes an evolutionary bond between several CV subclasses (Shara et al. shar+86 (1986)). The basic statements of this scenario are a) that all CVs undergo nova outbursts, b) that they show more than one such outburst in their lifetime, with recurrence times years, and c) that they vanish into a state of hibernation between these outbursts. Other subgroups of CVs, e.g. dwarf novae or nova–likes, would thus represent novae between two outbursts. Theoretical models indeed show that nova outbursts should be possible even after a stage of very low mass–transfer (Prialnik & Shara pria+86 (1986)). Observational evidence, however, is still missing.
We have started a project to examine the nova population for possible TONs. One part consists in the recovery and identification of lost old novae and the determination of their quiescent magnitude to determine the outburst amplitude. In this paper, we present the spectroscopic analysis for five objects which have been reported as recovered novae but with so far uncertain classification.
2 Observation and data reduction
| Object | Date | Instrument | Grism/Slit | [s] |
|---|---|---|---|---|
| V630 Sgr | 2001-07-16 | DFOSC/1.54D | G4/1.5” | 2400 |
| XX Tau | 2003-01-06 | EFOSC2/3.6 | G11/2.0” | 2400 |
| V529 Ori | 2003-01-07 | EFOSC2/3.6 | G11/2.0” | 1200 |
| CQ Vel | 2003-01-07 | EFOSC2/3.6 | G11/2.0” | 4800 |
| V842 Cen | 2003-05-12 | EMMI/NTT | G3/1.0” | 9300 |
The observations have been performed in the years from 2001 to 2003 at La Silla Observatory, Chile, using DFOSC at the 1.54m Danish telescope, EMMI at the 3.5m New Technology Telescope, or EFOSC at the 3.6m telescope. The details of these observations are given in table 1.
Standard reduction of the data has been done using IRAF. The BIAS has been subtracted and the data have been divided by a flat field, which was normalised by fitting Chebyshev functions of high order to remove the detector specific spectral response. The spectra have been optimally extracted (Horne horn86 (1986)). Wavelength calibration yielded a final FWHM resolution of 1.0 nm for DFOSC, 0.84 nm for EMMI, and 1.2 nm for the EFOSC data.
Rough flux calibration has been performed with respect to spectrophotometric standards EG 274 (DFOSC), LTT 4363 (EMMI), and LTT 3864 (EFOSC). Since the nights have not been photometric, the absolute flux values have an uncertainty of at least 20%. Relative fluxes, used to compare different parts of the spectrum (see Table 2 for details), are naturally more accurate.
Since no information on the individual interstellar extinction are available for any of these novae, we present the spectra as observed, i.e. without reddening correction. The reddening issue is discussed in more detail for the individual systems when appropriate.
3 V630 Sagittarii

V630 Sgr has been detected in outburst in 1936 (Okabayashi okab36 (1936)). While all older sources (Parenago pare49 (1949), Gaposchkin gapo55 (1955); Kukarkin et al. kuka+69 (1969)) list the object with a visual magnitude of at maximum, suddenly a value of appears in the fourth edition of the GCVS (Kholopov et al. khol+83 (1983)). The only additional reference with respect to previous editions of this catalogue is the paper by Gaposchkin gapo55 (1955), but Gaposchkin’s light curve also gives at maximum. There it is also mentioned that on a photographic plate taken the day before the nova discovery, the object was still below , which makes it very unlikely that the maximum has been missed. Parenago (pare49 (1949)) especially argues with the shape of their light curve that the maximum of the nova has not been missed but is actually around . For these reasons we believe that the values have been changed by mistake between edition 3 and 4 of the GCVS, and that the now listed maximum value (Downes et al. down+01 (2001)) is actually wrong, the real maximum value being .
With V630 Sgr is among the fastest novae ever observed, Duerbeck (duer81 (1981)) classified it as A (fast decline without major disturbances). He also used the light curve to derive its distance . Shafter (shaf97 (1997)), who later estimated the value to be had used the wrong maximum value. Using instead the value of , his method yields , well in agreement with Duerbeck. From the short decay time and large amplitude (although derived from the maximum value) of V630 Sgr, Diaz & Steiner (diaz+91 (1991)) concluded that the nova might be of magnetic type. Harrison & Gehrz (harr+94 (1994)) have observed V630 Sgr in four IR bands with IRAS but obtained no detection in any of them. Recent high–speed photometry by Woudt & Warner (woud+01 (2001)) revealed a shallow eclipse as well as permanent superhumps for this nova remnant. They determined the orbital period h and the superhump period h.
The spectrum of V630 Sgr (see Fig. 1) is dominated by strong Balmer and He ii lines in emission and thus confirms the nova recovery. The emission lines show widths between 1.5 nm and 2.4 nm (see Table 2), which compute to an average projected rotation velocity of . Note also that, in spite of the high inclination of the system, the emission lines are rather narrow and not double–peaked at our resolution of 1 nm. This might indicate that the disc is optically thick in the hydrogen lines.
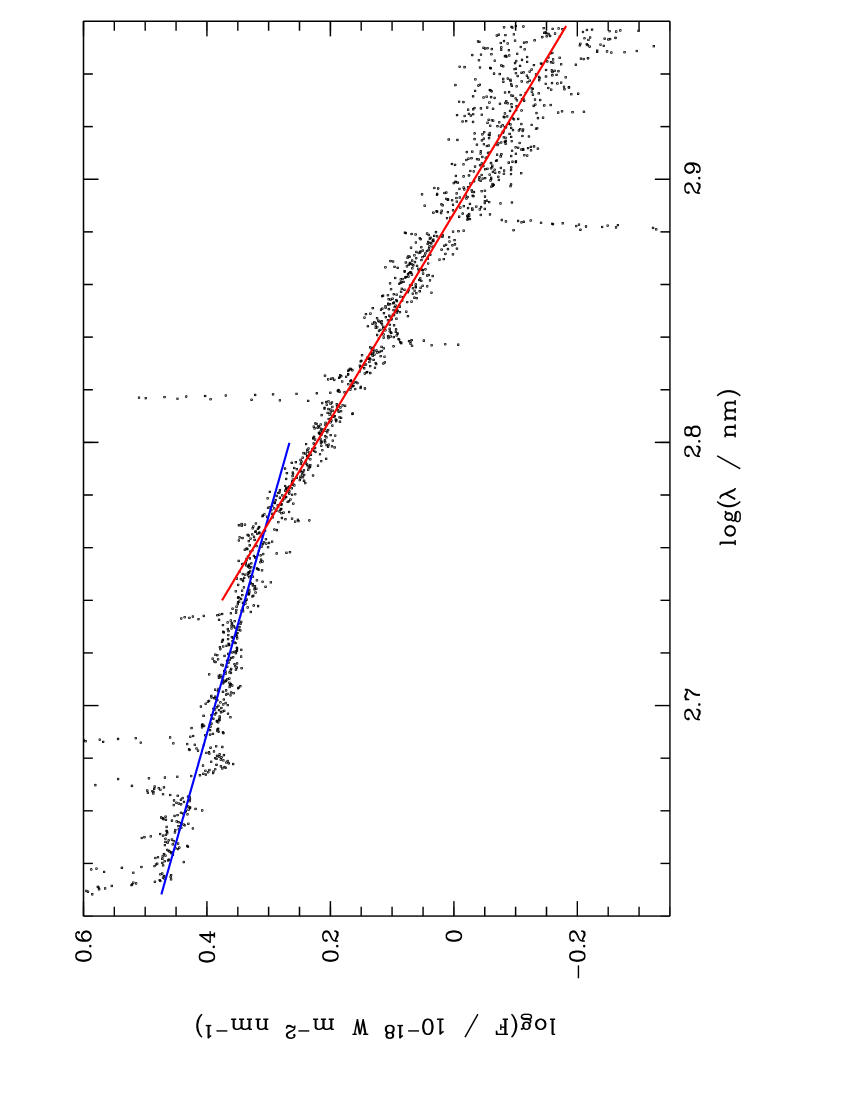
The possibility of a hot, optically thick, disc is also supported by the description of the continuum slope requiring a rather high value . In this context we note that the continuum of V630 Sgr cannot be described by a single power law, but that it consists of two different slopes (Fig. 2).
The assumption of a hot accretion disc with fits only the redder part of the spectrum down to a wavelength of 582 nm and a corresponding temperature . For shorter wavelengths and thus higher temperatures we find a different slope of .
This flatter slope reflects the absence of an accretion disc at short radii, and instead the presence of a different continuum emitting region, which might be associated with the suspected magnetic accretion of this system or an optically thin region in the inner part of the accretion disc. Time–resolved spectroscopy and a detailed investigation of the emission distribution in the accretion disc of this system is necessary to clarify these issues.
4 XX Tauri

XX Tau has been discovered in November 1927 by Schwassmann & Wachmann (schw+28 (1928)). Analyses of older Harvard plates give the first light curve and show that the maximum at 5.9p was reached on October 1, 1927 (Cannon cann27 (1927)). Several minima during the early decline (Payne–Gaposchkin payn57 (1957)) suggest the formation of dust in this nova outburst. The same feature is addressed by Duerbeck’s (duer81 (1981)) classification as Cb of which class FH Ser is the prototype. He also gives d, which places XX Tau among the moderately fast novae.
XX Tau has been recovered by Cohen (cohe85 (1985)) via H photometry. She has also been able to spatially resolve the shell around the nova in H and R and gives its radius as 2.2 arcsec. From the expansion parallax that she derived, the distance of XX Tau is determined as 3.5 kpc (Shafter shaf97 (1997)). Downes & Duerbeck (down+00 (2000)) determined the interstellar extinction towards XX Tau as . The presence of hot dust is confirmed by the IRAS data of Harrison & Gehrz (harr+94 (1994)) who detected the nova at 12 m and 25 m. No detection has been accomplished in the 2mass second incremental data release (Hoard et al. hoar+02 (2002)) though.
The spectrum of XX Tau is given in Fig. 3. It is dominated by emission lines and hence confirms Cohen’s recovery. However, the presence of the Balmer lines down to H 11 and the strength of He I compared to He II gives the object the appearance of a typical dwarf nova rather than an old classical nova. We tentatively conclude therefore that XX Tau represents an old nova with a low mass transfer rate, which has sufficiently cooled down to look like a ’normal’ dwarf nova. Since our spectrum furthermore does not show any spectral signatures of the secondary star, we expect XX Tau to have a comparatively short orbital period.
The line widths as given in Tab. 2 compute to a velocity of . Assuming this to be the radial projection of the rotational velocity, these moderately high values suggest that XX Tau is seen at sufficiently high inclination to make it an interesting system for time resolved follow–up observations.
5 V529 Orionis

V529 Ori is the oldest nova in our sample, and has been discovered by J. Hevelius on March 28, 1678 while he was observing a lunar occultation of Ori. V529 Ori or 48 Ori, as Hevelius called it, ”followed the path of Ori with respect to the moon and was occulted between and ” (Hevelius hev1679 (1679)). From these observations, Ashworth (ashw81 (1981)) recalculated the position of V529 Ori using modern values for the coordinates of Ori. He also showed that a supposed later observation of this object in 1750 is actually just a quotation of Hevelius’ catalogue and thus concluded that V529 Ori has not been observed as recurrent nova as claimed before.
Several attempts to recover this old nova failed. The here observed candidate has been proposed by Robertson et al. (robe+00 (2000)) on the basis of showing variability and H emission. Hoard et al. (hoar+02 (2002)) determined the NIR colours and of this candidate which turn out to be much redder than all other CVs in their catalogue and resemble more those of symbiotic stars.
The spectrum of V529 Ori shows indeed a strong and narrow H line on a very red continuum, as shown already by Robertson et al. (robe+00 (2000)). From our S/N we get upper limits on the strength of H for the equivalent width nm and for the line flux . Comparing these values with the strength of H (see Tab. 2) yields a Balmer decrement while 7 is about the maximum for any Balmer emission present in CVs (Williams will91 (1991)). Exploring the possibility that this extreme ratio is caused by interstellar reddening, we find that a very high value of is required to transform the observed slope to a flat continuum. Furthermore, the ratio of the equivalent widths, which is independent from the reddening, yields . This is just about consistent with the values obtained from Williams’ radiative transfer models with temperatures around 8000 K and . Hence, the assumption of extremely high reddening does in principle allow for the presence of a low temperature and low density accretion disc. Such cool and low density discs however, are optically thin and thus show strong emission lines in several neutral or easily excitable elements like He I, Ca II, and Fe II. No such lines are present in the spectrum of V529 Ori which makes the identification as a CV and hence as an old nova doubtful.
The red continuum together with the H emission rather suggest that this object could be a classical T Tauri star or even a post T Tauri. Note, that we find some weak absorption around the Li I resonance line at 670.8 nm but that our spectral resolution is too low for a clear assignment. High or medium resolved spectroscopy of this object is desired to clarify the presence of Lithium and thus allow a proper classification of this object. The FWHM of the H line, which corresponds to a velocity of about 700 km/s, is high but still consistent with what is expected for accretion on T Tauris (see e.g. Navascués & Martín nava+03 (2003)).
With these considerations and taking into account the large uncertainty of the original coordinates, we thus believe that the actual nova has still not been identified.
6 CQ Velorum

CQ Vel has been discovered in outburst by C.J. van Houten, Leiden, on Johannesburg plates from 1940 (van Houten hout50 (1950)). A follow–up investigation of Harvard plates revealed that the nova reached maximum light on April 19, 1940 (Hoffleit hoff50 (1950)) and was a moderately fast nova with d (Duerbeck duer81 (1981)). Hoffleit also indicates that the light curve showed strong brightness fluctuations, Borra & Andersen (borr+70 (1970)) pointed out the similarity to FH Ser (strong decline), Duerbeck (duer81 (1981)) classified the nova as type Cb (strong brightness decline during maximum), and Rosenbusch (rose99 (1999)) compared its temporary fading to the light curve of DQ Her. All these comparisons or classifications refer to the same feature of the light curve, the sudden drop during the transition state, which is best explained by assuming the production of dust in this state, which would then cause the drop of brightness via extinction. However, Harrison & Gehrz (harr+94 (1994)) report that the system has not been detected by IRAS, and thus the dust has either faded or cooled down significantly.
Using the ’Maximum magnitude versus rate of decline’ method (Della Valle & Livio dell+95 (1995)), Shafter (shaf97 (1997)) determined the distance of CQ Vel as kpc. With this value and Rosenbusch’s estimated nova shell radius of 0.2 mpc, the apparent size of the shell computes to 0.01”. Gill & O’Brien (gill+98 (1998)) tried to map the nova remnant but found it to be not extended at a seeing of 1.1”. Munari & Zwitter (muna+98 (1998)) tried to take a first spectrum of the nova, but with the object was too faint for their survey.
Duerbeck (duer87 (1987)) gives two possible candidates in the vicinity of the nova. The high–speed photometry by Woudt & Warner (woud+01 (2001)) revealed that the brighter of those candidates shows constant brightness, while the slightly fainter one shows the typical CV flickering over a four hour observing run and has hence been identified as the old nova.
The spectrum of CQ Vel is given in Fig.5 and shows moderately strong Balmer emission as well as He II. Although of rather poor signal/noise, it hence confirms Woudt & Warner’s identification.

7 V842 Centauri
The most recent nova of our sample is V842 Cen, whose outburst in 1986 has been discovered by McNaught (mcna86 (1986)). He also identified the nova progenitor as a faint (V18) object on the UK Schmidt plates. The nova reached a visual magnitude of 4.6 (Duerbeck duer87 (1987)). During its decline it has been well observed, both photometrically and spectroscopically. Whitelock (whit87 (1987)) determined d and thus classified it as moderately fast nova. She also found evidence for dust formation in the optical and IR light curves. The presence of dust is confirmed by infrared spectroscopy during and after the formation process (e.g. Wichmann et al. wich+90 (1990); Smith et al. smit+94 (1994)).
H/[Nii] observations by Gill & O’Brien (gill+98 (1998)) revealed a shell of 1.6 arcsec diameter in 1995. In March 1998, Downes & Duerbeck (down+00 (2000)) took H and [Oiii] images which show an incomplete circular shell of arcsec diameter. A single expansion velocity is not consistent with these two shell sizes. However, emission line studies of the nova decline show two expansion velocity components, a high density region with and low density material with . Downes & Duerbeck showed that they can explain the two shell sizes by assuming that their larger shell is built from the low–density material with high expansion velocity while the smaller shell of Gill & O’Brien contains the slower expanding high–density material. This yields a distance of V842 Cen of , which is consistent with values found from ’maximum vs decline’ methods and various reddening estimates (Sekiguchi et al. seki+89 (1989)).
Recent high speed photometry by Woudt & Warner (woud+03 (2003)) show a still active system, continuously flaring on time scales of 5 min, but no orbital modulation. They thus conclude that the system is probably seen at low inclination.
The optical spectrum (see Fig. 6) is similar to that of XX Tau in the sense that the complete Balmer series is present in emission, and that He I is more dominant than He II. In this respect, similar to XX Tau, the spectrum resembles that of a dwarf nova. This case is especially interesting, as the outburst of V842 Cen happened only seventeen years ago, and the nova had not yet time to cool down. This is supported by the extremely blue continuum. For the blue slope we derive which is far bluer than expected for a steady–state disc; for comparison, Lynden-Bell (lynd69 (1969)) calculates a slope of for a large steady state disc radiating like a black body. For nm, the continuum slope can instead be fitted with , this value being much more reasonable for an accretion disc. The interpretation is hence that due to the short time the nova had to cool down, either the white dwarf itself or a single region in the accretion disc are still extremely heated, thus yielding an additional blue component to the continuum which is thus not yet disc dominated.
| Nova | Date | Transition | FWHM [nm] | [nm] | F [ W m-2] | |||
|---|---|---|---|---|---|---|---|---|
| V630 Sgr | 1936 | 13.9m | H | |||||
| H | ||||||||
| H | ||||||||
| He II 541 | ||||||||
| He II 469 | ||||||||
| XX Tau | 1927 | H | ||||||
| H | ||||||||
| H | ||||||||
| H | ||||||||
| H | ||||||||
| H8 | ||||||||
| H9 | ||||||||
| He I 668 | ||||||||
| He I 588 | ||||||||
| He I 447 | ||||||||
| V529 Ori | 1678 | H | ||||||
| CQ Vel | 1940 | H | ||||||
| H | ||||||||
| V842 Cen | 1986 | H | ||||||
| H | ||||||||
| H | ||||||||
| H | ||||||||
| H | ||||||||
| H8 | ||||||||
| He I 706? | ||||||||
| He I 668 | ||||||||
| He I 588 | ||||||||
| He I 447 | ||||||||
| C IV 580 |
The continuum of V630 Sgr shows two slopes; the first for
nm, the second for nm.
V529 Ori shows no straight line in the double–logarithmic plot;
thus only a formal value for a linear fit to the data is given.
The continuum of V842 Cen shows two slopes; the first for
nm, the second for nm.
Further evidence comes from the comparison of the line profile of H with that of the other emission lines and especially the Balmer lines. Its broad profile indicates that H is still strongly disturbed by N II and thus that V842 Cen has not yet reached its quiescence level. Also the presence of C IV at 580 nm and several other high excitation lines suggest that the hot nova shell is still present in the spectrum. Therefore V842 Cen is an even stronger case of a nova that comprises a rather low mass transfer rate and might have an accordingly short orbital period.
Except for H and H which are obviously blended with other lines, the FWHM of the Balmer lines compute to an average velocity of km/s. For the lines of He I, instead, we find a significant lower average velocity of km/s. Most likely, these lines thus originate in different areas in the accretion disc. A detailed analysis of time series spectroscopy is necessary to confirm this idea. The general low values for the radial velocity component, as derived from the FWHM, confirm the conclusion that V842 Cen is seen at low inclination.
8 Discussion and Conclusion
The spectroscopic analysis of old novae reveals a variety of CV spectra not at all alike to each other (see e.g. Ringwald et al. ring+96 (1996)). The hibernation scenario suggests that the older novae, which had already time to cool down, are more likely to be in a state of low mass transfer and are thus less luminous than ’normal’ novae and look like intermediate systems between novae and dwarf novae (e.g. Shara et al. shar+86 (1986)). However, Ringwald et al. found no relation of the spectral appearance to the age of the nova outburst.
In this context, the existence of old novae like XX Tau and V842 Cen is of special interest. Both novae had their outburst in the 20th century and do as such not belong to the older novae. In fact, the outburst of V842 Cen occurred very recently. Still, both novae show spectra which suggest them to be intermediate objects between novae and dwarf novae. Although our spectra are not conclusive regarding the hibernation hypothesis, they are much more dwarf-nova like than anything that has been presented before in favour of hibernation. Their existence therefore supports the idea that CVs undergo indeed evolution into different subtypes. So far, it is not possible to decide if this evolution happens in cycles as suggested by the hibernation model.
Taking into account the date of the outburst, the time elapsed since then is much less than predicted by hibernation for a nova to appear like a dwarf nova. We therefore regard our observations as a piece of evidence against hibernation in its current form. Instead, since pre-novae tend to be of the same brightness or even fainter than post-novae (see e.g. Robinson robi75 (1975) and Retter & Lipkin rett+01 (2001)) these two novae are actually likely to originate from a CV subtype with rather low mass transfer rate, i.e. a dwarf nova. The possible existence of such systems has recently been discussed by Townsley & Bildsten (town+04 (2004)). Novae will of course have different outburst probabilities depending on the time necessary for accreting a sufficient amount of material onto the white dwarf and thus e.g. related to the mass transfer rate of the progenitor. Using the models of Townsley & Bildsten (town+04 (2004)), to estimate an average time for the accretion of the necessary material, one finds yr for an accretion rate of , while yr are necessary if the accretion rate is only . We therefore expect novae with nova–like origins to be far more numerous than novae with dwarf–nova origin, which could explain why so few of these systems are known.
To judge whether these low mass transfer novae look like dwarf novae because they originate from dwarf novae or because they are on their way into hibernation, we need to know their orbital periods. In the hibernation scenario one would expect to find them at all periods, with a higher appearance rate at longer periods where ’normal’ novae are found. If instead the low mass transfer novae are found mostly at short orbital periods, i.e. below the period gap, this would rather indicate that the nova progenitors in these cases also are low mass transfer dwarf novae. This does not necessarily rule out the hibernation scenario, but it removes some observational evidence for it.
To summarise, we would like to state that among the five, so far analysed TON candidates, four appear to be the rightly recovered novae, and two among these four show spectroscopic evidence for being some intermediate object between a classical and a dwarf nova. However, due to their rather young age, their existence does not support the hibernation scenario. Further spectroscopy of TONs are needed to get a larger sample of this nova type; the determination of their orbital periods will help to determine their origin. Thus the remaining statistical evidence for the hibernation scenario can be judged.
Acknowledgements.
We acknowledge that this research has made intense use of the Simbad database operated at CDS, Strasbourg, France.References
- (1) Ashworth, W.B. 1981, QJRAS 22, 22
- (2) Borra, E.F., Andersen, P.H. 1970, PASP 82, 1070
- (3) Cannon, A.J., 1927, BZ 9, 85
- (4) Cohen, J.G. 1985, ApJ 292, 90
- (5) Della Valle, M., Livio, M. 1995, ApJ 452, 704
- (6) Diaz, M.P., Steiner, J.E. 1991, PASP 103, 964
- (7) Downes, R.A., Duerbeck, H.W. 2000, AJ 120, 2007
- (8) Downes R.A., Webbink R.F., Shara M.M., Ritter H., Kolb U., Duerbeck H.W. 2001, PASP 113, 764, living edition
- (9) Duerbeck, H.W. 1981, PASP 93, 165
- (10) Duerbeck, H.W. 1987, Space Sci. Rev., 45, 1
- (11) Gaposchkin, S. 1955, AJ 60, 454
- (12) Gill, C.D., O’Brien, T.J., 1998, MNRAS 300, 221
- (13) Harrison, T.E., Gehrz, R.D. 1994, AJ 108, 1899
- (14) Hevelius 1679, Machina Coelestis II, Gedanum, p.814
- (15) Hoard, D.W., Wachter, S., Clark, L.L., Bowers, T.P. 2002, ApJ 565, 511
- (16) Hoffleit, D., 1950, AJ 55, 149
- (17) Horne, K. 1986, PASP 98, 609
- (18) van Houten, C.J. 1950, Leiden Ann. 20, 7
- (19) Howell, S.B., Rappaport, S., Politano, M. 1997, MNRAS, 287, 929
- (20) Kholopov, P., et al. 1983, The General Catalogue of Variable Stars (4th Edition)
- (21) Kukarkin, Kholopov, Kukarkin, et al. 1969, General Catalogue of Variable Stars (3rd Edition)
- (22) Livio, M. 1992, ApJ 393, 516
- (23) Lynden–Bell, D., 1969, Nature 223, 690
- (24) McNaught, R.H. 1986, IAUC 4274
- (25) Munari, U., Zwitter, T., 1998, A&AS 128, 277
- (26) Navascués D.B.Y., Martín E.L. 2003, AJ 126, 2997
- (27) Okabayashi, 1936, AN 261, 65
- (28) Parenago, P.P. 1949, PZ 7, 109
- (29) Payne–Gaposchkin, C. 1957, The galactic novae, Amsterdam: North–Holland Publ. Co., p. 12
- (30) Prialnik, D., Shara, M.M. 1986, ApJ 311, 172
- (31) Retter, A., Lipkin, Y. 2001, A&A 365, 508
- (32) Retter, A., Leibowitz, E.M., Kovo–Kariti, O. 1998, MNRAS 293, 145
- (33) Ringwald, F.A., Naylor, T., Mukai, K. 1996, MNRAS 281, 192
- (34) Ritter, H., Kolb, U. 1998, A&AS 129, 83
- (35) Robertson, J.W., Honeycutt, R.K., Hillwig, T., Jurcevic, J.S., Henden, A.A. 2000, AJ 119, 1365
- (36) Robinson, E. L. 1975, AJ 80, 515
- (37) Rosenbusch, A.E., 1999, Ap. 42, 43
- (38) Schwassmann, A., Wachmann, A.A. 1928, AN 232, 273
- (39) Sekiguchi K., Feast M.W., Fairall A.P., Winkler H. 1989, MNRAS 241, 311
- (40) Shafter, A.W. 1997, ApJ 487, 226
- (41) Shara, M.M., Livio, M., Moffat, A.F.J., Orio, M. 1986, ApJ 311, 163
- (42) Smith, C.H., Aitken, D.K., Roche, P.F. 1994, MNRAS 267, 225
- (43) Stehle, R., Ritter, H., Kolb, U. 1996, MNRAS 279, 581
- (44) Stehle, R., Kolb, U., Ritter, H. 1997, A&A 320, 136
- (45) Townsley, D.M., Bildsten, L. 2004, ApJ, 600, 390
- (46) Warner, B. 1987, MNRAS 227, 23
- (47) Warner, B. 1995, Cataclysmic Variable Stars, Cambridge University Press
- (48) Whitelock, P. 1987, MNSSA 46, 72
- (49) Wichmann, R., Krautter, J., Kawara, K., Williams, R.E. 1990, AGAb 5, 17
- (50) Williams, G.A. 1991, AJ 101, 1929
- (51) Woudt, P.A., Warner, B., 2001, MNRAS 328, 159
- (52) Woudt, P.A., Warner, B., 2003, MNRAS 340, 1011