Photometric and spectroscopic study of low mass embedded star clusters in reflection nebulae††thanks: Based on observations made at Complejo Astronómico El Leoncito, which is operated under agreement between the Consejo Nacional de Investigaciones Científicas y Técnicas de la República Argentina and the National Universities of La Plata, Córdoba and San Juan, Argentina.
An analysis of the candidate embedded stellar systems in the reflection nebulae vdBH-RN 26, vdBH-RN 38, vdBH-RN 53a, GGD 20, ESO 95-RN 18 and NGC 6595 is presented. Optical spectroscopic data from CASLEO (Argentina) in conjunction with near infrared photometry from the 2MASS Point Source Catalogue were employed. The analysis is based on source surface density, colour-colour and colour-magnitude diagrams together with theoretical pre-main sequence isochrones. We take into account the field population affecting the analysis by carrying out a statistical subtraction. The fundamental parameters for the stellar systems were derived. The resulting ages are in the range 1-4 Myr and the objects are dominated by pre-main sequence stars. The observed masses locked in the clusters are less than 25. The studied systems have no stars of spectral types earlier than B, indicating that star clusters do not necessarily evolve through an HII region phase. The relatively small locked mass combined with the fact that they are not numerous in catalogues suggests that these low mass clusters are not important donors of stars to the field populations.
Key Words.:
Galaxy: open clusters and associations: individual: GGD 20 – vdBH-RN 26 – vdBH-RN 38 – vdBH-RN 53a – ESO 95-RN 18 – NGC 65951 Introduction
The sensitivity increase of infrared detectors has provided insight into the understanding of early evolutionary stages of stars and stellar clusters. Molecular clouds have revealed a surprisingly large number of embedded star clusters, indicating that a significant fraction, if not the vast majority of all stars, may form in such systems (Lada & Lada 2003).
Embedded clusters emerge from molecular clouds owing to the disruptive action of newly born stars, including the less massive ones (Matzner & McKee 2000). This process limits the efficiency of star formation from gas, decreasing gravitational energy and resulting in a large mortality rate for embedded clusters (EC). Approximately 95% of the embedded clusters emerge from molecular clouds as unbound objects and the systems that evolve to stable open clusters have masses (Kroupa & Boily 2002).
Recent surveys of infrared star clusters and stellar groups are based on directions of optical and radio HII regions (e.g. Dutra et al. 2003) or Herbig AeBe stars (e.g. Testi et al. 1998). Dutra et al. (2003) and Bica et al. (2003b), who investigated more than 3000 optical and radio nebulae with 2MASS (Skrutskie et al. 1997), found 346 new embedded star clusters, stellar groups and candidates. All together, these surveys provide a large sample for detailed studies.
The main goals of the present work are to further study young star clusters or groups related to reflection nebulae, and extract their physical parameters by means of a series of tools, such as density profiles, colour-colour and colour-magnitude diagrams. We intend to provide insight to the understanding of their evolution as compared to those of clusters with massive stars producing HII regions. A closeby similar object is the sparse young cluster in the reflection nebula NGC 5367 (Williams et al. 1977). It is important to explore other objects of this type and they are not necessarily closeby. Testi et al. (1998) found sources around Herbig AeBe stars, part of them related to reflection nebulae. Soares & Bica (2002, 2003) studied four low mass star clusters in the CMaR1 molecular cloud, three of them related to optical reflection nebulae.
For a broader view we analyse in the present study some candidates to clusters in reflection nebulae. Most of the clusters and stellar groups in Bica et al. (2003b) and Dutra et al. (2003) are massive ones related to optical and radio HII regions and their molecular clouds. The subsample of star clusters and groups in those studies related to optical reflection nebulae is small, which makes them interesting to explore.
The reflection nebulae vdBH-RN 26, vdBH-RN 38 and vdBH-RN 53a were catalogued by van den Bergh & Herbst (1975), ESO 95-RN 18 by Lauberts (1982) and GGD 20 by Gyulbudaghian et al. (1978). The latter object is equivalent to BBW 311 (Brand et al. 1986). Van den Bergh & Herbst (1975) provided a distance from the Sun d⊙ kpc for vdBH-RN 26. Herbst (1975) reported for vdBH-RN 38, the core of the nebula ESO 128EN 4, d⊙ kpc from UBV photometry of the central star, but no spectroscopy was available. Brand & Blitz (1993) obtained for the nebula BBW 311 d⊙ kpc. vdBH-RN 53a is equivalent to ESO 94?6 and BBW 371A, with . Two other small nebulae are in the area. Herbst (1975) obtained for vdBH-RN 53a d⊙ kpc. Brand & Blitz (1993) found for the general direction of the small nebulae in the area d⊙ kpc.
Clusters or stellar groups embedded in the nebulae vdBH-RN 38 and vdBH-RN 53a have been identified as objects 53 and 72, respectively, by Dutra et al. (2003), while the clusters related to GGD 20 and ESO 95-RN 18 are given for the first time in this work. The cluster related to NGC 6595 was reported in Bica et al. (2003a), while that related to vdBH-RN 26 was given in Dutra & Bica (2001).
In the present study, we analyse the stellar content of reflection nebulae by means of the radial distribution of surface density of sources (main sequence stars – MS, pre-main sequence stars – PMS), colour-colour and colour magnitude diagrams (CMDs). We investigate the nature of these objects by analysing their physical parameters.
The cluster equatorial and galactic coordinates are shown in Table 1. The centers are optimized peak values from the structural analysis (Sect. 3).
In Sect. 2 we describe the spectroscopic observations and photometric data. In Sect. 3 we present the methods and in Sect. 4 we provide the photometric results for the most populous stellar systems. Finally, Sect. 5 provides the concluding remarks of this work.
2 Spectroscopic and photometric data
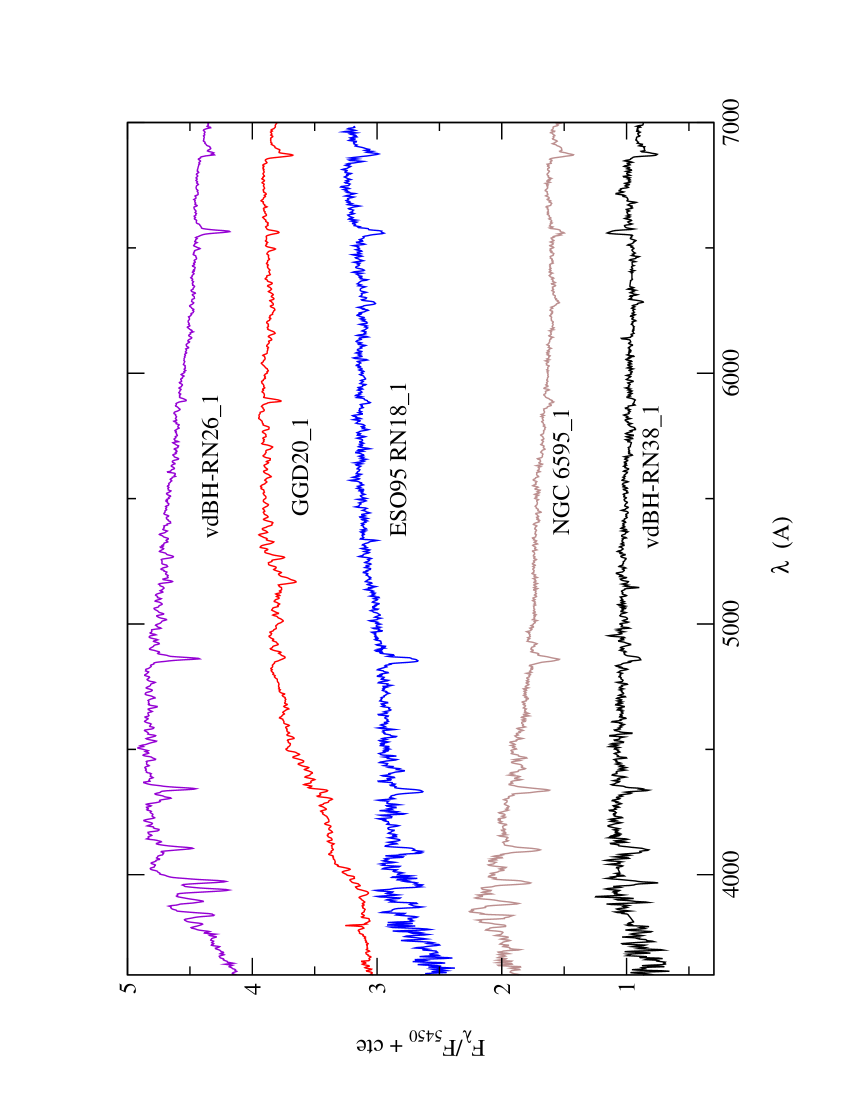
The spectroscopic observations were carried out at Complejo Astronómico El Leoncito (CASLEO, Argentina) during three nights in May 2002, with the 2.15m telescope. We employed a REOSC spectrograph containing a Tektronics CCD of 1024x1024 pixels, with pixel size 24x24 m. The total field along the slit was , with the slit oriented in the east-west direction. We obtained spectra ranging from 3500 Å to 7010 Å, using a grating of 300 lines/mm. The average dispersion was 140 Å/mm. In general, 3 exposures of 20 minutes for each object were taken. Standard stars – namely, LTT 7379, LTT 3864 and CD 32 (Stone & Baldwin 1983) – were used for calibration of the observed spectra. For instrumental calibration purposes, frames of Cu-Ar-Ne comparison lamps were taken between and after the object observations, as well as bias, dome, twilight sky and tungsten lamp flat-fields. The spectra were reduced at the UFRGS Astronomy Department (Brazil) using the IRAF package. The description of reduction procedures is given in Piatti et al. (2000). Fig. 1 shows the observed spectrum of the brightest star in three of the clusters. The stars NGC 6595_1, vdBH-RN 38_1 and ESO 95-RN 18_1 are reddened early-type stars appearing to be related to the nebulae. The stars GGD20_1 and vdBH-RN 26_1, located on the periphery of the objects, appear to be unreddened late-type field stars.
As photometry, we employed the Gator tool for Point Source Catalogue extractions, as given in the Two Micron All Sky Survey (2MASS) site (http://www.ipac.caltech.edu/2mass/). An extraction table gives for each star the J, H and magnitudes, the three corresponding colours (, and ), the respective errors and J2000.0 coordinates. The 2MASS photometric errors in the present regions for each magnitude are basically the same as those presented in Soares & Bica (2002) for the regions of NGC 2327 and BRC 27. The errors become important (0.1 mag and larger) for magnitudes fainter than . For comparison purposes we made extractions up to the radius r = 5′ around the object center.
| Cluster | (J2000) | (J2000) | l() | b() |
|---|---|---|---|---|
| vdBH-RN 26 | 08h58m04s | -47∘22′54″ | 267.72 | -1.10 |
| vdBH-RN 38 | 10h32m41s | -61∘37′28″ | 287.21 | -3.06 |
| vdBH-RN 53a | 11h45m57s | -65∘33′34″ | 296.22 | -3.54 |
| GGD 20 | 7h24m41s | -24∘34′42″ | 238.47 | 4.16 |
| ESO 95-RN 18 | 12h51m22s | -63∘18′18″ | 302.92 | -0.43 |
| NGC 6595 | 18h17m06s | -19∘51′52″ | 11.42 | -1.71 |
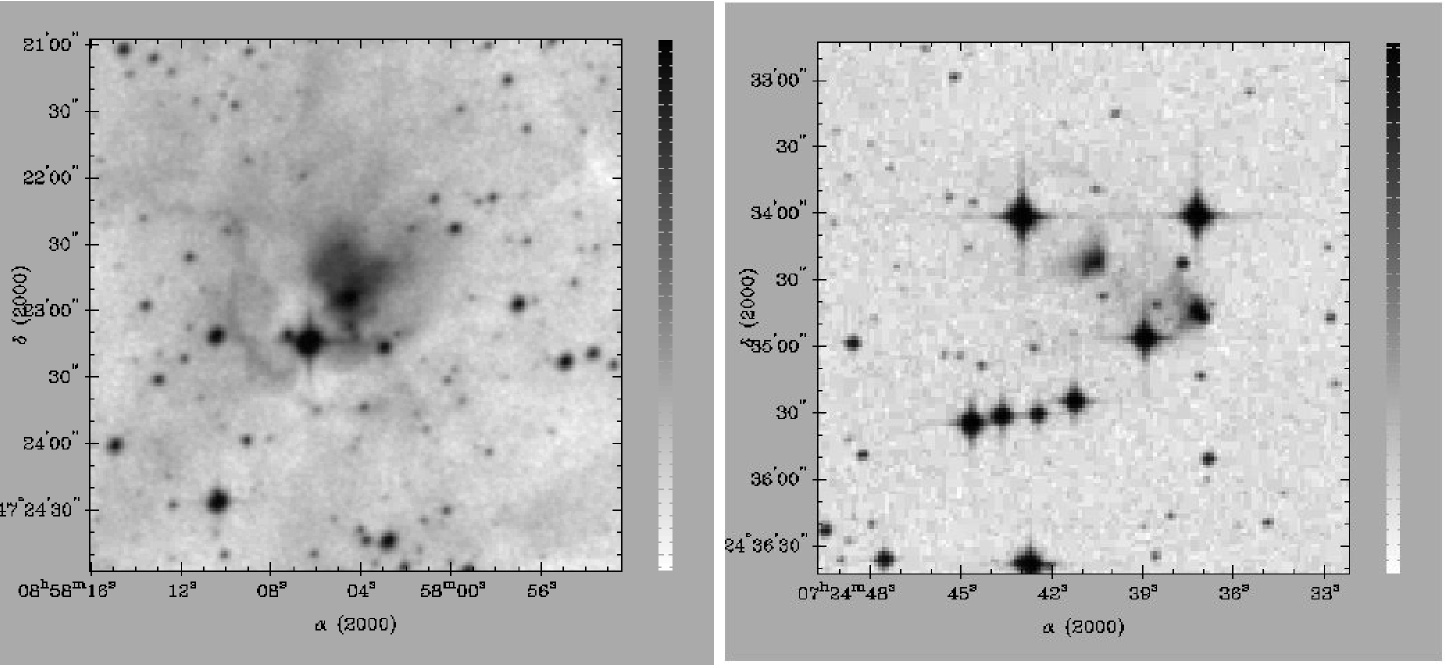
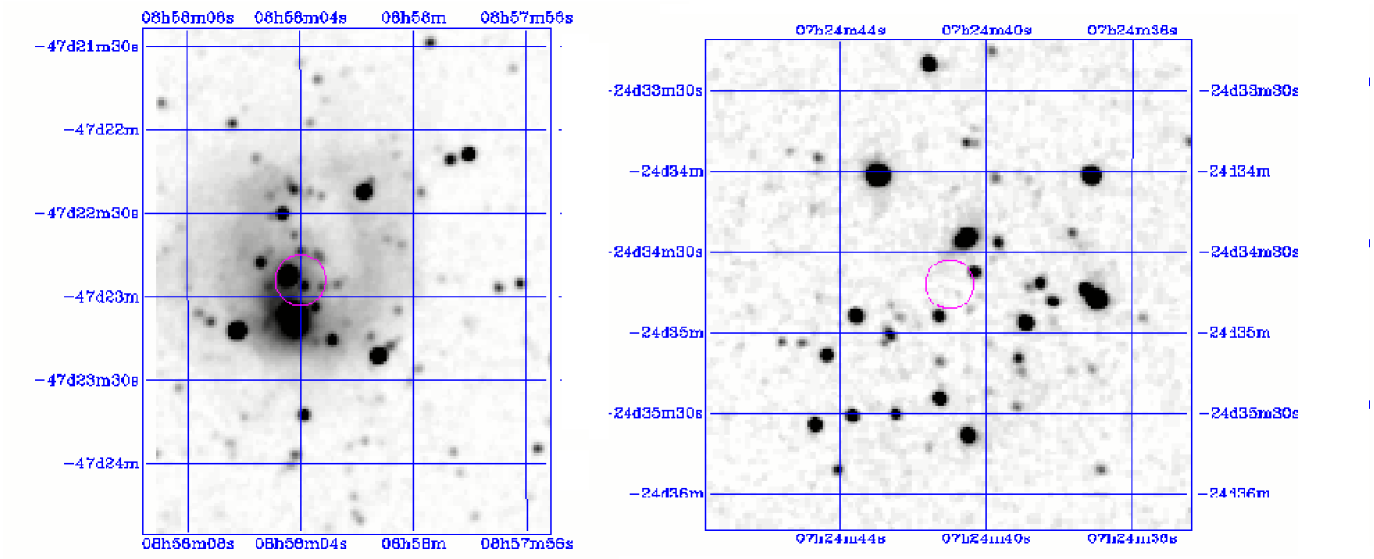
We show optical and IR images for two of the analysed objects (vdBH-RN 26 and GGD 20) to illustrate a cluster or stellar group associated with a reflection nebula. The infrared band Digitized Sky Survey images (http://cadcwww.dao.nrc.ca/cadcbin/getdss) of vdBH-RN 26 and GGD 20 are given in Fig. 2. The reflection nebulae are shown in the central parts of these optical images. Fig. 3 shows the band 2MASS images of the same objects.
3 Methods of analysis
3.1 Spectroscopy
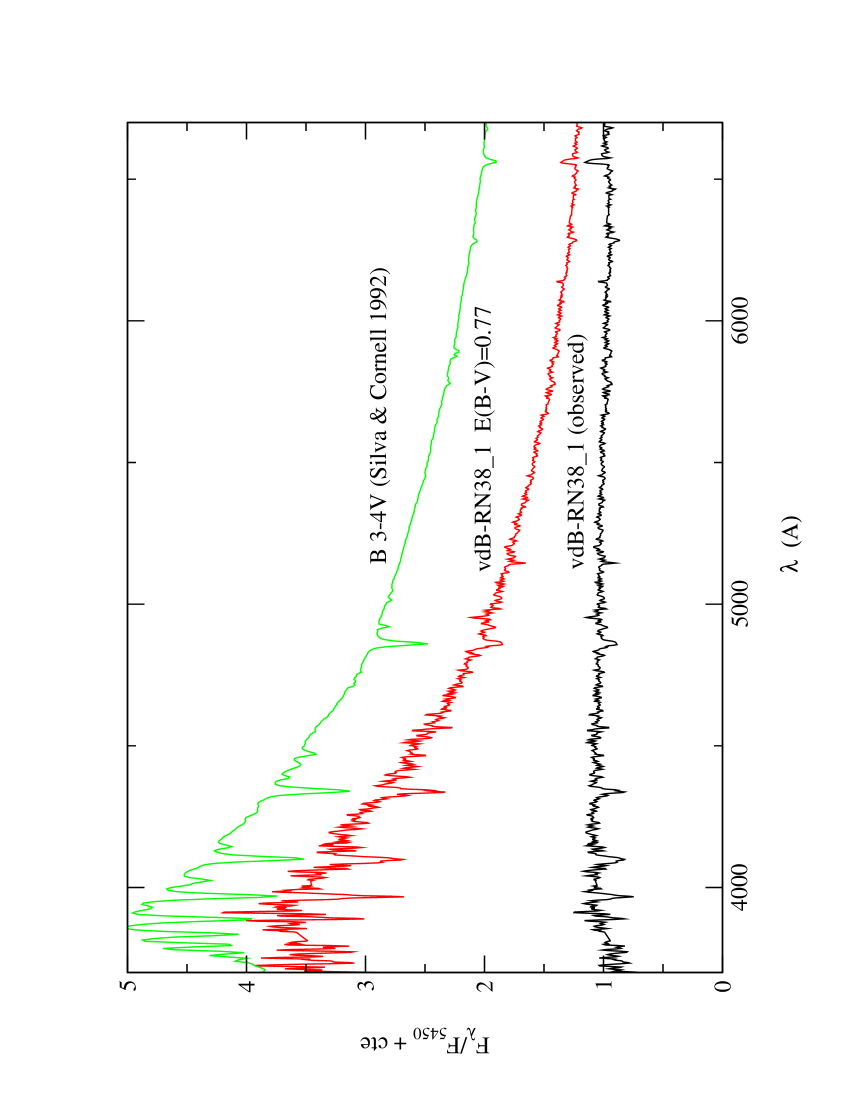
Spectroscopic data were obtained for the brightest star in each object, except for vdBH-RN 53a. In Fig. 4 we show the observed spectrum of the vdBH-RN 38 for the sake of illustrating the analysis method. We obtained spectral types for the brightest star in each object by means of equivalent widths of Balmer lines and comparisons with those of stars in the library of Silva & Cornell (1992). This method is the same as that employed by Ahumada et al. (2001). From these comparisons we also derived reddening values (Fig. 4). Table 2 shows the coordinates of the observed stars, the resulting extinction values and the spectral types. The resulting extinction of the member stars are considerable for the optical range, but not for the near infrared. The brightest source in NGC 6595, vdBH-RN 38 and ESO 95-RN 18 is a B3-4 star, indicating the absence of high mass stars in the cluster. This does not produce significant ionization, in agreement with the occurrence of a reflection nebula. The bright star GGD 20_1 and vdBH-RN 26_1 proved to be foreground K4 and F6-7 stars, respectively. In the case of vdBH-RN 38_1 a weak emission line is present (Fig. 1), but it is not clear whether it is circumstellar or nebular. In the CMD analyses, we use the information on spectral types as constraints for distances and, when available, other fit parameters. Otherwise, we will use luminosity and mass constraints, aware of the fact that we are dealing with reflection nebulae.
| Brightest star | (J2000) | (J2000) | ST | |
|---|---|---|---|---|
| vdBH-RN 26_1 | 08h58m06s | -47∘23′12.1″ | 0.2 | F6-7 |
| vdBH-RN 38_1 | 10h32m40.8s | -61∘37′27.1″ | 2.4 | B3-4 |
| GGD 20_1 | 7h24m42.9s | -24∘34′01.2″ | 0.3 | K4 |
| ESO 95-RN 18_1 | 12h51m21.7s | -63∘18′11.5″ | 3.4 | B3-4 |
| NGC 6595_1 | 18h17m05.7s | -19∘51′52.5″ | 1.8 | B3-4 |
3.2 Structure
We extracted stars within 5′ of the assumed center of each object (Table 1), using 2MASS. By dividing this area into concentric rings 0.2′ wide, we calculated the number of stars confined in each ring per unit area. Fig. 5 displays the relation between source surface density and angular radial distance for the four clusters. The indicated bars are Poissonian errors. The dashed line indicates the mean star field density which is obtained by the stars contained in the 10 outermost rings.
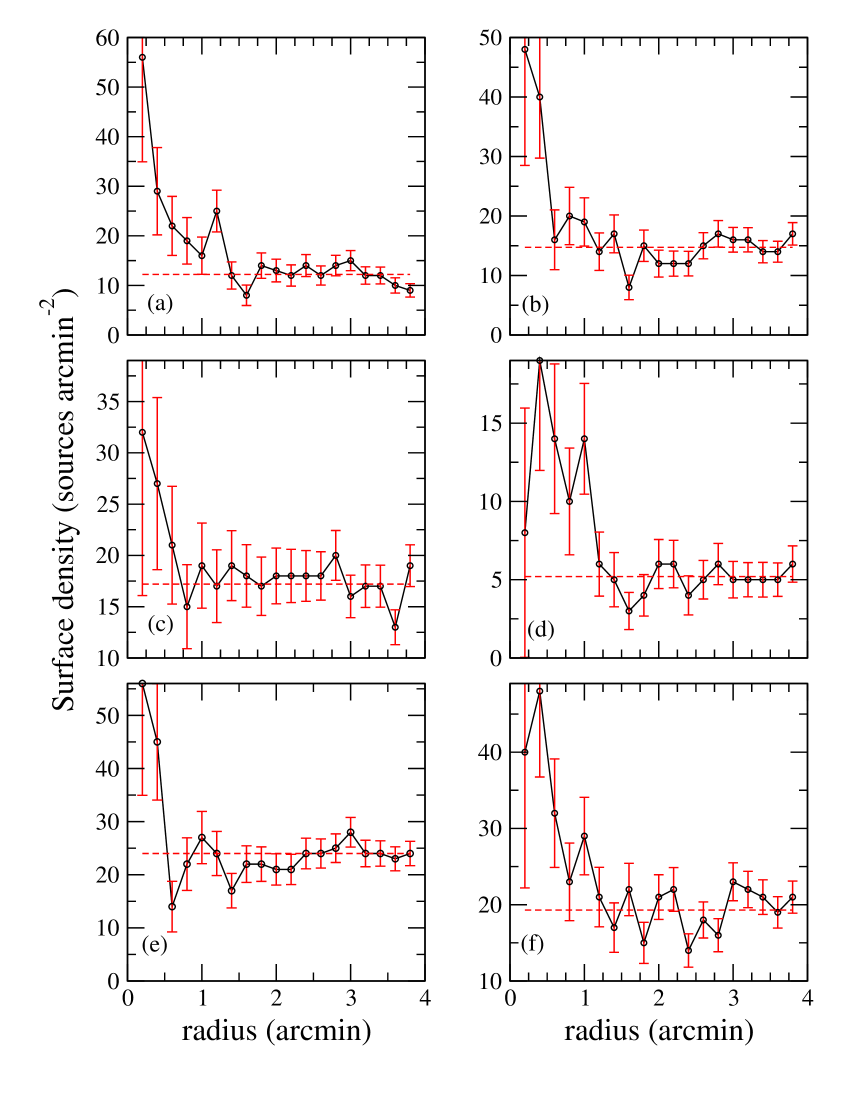
In Fig. 5 we note important source surface density contrasts for the objects as compared to the background. The densities decrease below the mean field values for radii just outside the assumed object radius. This can be an indication of an underestimation of the number of stars contained in the cluster due to dust absorption from the reflection nebula. We verified that the profiles cannot be fitted by King’s law, certainly as a result of the early evolutionary stage of the systems.
A richness indicator index which subtracts the foreground/background contamination was utilized (Testi et al. 1998). In Table 3, we show the index for the present clusters. Those clusters in the nebulae vdBH-RN 26, vdBH-RN 38, GGD 20 and NGC 6595 have clustering values comparable to those of the richer objects analysed by Testi et al. (1998).
| Cluster | Ica | b | d (kpc)c | r()d | r(pc)e | t(Myr)f | t(Myr)g | (Myr)h |
|---|---|---|---|---|---|---|---|---|
| vdBH-RN 26 | 44 | 1.7 | 1.4 | 0.7 | 1-2 | |||
| vdBH-RN 38 | 22 | 1.2 | 1.0 | 0.35 | ||||
| vdBH-RN 53a | 6 | - | 1.7 | 0.7 | 0.35 | - | - | |
| GGD 20 | 24 | 1.3 | 1.0 | 0.45 | 2-3 | |||
| ESO 95-RN 18 | 10 | - | 1.6 | 0.5 | 0.2 | - | - | |
| NGC 6595 | 22 | 0.6 | 1.0 | 0.2 |
-
aclustering index (Sect. 3); b mean absorption; cdistance from the Sun; dangular radius; elinear radius;
fage obtained by means of the IR excess method; g,hmean age and dispersion obtained by means of the PMS isochrone method.
3.3 Colour-colour diagram
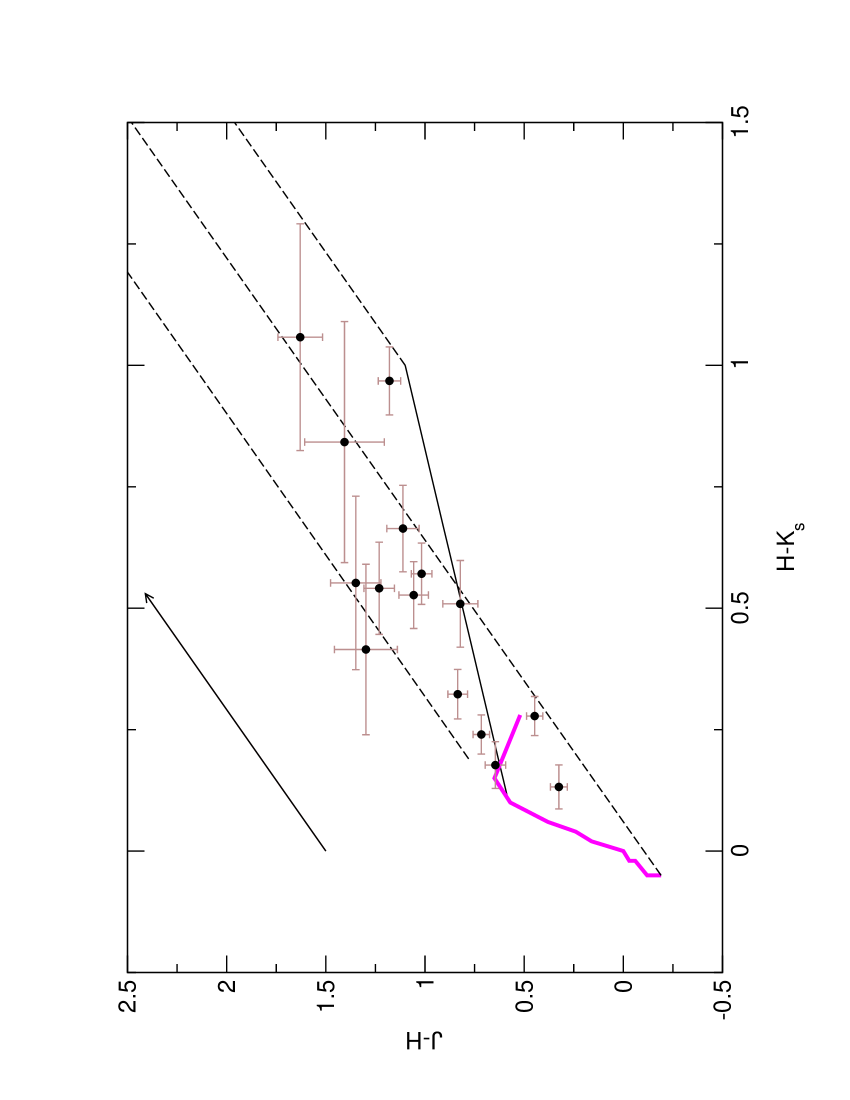
Stars at formation stages (T Tauri and Herbig AeBe) can exhibit anomalous colours due to the band excesses created by hot dust emission around them (Carpenter et al. 1993; Lada & Adams 1992; Calvet et al. 1992), an effect which is observed in the diagram. By means of the percentage of anomalous stars, one can estimate the cluster or stellar group age (Lada et al. 1996, Soares & Bica 2003). This diagram also provides the mean reddening of the object.
Fig. 7 displays a diagram, which shows intrinsic colours of MS stars from O3 to M5 (Binney & Merrifield 1998 – and references therein), together with reddening lines of (Schlegel et al. 1998) for an O3 MS star and an M5 giant, as well as the locus of unreddened T Tauri stars (Meyer et al. 1997).
Extinction is estimated from the observed colours in the diagram. The intrinsic colours of the embedded stars should be known. We consider the following cases: (i) the domain of normal reddening containing weak T Tauri stars, background/foreground stars and highly reddened luminous early-type PMS stars (Strom et al. 1995); (ii) the domain of classical and band excesses, from the reddening line of O3 stars to the reddening line of the reddest colour reached by standard disk models. This domain contains classical T Tauri stars; (iii) the domain of objects with larger and band excesses located to the right of the reddest colour predicted for a standard disk model (Lada & Adams 1992). Stars contained in this domain are probably surrounded by extended envelopes (Kenyon et al. 1993) or heavily reddened Herbig AeBe stars with central holes in their disks (Lada & Adams 1992; Hillenbrand et al. 1992).
The stars contained in domain (iii) were not dereddened because their intrinsic colours are not straightforwardly obtained, as a consequence of a wide range of colours produced by their surrounding envelopes (Strom et al. 1995). Extinction was obtained only for stars located in domains (i) and (ii), using reddening vectors and intrinsic colours.
3.4 Subtraction method of field stars
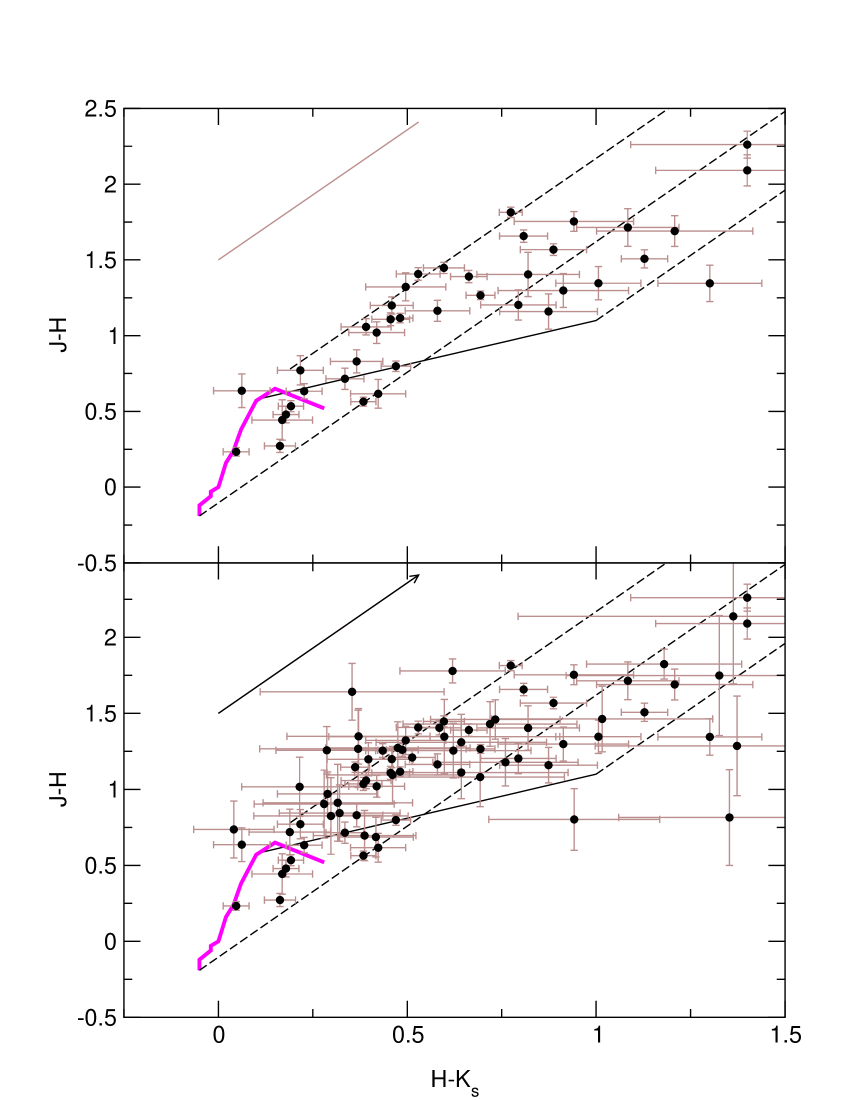
The field stars were removed from the colour-colour and colour-magnitude diagrams based on an analysis of the colour-colour diagram. Comparisons of the distribution of stars on the latter diagram for on-cluster and off-cluster stars are the essence of the statistical field subtraction method applied. The off-cluster and on-cluster regions are concentric. The off-cluster region corresponds to . The method is similar to that presented in Kerber et al. (2002) for CMDs of a Magellanic Cloud cluster. It is based on the hypothesis that positions of off-cluster stars represent the most likely positions for field stars on similar colour-colour diagram of the surroundings. We estimate the probability of each on-cluster star being a cluster member, by the numbers of stars of the on-cluster and the off-cluster contained in a box centered in it.
The probability that the th on-cluster star is any of the member stars is:
,
where and are the solid angles of the respective regions.
The sum of over the th on-cluster star is , the number of cluster member stars pointed out by the method.
According to this probability we randomly remove stars from the on-cluster colour-colour diagram. In Fig. 6 we have a comparison of an observed and a field subtracted colour-colour diagram.
3.5 Colour magnitude diagram
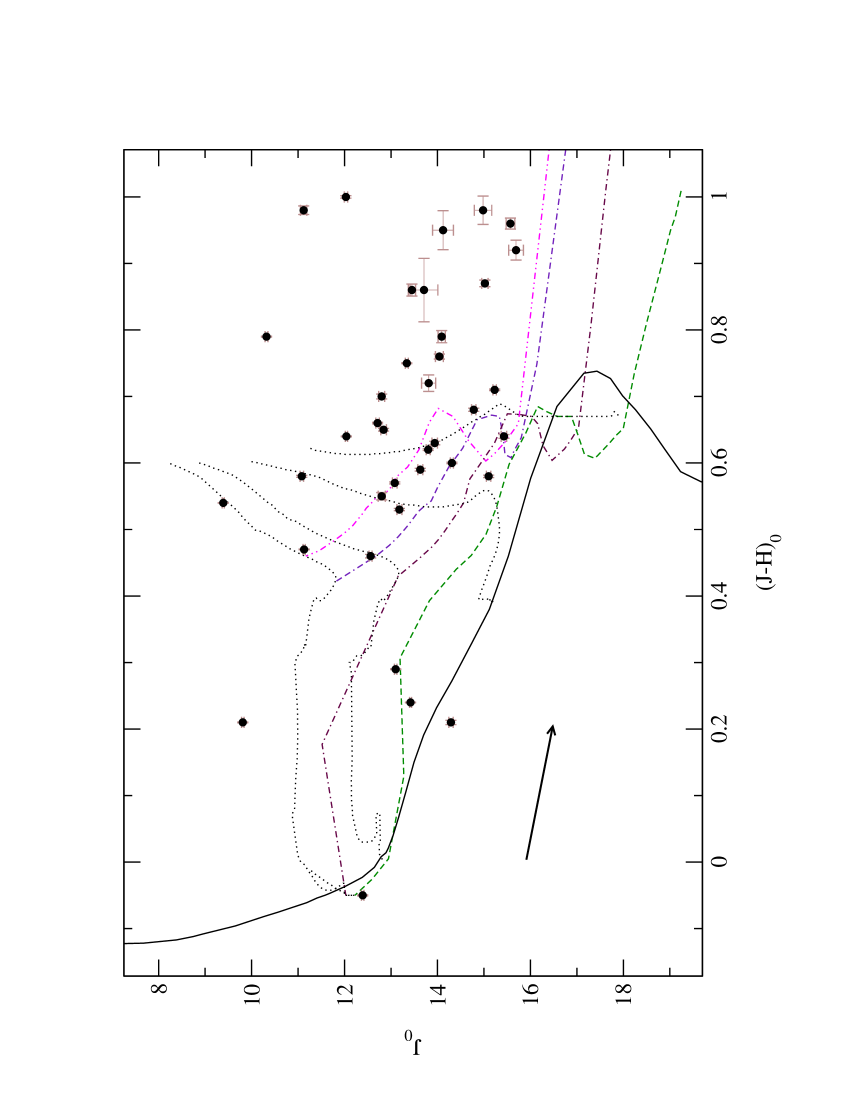
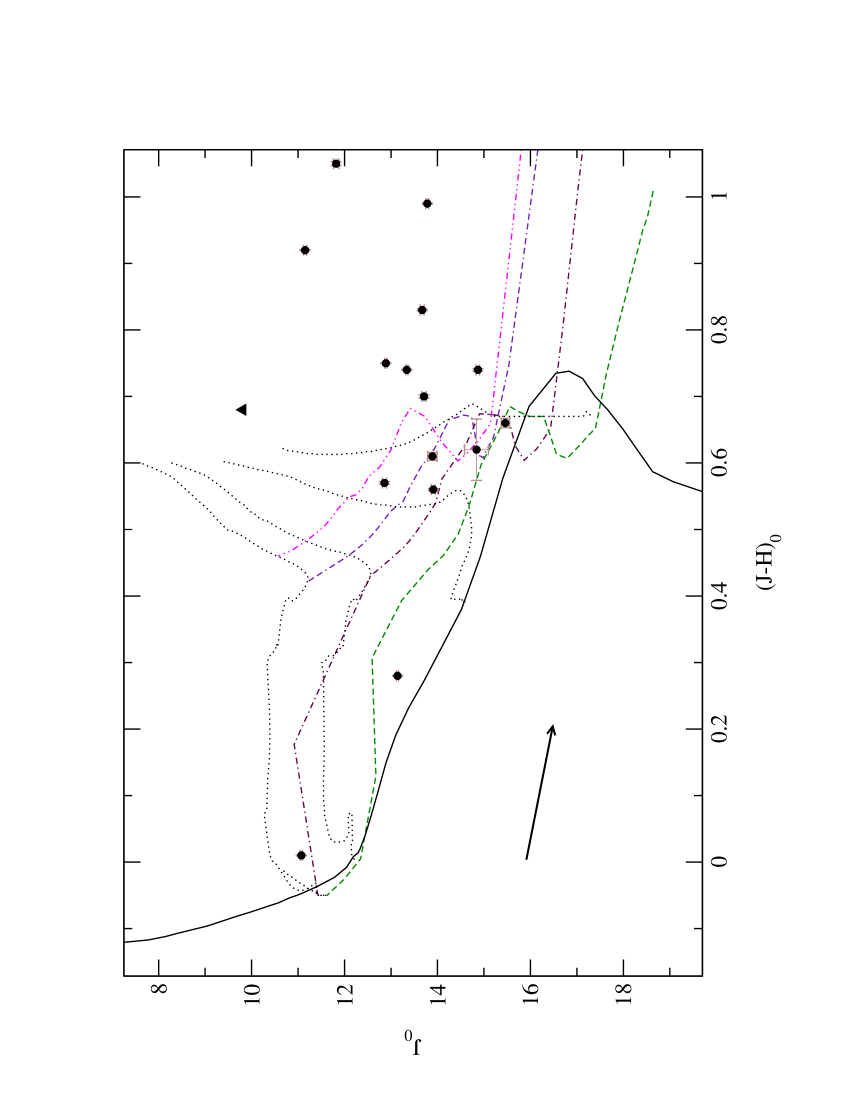
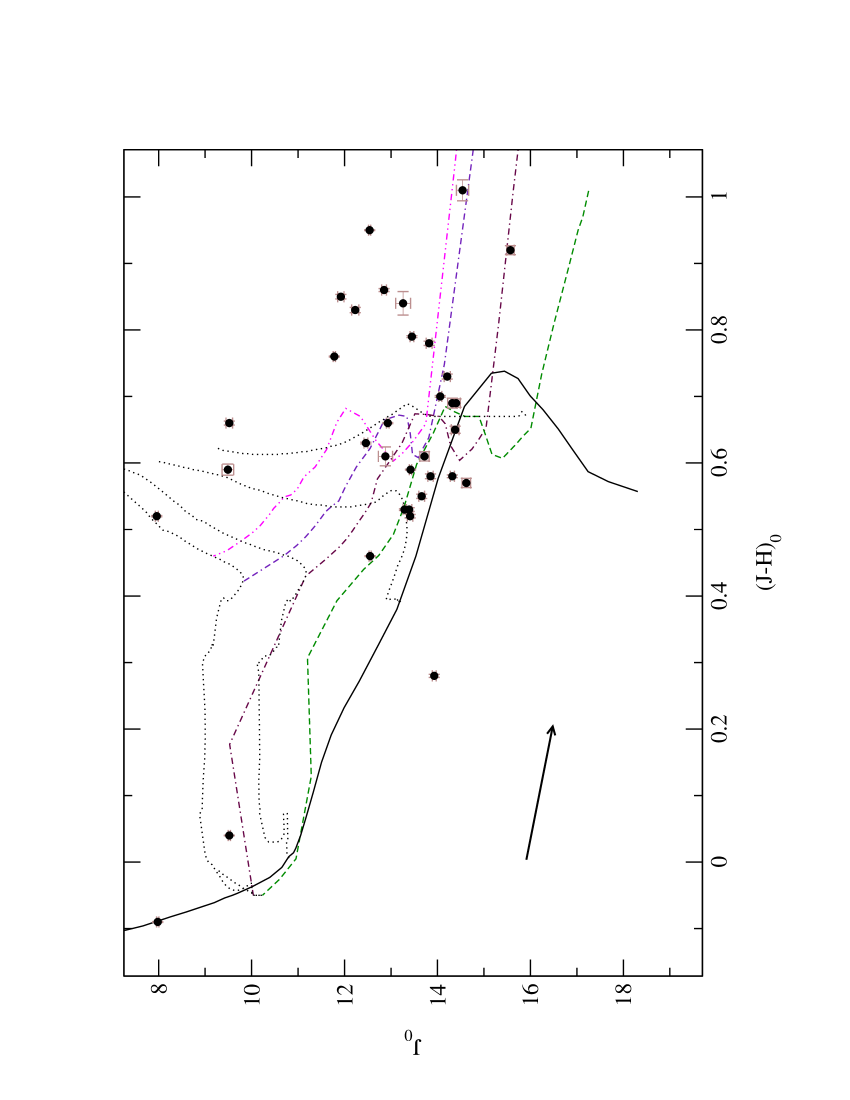
We analysed the CMDs by means of PMS evolutionary tracks and isochrones of D’Antona & Mazzitelli (1997, 1998). The evolutionary tracks are from 0.07 Myr to 100 Myr for PMS stars in the range of 0.17 M⊙ to 3 M⊙. The deuterium abundance adopted is and metallicity is . We converted the theoretical into observational plan by using the bolometric corrections of Schmidt-Kaler (1982). The 0.3, 1, 3 and 10 Myr isochrones, together with a zero age main sequence (Bertelli et al. 1994) and evolutionary tracks for 3, 2, 1 and 0.5 M⊙, are shown in Fig. 8.
In the CMD analysis it is fundamental to decontaminate it for field stars. The member stars obtained in Sect. 3.4 for each cluster were used in the present analysis. The clusters in the nebulae vdBH-RN 26, vdBH-RN 38, GGD 20 and NGC 6595 have good statistics and their analysis is given in Sect. 4. vdBH-RN 53a and ESO 95-RN 18 showed too few stars and will not be further discussed. However the density profiles (Sect.3.2) suggest that they are stellar systems. Thus, we strongly recommend observation with larger telescopes.
We estimated the observed mass of the clusters from the dereddened CMDs, using the evolutionary tracks. The observed cluster masses proved to be smaller than for each cluster. This value can be considered an underestimation of the total mass, owing to the photometric cutoff and to the presence of dust in the objects.
As a second method, the object ages were estimated by using the PMS isochrones. An age fitting was applied to each member star in the CMD, previously corrected for absorption (Sect. 3.3), then we derived ages and age dispersions for the clusters.
The age and dispersion errors were obtained from the values found for twenty realizations of the statistical subtraction.
Table 3 gives the age t obtained by means of the PMS isochrone method for each cluster and the respective dispersion . For PMS stars above the 0.3 Myr isochrone, we adopted this lower limit age. Some field contamination can be present in the cluster CMDs, despite their low membership probability. Some of these stars with resulting ages older than 10 Myr were not included in the mean value calculations. The age dispersions are non-negligible and compatible with expected dispersions for the cluster formation stage. For comparison purposes, the ages t obtained by means of the band excess method (Sect. 3.3) are also shown. In general, a good agreement occurs.
4 Discussion of the individual clusters
4.1 The cluster in the nebula vdBH-RN 26
The source surface density distribution for the vdBH-RN 26 cluster shows an excess up to r = 1.4′ (Fig. 5). We adopted this radius for the object.
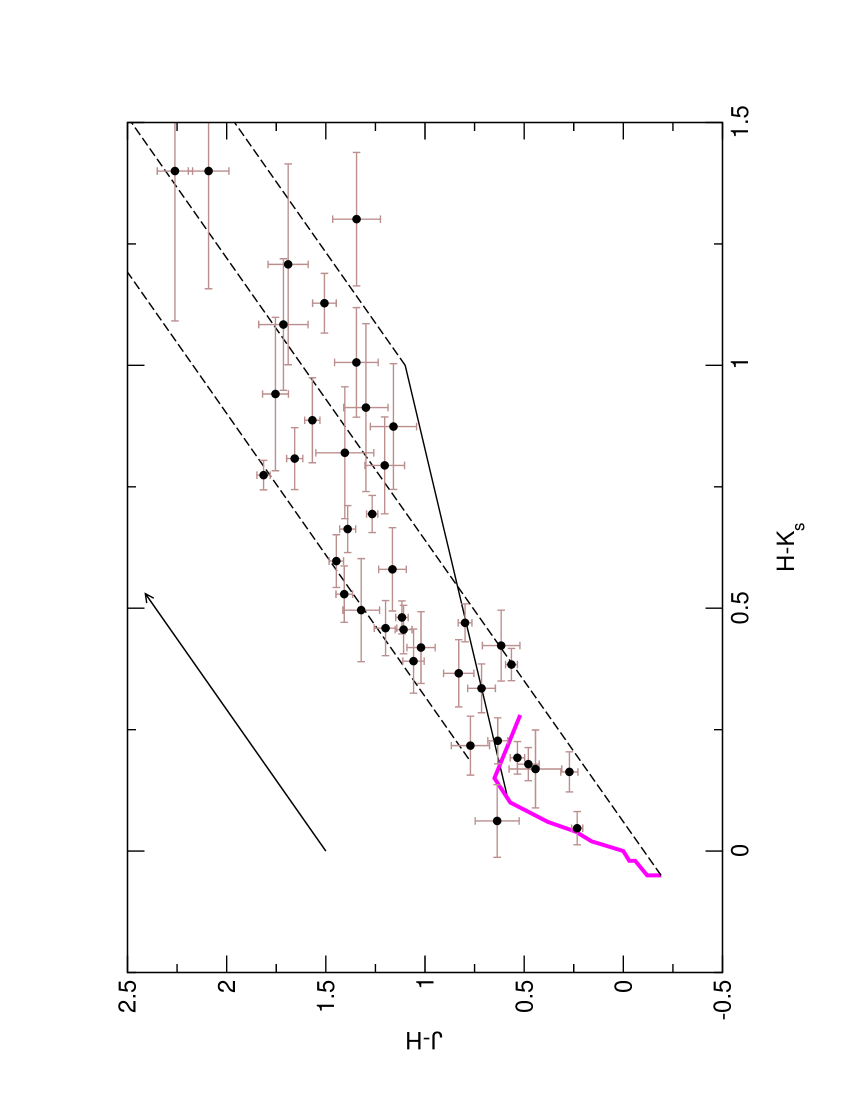
Fig. 7 shows, as an example, one of the colour-colour diagrams obtained from the several realizations of the field subtraction statistical method. The diagram presents a large number of stars outside the first domain (Sect 3.2). Considering the number of stars predicted for the cluster, nearly 40% of them have IR excess, such as in the case of the YSOs in the Taurus dark clouds, which have an estimated age of about 1-2 Myr (Kenyon & Hartmann 1995). The mean age obtained by means of the PMS isochrone is Myr, which is adopted and the age dispersion is Myr. The mean reddening is considering the stars in the domain where intrinsic colours are known. This reddening value corresponds to . The relations and , used in reddening transformations, were derived from the data in Schlegel et al. (1998), assuming (Cardelli et al. 1989). A CMD obtained for vdBH-RN 26 as a realization of a statistical subtraction is shown in Fig. 8. The best fit of PMS tracks to the corresponding observed objects is given.
We obtained a distance of d⊙ kpc (Sect. 1) for the object, in agreement with van den Bergh & Herbst (1975).
The second brightest star is an F6-7 foreground star (Table 2). The star with a similar colour located below the ZAMS is probably also a field star. One has to keep in mind that the method does not eliminate all field stars in a given realization. However, the effects of such low probability stars will be small on the mean values of the studied parameters.
It is worth noting that the low mass stars have been formed in the cluster without the presence of a massive star.
4.2 The cluster in the nebula vdBH-RN 38
There occurs an excess of star surface density up to as compared to the surrounding field (Fig. 5). We adopt a limiting radius r = 1′ for the subsequent analysis.
The mean reddening is , which corresponds to . vdBH-RN 38 is not heavily reddened as compared to massive embedded clusters (Lada & Lada 2003). The photometric value is somewhat larger than that obtained spectroscopically for the brightest star (Table 2). This suggests that the dust column in the direction of the brightest star is smaller than those of the PMS stars on average, possibly due to stellar winds. Some stars have IR colours denoting infrared excess. The vdBH-RN 38 cluster has about of PMS stars with infrared excess, which suggests an evolutionary stage similar to that of IC 348 cluster which has 2-3 Myr (Haisch et al. 2001). The value obtained by means of the PMS isochrones for the mean age was Myr, in agreement with the value obtained with the previous method. The age dispersion found was Myr. The estimate of the observed mass is less than .
The CMD (Fig. 10) includes the PMS isochrones and evolutionary tracks. The fit was based on the cluster colour-colour diagram and on the most luminous star, which is a B3-4 spectral type star (Sect. 3.1). The observed distance modulus is , implying a distance from the Sun of d⊙ kpc. This value is a factor of 2 smaller than previous estimates for the nebula (Sect. 1). This solution is constrained in terms of the intermediate mass star and of PMS objects.

4.3 The cluster in the nebula GGD 20
In contrast to the previous objects, GGD 20 presents a comparatively lower source surface density. In Fig. 5 the surface density is considerably larger than that of the surrounding field up to , which we adopted for extractions.
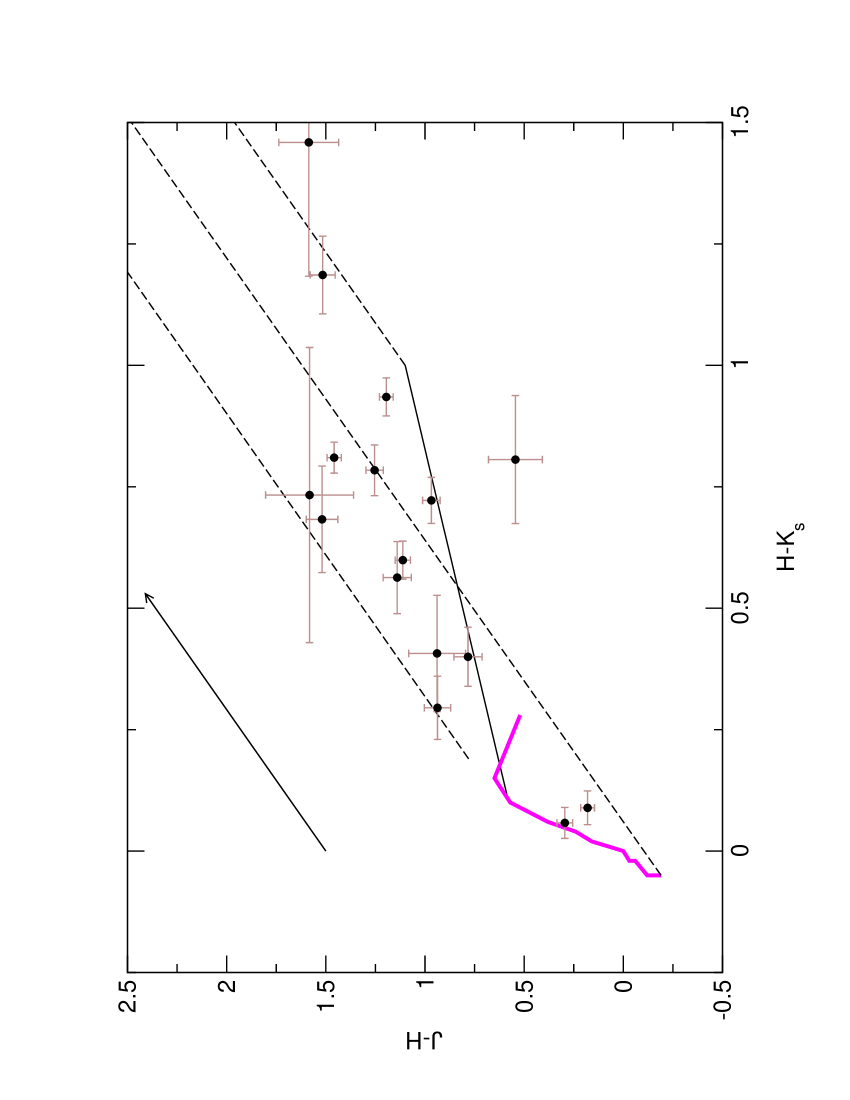
The ( diagram (Fig. 11) shows of the stars with band excess, implying a similar evolutionary stage to that of the IC 348 cluster. The PMS isochrone method gives an mean age of Myr and a age dispersion of Myr. The mean reddening is considering the stars with predictable intrinsic colours. This reddening value corresponds to .
In Fig. 12 we show the diagram for the cluster, together with the PMS isochrones fit. The brightest star in the cluster direction resulted to be a K4 star (Sect. 3) and was discarded by the field star subtraction. The observed distance modulus is and the distance is d⊙ kpc. The triangle in Fig. 12 represents the Herbig AeBe star described in Vieira et al. (2003). The most massive star near the ZAMS probably has 2M⊙ and spectral type A5. Intermediate brightness stars redder than appear to be classical T Tauri stars with IR emission from surrounding disks. The star distribution along the CMD points to a mean age compatible to that obtained by means of the band excess method.
4.4 The cluster in the nebula NGC 6595
The source surface density (Fig. 5) shows a large concentration of stars within . The angular radius assumed in the analysis for the NGC 6595 cluster is .
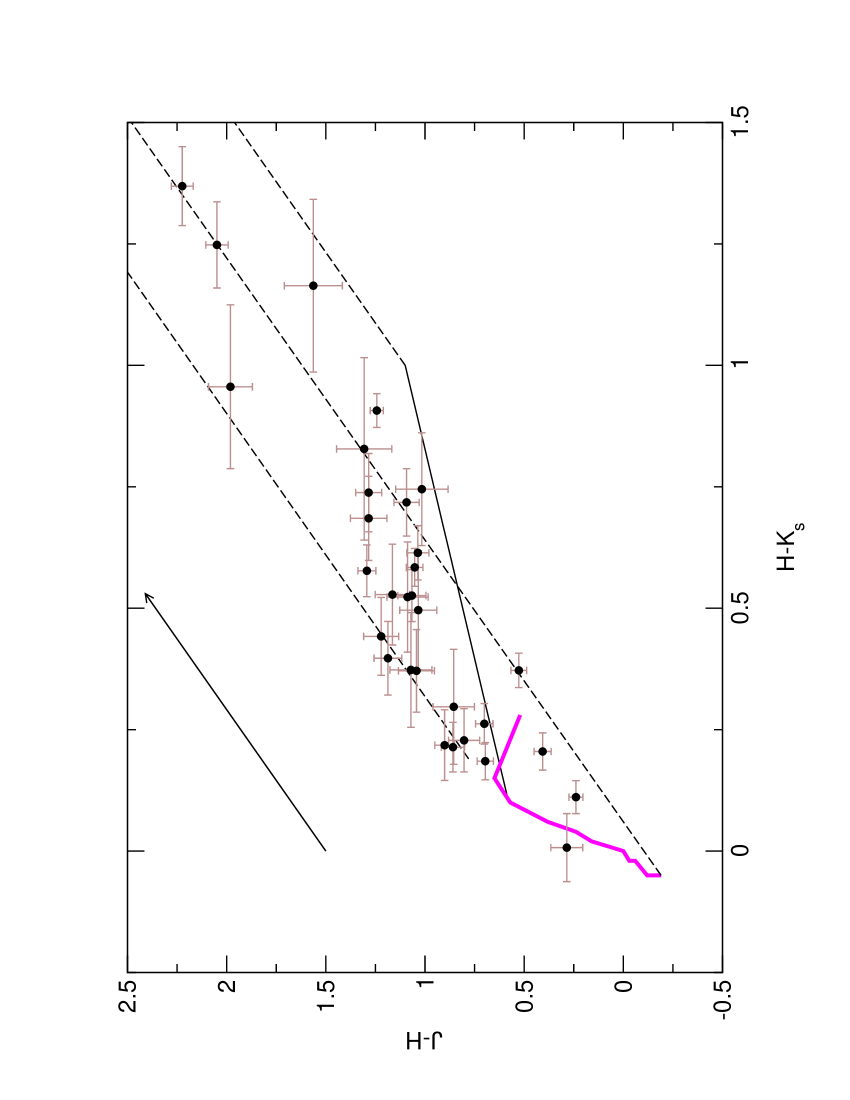
A large number of stars in the direction of the nebula NGC 6595 are red giants from the bulge. These stars were removed in the statistical star field subtraction. A diagram, resulted from the field subtraction method, is shown in Fig. 13.
The percentage of the cluster stars with band excess is 20%, similar to that of the vdBH-RN 38 cluster.
The mean reddening is (). This value is somewhat larger than the spectroscopic one (Table 2) – see discussion in Sect. 4.1. The PMS isochrone method indicates an age of Myr and an age dispersion of Myr.
In Fig. 14 we show an obtained CMD for the object together with the PMS isochrone fit. Spectroscopic data for the most massive star indicates a B3-4 spectral type (Sect. 3.1). The fit points to an object that presents most of the stellar masses in the range 0.5M⊙ to 1M⊙. The observed distance modulus is , implying a distance from the Sun of d⊙ kpc.
5 Concluding remarks
Six candidate stellar systems were investigated by means of optical spectroscopy and infrared photometry in the reflection nebulae vdBH-RN 26, vdBH-RN 38, vdBH-RN 53a, GGD 20, ESO 95-RN 18 and NGC 6595. Except for vdBH-RN 53a and ESO 95-RN 18, which are less populous in stars and require larger telescope data, we carried out an analysis of the CMDs and colour-colour diagrams.
The distance found for the vdBH-RN 26 cluster is d⊙ kpc, coincident with previous estimate in the literature for the nebula (Sect. 1). For vdBH-RN 38 we found d⊙ kpc, closer than previous estimates. These objects are in different evolutionary stages. The larger fraction of excess stars in vdBH-RN 26 is an indication of a young object, confirmed by the mean age value Myr, found based on PMS isochrones. vdBH-RN 38 has Myr. The reddening values are and , respectively, considerably smaller than those found for deeply embedded clusters in molecular clouds, where can be as large as 100 (Lada & Lada 2003).
The GGD 20 cluster has 30% of its stars with infrared excess, suggesting an age of 2-3 Myr, a somewhat larger than the mean age Myr found by means of the PMS isochrones method. The brightest star in the nebula direction is a foreground K4 star. The distance is d⊙ kpc, and the mean absorption is . The NGC 6595 cluster has a mean age of Myr. Its distance is d⊙ kpc, while the absorption has been found to be .
These stellar systems appear to be low mass embedded stellar clusters containing few stars (observed cluster masses smaller then ). Their absorptions and ages point to an evolutionary stage similar to that of the clusters in the molecular cloud CMaR1 (Soares & Bica 2002, 2003). The analysed clusters have no stars with spectral types earlier than B, in agreement with the nature of the reflection nebula, without significant ionization as in an HII region. In particular, the central stars of vdBH-RN 38 and NGC 6595 are B3-4 stars.
The masses estimated for the present objects indicate that they are unbounded stellar systems (Kroupa & Boily 2002). The number of young clusters or groups catalogued or studied in detail is small (Sect. 1). Since the mass enclosed in these objects is not large, they do not appear to be major contributors to the field population of stars.
Acknowledgements.
This publication makes use of data from the Two Micron All Sky Survey, which is a joint project of the University of Massachusetts and the Infrared Processing and Analysis Center, funded by the National Aeronautics and Space Administration and the National Science Foundation. We employed data from the CDS database (Strasbourg). We acknowledge the referee and Leandro Kerber by the important comments on this study. We acknowledge support from the Brazilian institution CNPq, in particular J.S. for a CNPq PhD fellowship. This work was also partially supported by the Argentinian institutions CONICET, Secyt (Universidad Nacional de Córdoba), Agencia Córdoba Ciencia and Agencia Nacional de promoción Científica y Tecnológica (ANPCyT).References
- (1) Ahumada, A. V., Clariá, J. J., Bica, E., Dutra, C. M., & Torres, M. C. 2001, A&A, 377, 845
- (2) Bertelli, G., Bressan, A., Chiosi, C., Fagotto, F., & Nasi, E. 1994, A&AS, 106, 275
- (3) Bica, E., Dutra, C. M., & Barbuy, B. 2003a, A&A, 397, 177
- (4) Bica, E., Dutra, C. M., Soares, J., & Barbuy, B. 2003b, A&A, 404, 223
- (5) Binney, J., & Merrifield, M. 1998, Galactic Astronomy, eds Ostriker, J. P. and Spergel, D. N., Princeton, 107
- (6) Brand, J., Blitz, L., & Wouterloot, J. G. A. 1986, A&AS, 65, 537
- (7) Brand, J., & Blitz, L. 1993, A&A, 275, 67
- (8) Calvet, N., Magris, G. C., & Patino, A. 1992, RMxAA, 24, 27
- (9) Cardelli, J.A., Clayton, G., & Mathis, J.S. 1989, ApJ, 345, 245.
- (10) Carpenter, J. M., Snell, R. L., Schloerb, F. P., & Skrutskie, M. F. 1993, ApJ, 407, 657
- (11) D’Antona, F., & Mazzitelli, I. 1997, Evolution of low mass stars in Cool stars in Clusters and Associations, eds. G. Micela and R. Pallavicini, Mem. S.A.It., 68, 807
- (12) D’Antona, F., & Mazzitelli, I. 1998, A role for superadiabatic convection in low mass structures?, in Brown Dwarfs and Extrasolar Planets, ASP Conference Series, eds. R. Rebolo, E. Martin, M.R. Zapatero Osorio, p. 442
- (13) Dutra, C. M., & Bica 2001, A&A, 376, 434
- (14) Dutra, C. M., Bica, E., Soares, J., & Barbuy, B. 2003, A&A, 400, 533
- (15) Gyulbudaghian, A. L., Glushkov, Iu. L., & Denisiuk, A. E. 1978, ApJ, 224, 137
- (16) Herbst, W. 1975, AJ, 80, 212
- (17) Haisch, K. E., Jr., Lada, E. A., & Lada, C. J. 2001, AJ, 121, 2065
- (18) Hillenbrand, L., Strom, S. E., Vrba, F. J., & Keene, J. 1992, ApJ, 397, 613
- (19) Kenyon, S. J., Calvet, N., & Hartmann, L. 1993, ApJ, 414, 676
- (20) Kenyon, S. J., & Hartmann, L. 1995, ApJS, 101, 117
- (21) Kerber, L. O., Santiago, B. X., Castro, R., & Valls-Gabaud, D. 2002, A&A, 390, 121
- (22) Kroupa, P., & Boily, C. M. 2002, MNRAS, 336, 1188
- (23) Lada, C. J., & Adams, F. 1992, ApJ, 393, 278
- (24) Lada, C. J., Alves, J., & Lada, E. A. 1996, AJ, 111, 1964
- (25) Lada, C. J., & Lada, E. A. 2003, ARA&A, 41, 115
- (26) Lauberts, A. 1982, ESO/Uppsala survey of the ESO(B) atlas, Garching: ESO
- (27) Matzner, C. D., & McKee, C. F. 2000, ApJ, 545, 364
- (28) Meyer, R. M., Calvet, N., & Hillenbrand, L. A. 1997, AJ, 114, 288
- (29) Piatti, A. E., Clariá, J. J., & Bica, E. 2000, A&A, 360, 529
- (30) Schlegel, D. J., Finkbeiner, D. P., & Davis, M. 1998, ApJ, 500, 525
- (31) Schmidt-Kaler, T. 1982, in Landolt-Börnstein, New Series, Group VI, Vol. 2b (Springer-Verlag, Berlin), 1
- (32) Silva, D. R., & Cornell, M. E. 1992, ApJS, 81, 865
- (33) Skrutskie, M., Schneider, S. E., Stiening, R., et al. 1997, in The Impact of Large Scale Near-IR Sky Surveys, eds. F. Garzon et al., Dordrecht: Kluwer, 25
- (34) Soares, J. B., & Bica E. 2002, A&A, 388, 172
- (35) Soares, J. B., & Bica E. 2003, A&A, 404, 217
- (36) Stone, R. P. S., & Baldwin, J. A. 1983 MNRAS 204, 347
- (37) Strom, K. M., Kepner, J., & Strom, S. E. 1995, ApJ, 438, 813
- (38) Testi, L., Palla, F., & Natta, A. 1998, A&AS, 133, 81
- (39) van den Bergh, S., & Herbst, W. 1975, AJ, 80, 208
- (40) Vieira, S. L. A. et al. 2003, AJ, 126, 2971
- (41) Williams, P. M., Brand, P. W. J. L., Longmore, A. J., & Hawarden, T. G. 1977, MNRAS, 180, 709