Dust and Ionized Gas in Nine Nearby Early-Type Galaxies Imaged with the HST Advanced Camera for Surveys11affiliation: Based on observations made with the NASA/ESA Hubble Space Telescope which is operated by AURA, Inc., under NASA contract NAS 5-26555.
Abstract
We present and continuum images and H+[N II] maps of nine early-type galaxies observed with the Wide Field Channel of the Advanced Camera for Surveys on the Hubble Space Telescope. Dust and ionized gas are detected in all galaxies. The optical nebulae are primarily concentrated on the nuclei and extend out to radii of a few hundred parsecs, in compact clumps, filaments, or disks. Two galaxies, NGC 6166 and NGC 6338, also possess diffuse, ionized filaments on kiloparsec scales. The ionized gas is entirely contained within the nuclear disks of ESO 208-G021, NGC 3078, and NGC 7720. In the radio-loud galaxy NGC 6166, emission-line filaments are detected along the radio lobes, possibly as a result of shock ionization. A wide range of ionized gas masses, , are calculated from the observed fluxes. Even in this small sample, the orientation of the ionized material correlates well with the major or minor axis of the galaxies, consistent with an external origin for the dust and gas.
Subject headings:
galaxies: elliptical and lenticular, cD — galaxies: ISM — dust, extinction1. Introduction
Nearby, bright early-type galaxies have been the subject of numerous imaging studies with the Hubble Space Telescope (HST), encompassing several facets of their formation and evolution. The high spatial resolution of HST has provided new insights in the properties of their evolved stellar population, such as metallicity, mean age, radial distribution, and color-magnitude diagrams. The surface frequencies, core sizes, colors, luminosity functions, and radial dependence of their globular cluster populations have also been examined in detail (e.g. Kundu & Whitmore 2001). Deep imaging of their cores has revealed rich dust morphologies in a majority of them, such as disks and filaments (van Dokkum & Franx 1995; de Koff et al. 2000; Tran et al. 2001), previously unresolved with ground-based telescopes. Moreover, early-type galaxies have been the nearly exclusive targets for spectroscopic measurements of supermassive black holes (BHs) with HST.
Not surprisingly, the great majority of these programs have been conducted in broad-band continuum filters. Comparatively little effort has been devoted to narrow-band imaging in prominent emission lines, although such data is crucial for the understanding of the warm gas phase ( K) of the interstellar medium (ISM) and its interaction with other phases, in particular the cold dust ( K) and the hot X-ray gas ( K).
Deep narrow-band imaging at the resolution of HST would help elucidate the energetics and origin of the warm gas in early-type galaxies. Several excitation mechanisms have been postulated, such as stellar radiation (photoionization by star-forming regions or old post-Asymptotic Giant Branch (AGB) stars), photoionization by an active nucleus, internal shocks, and electron conduction, but none yet stands out as the unequivocal favorite. In fact, a combination of mechanisms may be at play in individual galaxies. Moreover, although an external origin for the gas and dust from the accretion of a gas-rich companion galaxy is usually favored, an internal origin from mass ejection from evolved stars or cooling from the hot phase, can not be entirely dismissed (e.g. Mathews & Brighenti 2003).
Here, we present new continuum and H+[N II] emission-line images of a sample of nine early-type galaxies observed with the Advanced Camera for Surveys (ACS; Ford et al. 2002) as part of the ACS Guaranteed-Time-Observer (GTO) program. These galaxies have been well-studied from the radio to the X-ray spectral regimes, as evidenced by the abundance of references to them in the published literature. The galaxies were observed with the goal of mapping the distribution of their line-emitting regions for possible follow-up spectroscopy with HST to measure their BH masses. The spectroscopic results of the best candidates will be presented in a future paper.
2. Sample Selection
| Galaxy | (km sec-1) | (Mpc) | (km sec-1) | Type | ||
|---|---|---|---|---|---|---|
| ESO 208-G021 | 788 | 11.43 | 11 | -18.8 | 168 | S0 |
| NGC 404 | 82 | 10.93 | 3 | -16.5 | 54 | S0 |
| NGC 2768 | 1633 | 10.73 | 23 | -21.1 | 205 | S0 |
| NGC 2832 | 7003 | 12.62 | 100 | -22.4 | 310 | E |
| NGC 3078 | 2353 | 11.75 | 33 | -20.9 | 237 | E |
| NGC 3226 | 1410 | 12.17 | 20 | -19.3 | 208 | E |
| NGC 6166 (3C 338) | 9538 | 12.66 | 140 | -23.0 | 321 | E |
| NGC 6338 | 8541 | 13.30 | 120 | -22.2 | 347 | S0 |
| NGC 7720 (3C 465) | 9215 | 13.03 | 130 | -22.6 | 396 | E |
Note. — The radial velocity of the galaxy corrected for infall towards Virgo, , and the total apparent magnitude, , are tabulated from The Lyon-Meudon Extragalactic Database (HyperLEDA - http://leda.univ-lyon1.fr/; Paturel et al. 1997). The luminosity distance and absolute magnitude are derived from these quantities using (Bennett et al. 2003) except for NGC 404, for which we quote the more likely distance of 3 Mpc (see text). The stellar velocity dispersions are compiled from McElroy (1995) except for NGC 6338, which comes from HyperLEDA. The morphological type, lenticular (S0) or elliptical (E), is taken from the NASA Extragalactic Database (NED) which is primarily based on the Third Reference Catalogue of Bright Galaxies (RC3; de Vaucouleurs et al. 1995).
The galaxies were chosen with the primary aim of testing the tight relationship between the mass of their central black hole and the velocity dispersion of their bulge (Ferrarese & Merritt 2000; Gebhardt et al. 2000) at the lowest and highest possible velocity dispersions. To be a candidate in the ACS imaging program, we imposed two requirements. First, ionized gas must be present in the nuclear regions of each galaxy. For confirmation, a literature search of published H+[N II] spectra or line ratios was made. Second, if a black hole is present with the mass predicted by the galaxy’s velocity dispersion, the black hole’s sphere of influence , which is the region where the black hole’s gravitational potential dominates the potential of the stars, must be resolved with the long slit of the Space Telescope Imaging Spectrograph (STIS) on HST.
The selected galaxies and their global properties are listed in Table 1. They possess a large range of stellar velocity dispersions, km sec-1, and hence, black hole masses of to M☉ are expected. We note that the sample is not statistically complete and that the targets were not selected according to any luminosity criterion. The selection by alone resulted in a sample with a disparate range of properties. The blue absolute magnitudes are in the range . Four of the galaxies are lenticular (S0) while the others are elliptical. Three (NGC 404, NGC 2768, and NGC 3226) are LINERs and two (NGC 6166 and NGC 7720) are powerful radio galaxies hosting 3C sources. Nuclear dust disks are found in ESO 208-G021, NGC 3078, and NGC 7720.
3. Observations and Reduction
All the galaxies were observed in Cycles 11 and 12 as part of the ACS/GTO programs GTO-9293 and 9986 (PI : Ford) with the Wide Field Channel (WFC). The imaging device of the WFC consists of two butted CCDs manufactured by Scientific Imaging Technologies (SITe). All the frames were acquired in normal operation and read out with all four amplifiers (overall read-out noise e-) at a gain of 1 e-/DN.
The journal of observations is tabulated in Table 2. Each galaxy was observed for one orbit in a narrow-band filter, either F658N (FWHM Å) or FR656N (FWHM% or 130 Å), spanning the redshifted H+[N II] emission line complex, and in a broad-band filter (F555W or F814W), adjacent in wavelength, for continuum subtraction. All the broad-band exposures were limited to a total duration of 700 sec to avoid overhead penalties in the dumping of the on-board buffer memory and the remainder of the orbit was dedicated to the narrow-band exposure, typically 1400-1700 sec. The exposures were split into at least two sub-exposures, dithered slightly from each other for ESO 208-G021, for a more effective rejection of cosmic ray hits and/or hot pixels. The images were processed with the ACS Science Analysis Pipeline (APSIS; Blakeslee et al. 2003) at Johns Hopkins University. The spatial scale of the final, reduced images is pixel-1.
A dust map was generated for each galaxy of the sample. The stellar contribution in the broad-band image was first modeled with elliptical isophotes using the ellipse task in IRAF/STSDAS. A rough model was then subtracted from the original image and unwanted features such as bad pixels, dust lanes, and globular clusters were masked and excluded in a second pass. The ratio of the continuum image over its isophotal model yields the dust map : absorption features such as dust are dark and emission features such as globular clusters are light. No isophotal solution could be achieved inside a radius of for NGC 404 because of saturation in the central pixels. For NGC 6166, the fit was restricted to radii to achieve a valid solution over the isophotes of the masked surrounding galaxies.
| Galaxy | UT Date | Filter | Exposure (sec) |
|---|---|---|---|
| ESO 208-G021 | 2003 Jul 24 | F814W | 700 |
| F658N | 1550 | ||
| NGC 404 | 2003 Jan 8 | F814W | 700 |
| F658N | 1500 | ||
| NGC 2768 | 2003 Jan 14 | F814W | 700 |
| F658N | 1700 | ||
| NGC 2832 | 2003 Feb 17 | F555W | 700 |
| FR656N | 1400 | ||
| NGC 3078 | 2003 Apr 12 | F814W | 700 |
| F658N | 1700 | ||
| NGC 3226 | 2003 Mar 8 | F814W | 700 |
| F658N | 1400 | ||
| NGC 6166 | 2003 May 5 | F814W | 700 |
| FR656N | 1550 | ||
| NGC 6338 | 2003 Jan 11 | F814W | 700 |
| FR656N | 1700 | ||
| NGC 7720 | 2003 Nov 4 | F814W | 700 |
| FR656N | 1490 |
The isophotal analysis returns several quantities of interest : the surface brightness profile , the position angle (PA) of the major axis, the ellipticity , and B4, the coefficient of the component of the fit normalized by the semi-major axis and local intensity gradient. For , the photometric zero-points (ZEROPT) were calculated with the calcphot task in IRAF/SYNPHOT, giving 32.82 for F555W and 32.61 for F814W in the Vega magnitude system (). The transformation between the ACS and Johnson filter systems is available in Sirianni et al. (2004). B4 measures the deviation of the isophotes from a perfect ellipse - a negative value indicates a box-shaped isophote while a positive value, a disk-shaped isophote (Jedrzejewski 1987).
The extraction of the pure emission-line map went as follows. The intensity levels between the broad- and narrow-band images were matched using the counts in small regions in the host galaxy. The scaled continuum image was then subtracted from the narrow-band image and this offered a first approximation to the emission-line distribution. After a close examination, this map was refined by recalculating the scaling ratio in line- and dust-free regions. Residual dust signatures are visible in some images, usually in the core. This could be the result of color differences in the underlying stellar population and to the small differential extinction between the narrow- and broad- filters.
The line fluxes were measured by summing the counts in regions with positive line emission usually by delimiting the regions visually in SAOImage DS9. The conversion factor between the observed flux expressed in counts sec-1 and the “physical” flux in standard units of ergs sec-1 cm-2 was calculated with the calcphot task in IRAF/SYNPHOT by modeling the flux with a dummy 5 Å-wide Gaussian profile at the appropriate redshift, similar to the prescription of Biretta, Baggett, & Noll (1996) for narrow-band photometry with the Wide Field Planetary Camera 2 (WFPC2) on HST. The fluxes were then corrected for interstellar extinction using from Schlegel, Finkbeiner, & Davis (1998) and the Cardelli, Clayton, & Mathis (1989) extinction law for , followed by a correction for the galaxy redshift.
The errors in the line flux measurements are largely due to the choice of the scaling ratio and to the difficulty in defining the edges of the regions over which to sum the counts, in particular for the extended, low-surface brightness filaments. To estimate the errors, the fluxes were carefully measured on two separate occasions and the difference was simply taken as the measurement error. We find typical errors in a range of % from high- to low-surface brightness regions. Hence, we adopt an uncertainty of 20% on all line fluxes.
4. Results
4.1. Dust and Ionized Gas Morphologies
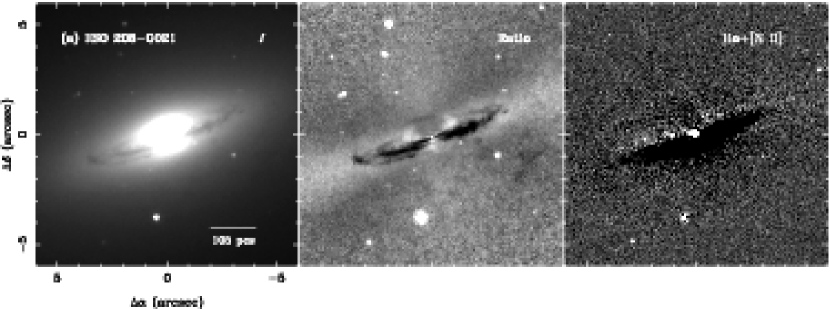
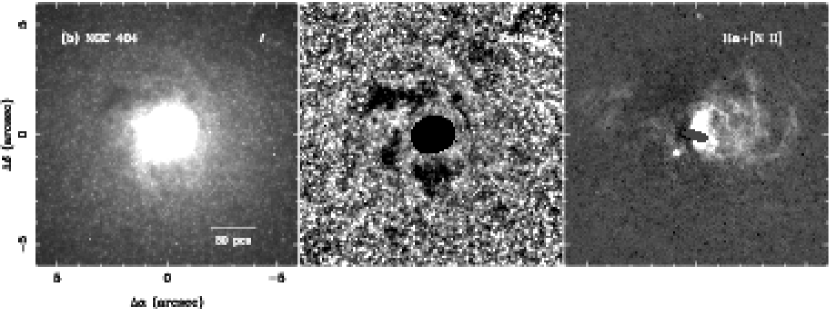
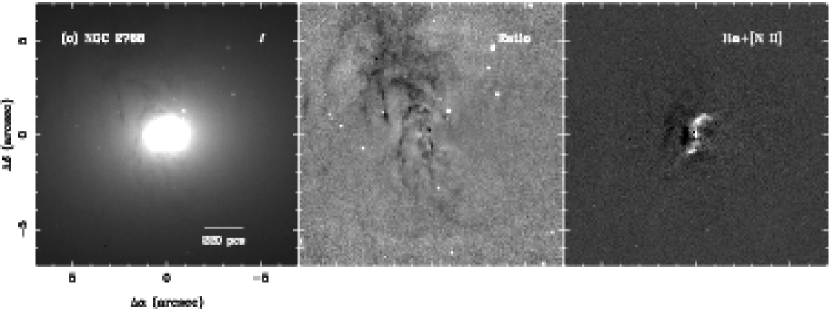
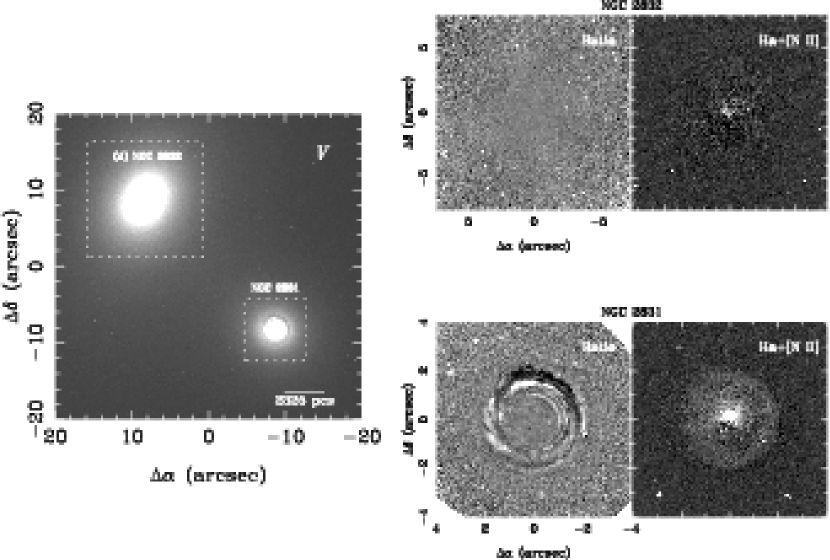
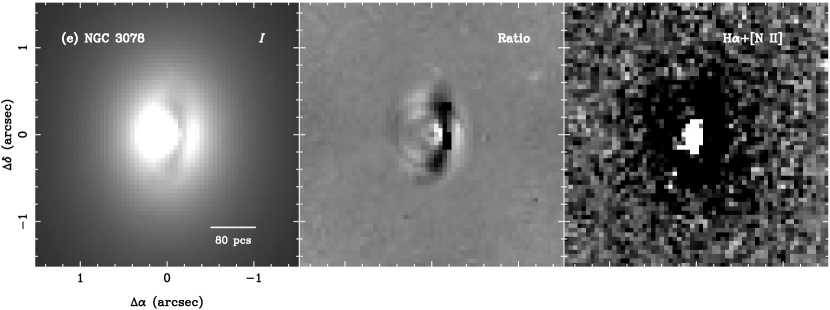
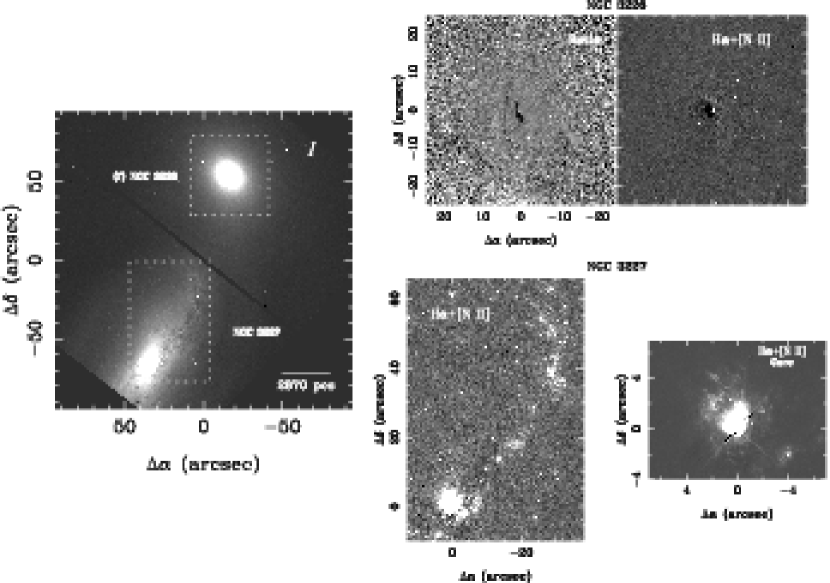
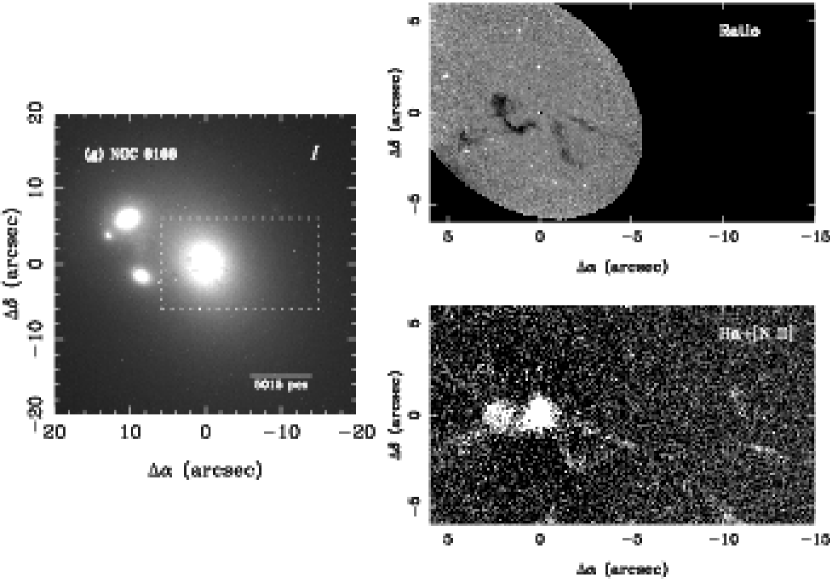
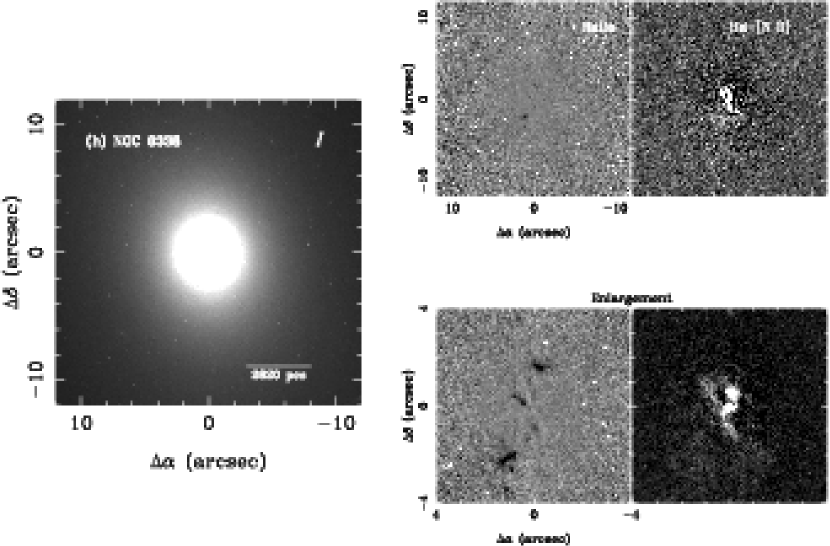
The continuum image, the dust map, and the continuum-subtracted emission-line map of each galaxy of our sample are shown in Fig. 1. The surface brightness profile , the position angle PA, the ellipticity , and the harmonic amplitude are plotted in Fig. 2. In the following, we discuss the dust and ionized gas morphologies in more detail.
ESO 208-G021 — Fig. 1(a) : This galaxy possesses a nearly edge-on nuclear disk roughly 375 pc () in diameter and oriented along the major axis of the galaxy (). The ionized gas is observed along the “northern” edge of the disk, suggesting that it is primarily confined to its interior. The gas appears diffuse with a few faint compact clumps. The most prominent is located at the geometrical center of the disk which coincides with the galaxy center. Scorza et al. (1998) performed a photometric disk/bulge decomposition of ESO 208-G021 - our isophotal results are consistent with theirs. The B4 parameter indicates that the galaxy is very “disky” throughout most of its extent. The field around the galaxy is pockmarked with numerous nebulosities. A galaxy located to the south and first identified by Lauberts (1982) is cleanly resolved into a nearly face-on Sc galaxy in our -band image.
NGC 404 — Fig. 1(b) : This extensively studied LINER galaxy, believed to be located just outside the Local Group, possesses the smallest stellar velocity dispersion in our sample (54 km sec-1). Its distance remains a matter of debate - typical estimates have ranged from Mpc (Baars & Wendker 1976) to Mpc (Wiklind & Henkel 1990), but recent measurements from surface brightness fluctuations (Jensen et al. 2003) and color-magnitude diagrams (Tikhonov, Galazutdinova, & Aparicio 2003) place it at a distance of Mpc. We adopt the lower value of 3 Mpc.
Previous HST images of NGC 404 in visible broad and narrow bands have been presented in Pogge et al. (2000), Tikhonov, Galazutdinova, & Aparicio (2003) and Martini et al. (2003). The greater depth of our ACS images reveals more detail in the galaxy’s circumnuclear regions. In our -band image, individual stars are resolved. In fact, from their WFPC2 data, Tikhonov, Galazutdinova, & Aparicio (2003) derived the color-magnitude diagram of NGC 404 and found that the stellar population is typical of an early-type galaxy. The B4 parameter shows no strong preference for boxiness or diskiness.
As was found in the WFPC2 work, the dust and gas distributions are complex. Three distinct, irregular clumps of dust are found in the eastern half of the galaxy out to a radius of pc () at PAs of , , and . The overall orientation of the ionized gas is along the east-west axis. It consists of a bright clump of diameter pc () elongated along a north-south direction and roughly centered on the nucleus. Remarkably, two filaments are attached at each end of the clump. In projection, the filaments intertwine and cross at a radius of pc () from the nucleus. The filament connected to the northern end of the clump forms an S-shape and extends the furthest to the west, out to pc (). The other filament simply curves to the north and appears to bifurcate into two strands. Other shorter and fainter filaments are also observed. Pogge et al. (2000) and Eracleous et al. (2002) interpret the gas morphology as a superbubble blown out by a circumnuclear starburst. In the east, the gas extends out to pc () and is very diffuse and patchy except for a bright, resolved knot located at the end of a filament, at pc () SE of the nucleus. Some of this gas is likely heavily obscured by the dust.
NGC 2768 — Fig. 1(c) : Another popular LINER, NGC 2768 displays a rich network of dusty filaments and knots extending to a radius of kpc (), mostly dominant in the northern part of the galaxy. The main axis of the dust distribution is nearly aligned with the minor axis of the galaxy. The ionized gas is concentrated in a beautiful spiral feature whose long axis is oriented north-south. Its total length is pc () and it appears imbedded in a diffuse halo. Each arm of the spiral consists of a small inner clump (at radii pc ()) completed by a brighter curved knot. The nucleus appears unresolved. The overall morphologies and orientations of the gas and dust features are consistent with the ground images presented by Kim (1989).
NGC 2832 — Fig. 1(d) : NGC 2832 is the cD galaxy of the Abell 779 cluster. Its B4 parameter indicates that the isophotes are generally boxy. There is little evidence of dust in the galaxy except perhaps for a hint of a narrow, twisting lane meandering through the core along a north-south axis. In an F814W WFPC2 image, Seppo et al. (2003) find no signature of dust absorption in the central . The ionized gas consists of a clump centered on the nucleus with a possible second and fainter clump immediately NE of it.
Its close companion galaxy, NGC 2831, is located kpc () to the south-west and possesses a face-on dust disk. The redshifted H+[N II] line complex of NGC 2831 also falls in the wavelength range of the FR656N filter - its ionization map shows that the gas is entirely confined to the interior of the disk.
NGC 3078 — Fig. 1(e) : An HST/WFPC2 F702W image of NGC 3078 is shown in Tran et al. (2001) and an isophotal analysis based on this image is presented in Rest et al. (2001). Our ACS images clearly show the nearly edge-on nuclear disk of diameter pc () oriented along the major axis of the galaxy. The galaxy isophotes are strongly boxy, in accord with Rest et al. (2001). The WFC field is pockmarked with a large number of unresolved globular clusters and faint, extended galaxies. The extraction of a reliable emission-line map is difficult because of the presence of the disk, but it appears that the warm gas is primarily concentrated on the nucleus, as reported by Trinchieri & di Serego Alighieri (1991) with ground-based narrow-band imaging. A small, lenticular galaxy located due east of NGC 3078 and identified with the infrared source 2MASX J09582899-2655366, is bifurcated by a thin dust lane.
NGC 3226 — Fig. 1(f) : The dwarf elliptical LINER NGC 3226 and its spiral neighbor NGC 3227, a popular Seyfert galaxy, form a well-known interacting pair of galaxies. The dust morphology of NGC 3226 is dominated by a semi-circular lane wrapping around the eastern side of the nucleus. Its outer radius is pc () and it lies at PAs of . The northern tip of the lane is connected to a chaotic group of dusty strands. Like the central lane, these are oriented roughly along a north-south axis, close to the major axis of the galaxy. More knots and filaments are detected in the south-west quadrant of the galaxy at a radius of 1.5 kpc () from the nucleus. Our detailed ionization map shows that the H+[N II] gas consists primarily of a clump of diameter 85 pc () centered on the nucleus. Our isophotal analysis of NGC 3226 is consistent with that of Rest et al. (2001).
The core as well as the northern spiral arm of NGC 3227 are also located on our broad- and narrow-band ACS frames. The unresolved Seyfert nucleus is saturated in our -band frame. The spiral arm exhibits a complicated and chaotic network of dust filaments, in accord with the WFPC2 structure map of Pogge & Martini (2002). The redshifted H+[N II] lines of NGC 3227 fall within the wavelength range of the F658N filter used to image NGC 3226. The derived ionization map shows a large number of luminous and compact clumps imbedded in diffuse regions in the spiral arm, likely the sites of active star formation. The geometry of the circumnuclear gas of NGC 3227 has been described by Mundell et al. (1995) using ground-based [O III] imaging and later by Schmitt & Kinney (1996) using the HST Wide Field/Planetary Camera 1 (WF/PC-1). Our ACS continuum-subtracted maps confirm their conclusions : a cone of ionized gas clearly extends in the NE quadrant at an orientation of PA. Moreover, the high spatial resolution of HST/ACS reveals several knotty and twisting gas filaments inside the cone radiating outward from the core out to a distance of pc ().
NGC 6166 — Fig. 1(g) : NGC 6166, host of the powerful radio source 3C 338, is the dominant cD galaxy in Abell 2199. A wealth of information on this galaxy is available in the literature over all wavelength domains. Here, we compare our data with past ground and HST imaging at visible wavelengths. Continuum images acquired with HST’s WF/PC-1 and WFPC2 cameras in the F555W/ and F702W/ filters are presented in Lauer et al. (1995), Martel et al. (1999), and de Koff et al. (2000). Our new ACS images are significantly deeper and reveal previously undetected dust and ionized filaments.
The dust morphology consists of several filaments spread throughout the southern half of the galaxy out to a distance of kpc () from the nucleus. Unfortunately, because of the nearby galaxies that contaminate the isophotal models, the dust map can not be extended to larger radii. A large clump, pc () in size, is located kpc () immediately east of the nucleus, at the northern tip of a curved filament.
Most of the emission-line flux of NGC 6166 comes from its nuclear regions. Indeed, using ground-based narrow-band imaging, Morganti, Ulrich, & Tadhunter (1992) did not detect extended line emission in this object. On the other hand, our deep ACS images reveal several low-surface brightness filaments out to radii of kpc () in the SW quadrant. Strong line emission is also associated with the eastern dust clump. The strong spatial correlation on all scales between the dust and gas features is quite remarkable in this galaxy.
| Galaxy | [N II]/H | Reference | ||||
|---|---|---|---|---|---|---|
| (1) | (2) | (3) | (4) | (5) | (6) | (7) |
| ESO 208-G021 | 24.8 | 3.65 | 4.91 | 0.72 | 3.02 | Phillips et al. (1986) |
| NGC 404 | 93.5 | 1.01 | 0.44 | Ho, Filippenko, & Sargent (1997) | ||
| NGC 2768 | 38.4 | 24.5 | 13.0 | 8.28 | 1.46 | Ho, Filippenko, & Sargent (1997) |
| NGC 2832 | 3.12 | 37.7 | 0.64 | 7.69 | 2.91 | Ho, Filippenko, & Sargent (1997) |
| NGC 3078 | 2.75 | Trinchieri & di Serego Alighieri (1991) | ||||
| NGC 3226 | 47.9 | 22.7 | 16.3 | 7.71 | 1.45 | Ho, Filippenko, & Sargent (1997) |
| NGC 6166 | 31.3 | 710 | 8.50 | 193 | 2.00 | Cowie et al. (1983) |
| NGC 6338 | 1.22 | 2.2 | ||||
| NGC 7720 | 29.2 | 618 | 4.23 | 89.4 | 4.41 | de Robertis & Yee (1990) |
Note. — (1) : Galaxy name; (2)-(3) : and – our measurements of the H+[N II] line fluxes and luminosities from the ACS/WFC narrow-band images in ergs sec-1 cm-2 and ergs sec-1, corrected for Galactic extinction and redshift. The saturated core of NGC 404 is excluded. Uncertainties on the line fluxes are %.; (4)-(5) : and — the H line fluxes and luminosities after removal of the [N II] contribution using [N II]/[N II], in the same units as cols (2)-3).; (6)-(7) : the [N II]/H ratio and its reference. For NGC 7720, the ratio with respect to the narrow component of H is listed.
NGC 6338 — Fig. 1(h) : NGC 6338 is the cD galaxy of a poor cluster. Its dust distribution consists of several knots lying along PA. The separation between the northernmost and southernmost knots is kpc (). The ionized gas consists of two luminous, compact clumps in the central arcsecond of the galaxy and of several broken and diffuse filaments extending out to kpc () in the south-east and north-west quadrants. The southern clump coincides with the nucleus of the galaxy. The central clumps are roughly oriented along the major axis of the galaxy while the large-scale filaments lie along the minor axis. Similar to NGC 6166, the dust knots trace the gas morphology very well.
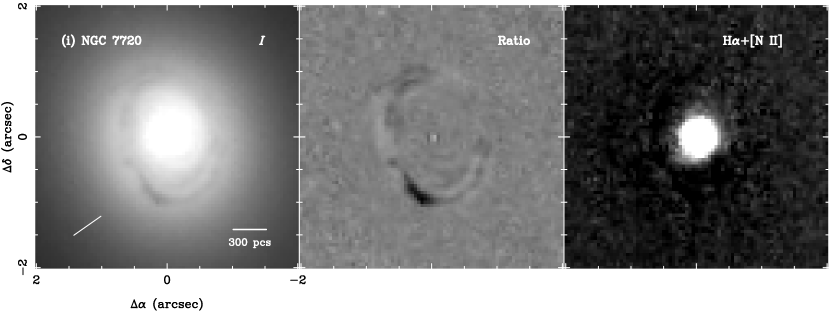
NGC 7720 — Fig. 1(i) : This system in Abell 2634 consists of two galaxies separated by . We are interested in the southern galaxy of the pair : it possesses a nearly face-on nuclear dust disk and the radio source 3C 465 appears associated with it (Venturi et al. 1995). An H+[N II] image of this galaxy as well as an HST/WFPC2 -band image of the pair are presented in Martel et al. (2000). Our deeper ACS frames show more detail in the structure of the disk. Also, the gas distribution is strongly peaked on the nucleus and does not appear to extend beyond the edges of the disk.


4.2. Mass of the Dust and Ionized Gas
The measured H+[N II] fluxes corrected for the redshift and Galactic extinction are listed in cols (2) and (3) of Table 3. The line flux of NGC 3078 is very uncertain and is not tabulated. Our deep, high-resolution ionization maps permit us to estimate the mass of the ionized gas in each galaxy by making reasonable assumptions about the volume that it occupies. To do so, the pure H luminosity is needed, so our measurements must be corrected for contamination by the [N II] doublet.
Since the dominant excitation mechanism may be different in each galaxy, possibly resulting in a wide range of [N II]/H, we avoid using a single, generic line ratio for all objects. A literature search yielded [N II]/H for all our targets except NGC 6338. The ratios, as well as the relevant references, are given in cols (6) and (7) of Table 3. Because of the lack of spatially resolved spectroscopic information, these values are assumed to be uniform throughout the galaxies. The final corrected H fluxes and luminosities are given in cols (4) and (5). The H luminosity of the two radio-loud sources, NGC 6166 and NGC 7720, is more than an order magnitude greater than that of the other “normal” early-type galaxies, as found in previous work (e.g. Baum & Heckman 1989a).
The mass of ionized material is :
| (1) |
where for a 10% helium abundance :
| (2) |
and from Osterbrock (1989) :
| (3) |
where is the line luminosity in ergs sec-1, is the volume occupied by the emitting gas, is the volume filling factor, cm3 sec-1 at K for Case B recombination, is the Planck constant, and is the frequency of H.
The computation of the volumes occupied by the line emitting gas is highly uncertain due to the lack of three dimensional information. We assume that the volumes of the filaments are cylindrical and that the ionized gas possesses a disk geometry in ESO 208-G021 and NGC 7720, is conical in NGC 3226, and is spherical in the clumps of NGC 2832 and NGC 6166. The filling factor can be derived for the three galaxies NGC 404, NGC 2768, and NGC 3226, given the electron densities calculated by Ho, Filippenko, & Sargent (1997) using the [S II] doublet : , respectively. For the remaining galaxies, we simply use the average . The ionized gas masses are listed in Table 4. Although they span a wide range, , these are typical for early-type galaxies (e.g. Goudfrooij et al. 1994).
For completeness, we also calculate the mass of the dust in the galaxies. This quantity is usually estimated from the optical extinction (e.g. van Dokkum & Franx 1995) or from the far-infrared (FIR) emission. Goudfrooij & de Jong (1995) point out that the dust masses derived from the optical extinction are significantly lower (by a factor of ) from those computed from the FIR flux densities. They attribute this discrepancy to the presence of a diffuse and uniform dusty component spread throughout the galaxy which goes undetected in the optical imaging. The differential extinction from this dust, perhaps combined with metallicity effects, might contribute to the observed color gradients in early-type galaxies (e.g. Silva & Wise 1996). But such diffuse dust may not be necessary to account for the missing mass if a model more sophisticated than a screen is used to calculate the extinctions. For example, in modeling the nuclear dusty disk of NGC 4261 with a sandwich model that included scattering into the line-of-sight, Martel et al. (2000) found that the mass of the disk is about an order of magnitude greater than the mass calculated with a foreground screen model.
Here, to insure that we include all forms of the dust, from diffuse to clumpy, we use the flux densities measured by the Infrared Astronomy Satellite (IRAS). This method provides a good estimate of the dust mass for temperatures over which IRAS is sensitive, K below m, but does not take into account colder dust that radiates at longer wavelengths. Following Goudfrooij & de Jong (1995) and Tran et al. (2001), the mass is given by :
where is the IRAS flux density in mJy, is the distance in Mpc, is the wavelength in microns, and is the dust temperature in Kelvins. The IRAS flux densities are taken from Knapp et al. (1989) as tabulated in the NASA Extragalactic Database (NED). The temperature of the dust, , is evaluated from the ratios in Kwan & Xie (1992). The resultant dust masses are given in Table 4. For the three “normal” galaxies (ESO 208-G021, NGC 404, NGC 2768), they fall in the range , in accord with the results of larger surveys (e.g. Tran et al. 2001). The dust masses of the two radio-loud sources, NGC 6166 and NGC 7720, are larger, .
| Galaxy | Gas Mass () | Dust Mass () |
|---|---|---|
| ESO 208-G021 | ||
| NGC 404 | ||
| NGC 2768 | ||
| NGC 2832 | ||
| NGC 3078 | ||
| NGC 3226 | ||
| NGC 6166 | ||
| NGC 6338 | ||
| NGC 7720 |
5. Discussion
Our sparse sample was not explicitely selected for an in-depth study of the ionization mechanisms and of the origin of gas and dust in early-type galaxies, but even so, given the high quality and spatial resolution of our images, we can make a few general remarks on these matters.
5.1. The Ionization Mechanisms
The emission-line nebulae in the early-type galaxies of our sample are centrally concentrated inside radii of a few hundreds parsecs. In two cases, NGC 6166 and NGC 6338, filaments of ionized gas are detected much further out, at distances of kpc. But in all cases, the bulk of the line emission comes from the central galactic regions - the extended nebulae, when present, are significantly more diffuse. Large ground-based surveys (e.g. Kim 1989; Shields 1991; Goudfrooij et al. 1994; Macchetto et al. 1996) have also found similar gas distributions over similar spatial extents. There are likely more than one excitation mechanism at work in individual galaxies, especially on different scales. In the following, we consider some of the most popular mechanisms that have been discussed in the literature.
Even though the star formation rates in our galaxies are insignificant, year-1 using the relation of Kennicutt (1998) and assuming that the observed H is entirely produced by the star-forming process, photoionization by massive, hot, young stars may still be responsible for some of the ionized gas. For example, although the dominant power source in LINERs is still unclear, either a starburst or a diminutive active nucleus, at least one of our three LINERs, NGC 404, is known to possess a weak, circumnuclear star-forming region, based on its H II type spectrum (Ho, Filippenko, & Sargent 1995) and UV and X-ray morphologies and energy output (Maoz et al. 1995, 1996 ; Eracleous et al. 2002). Moreover, the optical nebulae in the galaxies appear associated with cold dust, as expected for star-forming regions, and in some cases, the gas and dust filaments are exactly coincident. Compact clumps, a common signature of star formation, are also observed, although smooth, kpc-scale filaments, such as in NGC 6338, may point to another source of ionization. High-resolution imaging in the ultraviolet may help pinpoint active sites of star formation in this sample, as for NGC 404.
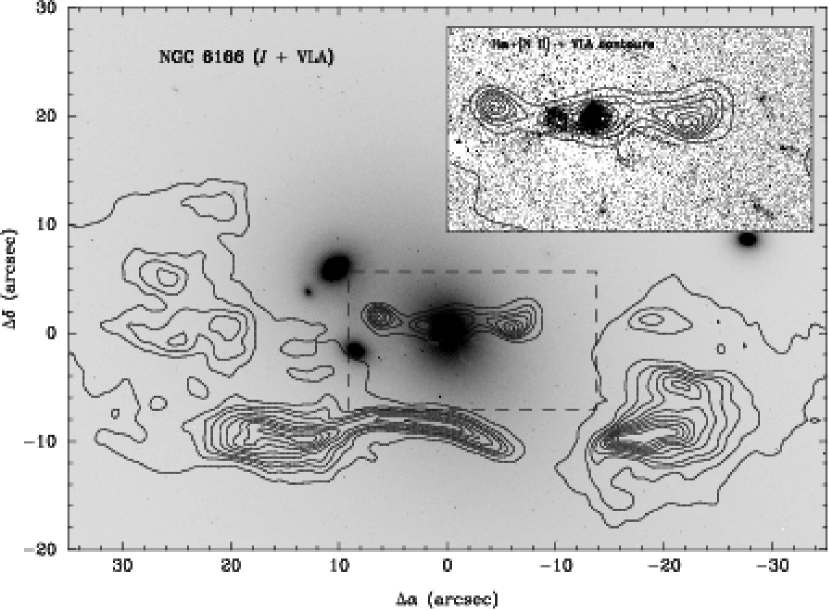
Photoionization by an active nucleus is likely dominant in NGC 6166 and NGC 7720. These harbor powerful 3C radio sources and the bulk of their line emission is concentrated on the nucleus, as is commonly observed in radio-loud galaxies (Morganti, Ulrich, & Tadhunter 1992). In Fig. 3, we overlay the VLA map of Ge & Owen (1994) atop our ACS broad- and narrow-band images. In the central , the radio morphology of 3C 338 consists of a jet structure terminated by two lobes on each side of the core on the East-West axis. Some of the off-nuclear ionized structures are spatially correlated with this radio morphology - this association may represent evidence of jet-induced shock ionization. In particular, the eastern emission-line clump described in § 4.1 is located exactly between the core and the eastern lobe. Also, one prominent ionized filament lies along the southern edge of the western radio lobe and others are detected near its tip. In an HST/STIS ultraviolet map, Allen et al. (2002) find no compact clumps at the location of the filaments, suggesting that unextincted, active star formation is not very important in these structures. Confirmation of the excitation mechanism in the extended structures of NGC 6166 will require deep, spatially resolved spectroscopy or imaging in other diagnostic emission lines.
Another possible source of ionization is thermal conduction by electrons (e.g. Sparks, Macchetto, & Golombek 1989). In this scenario, the cold gas and dust are the vestige of a merger event and are heated by the hot, diffuse X-ray coronal halo presumed to permeate the galaxy. Macchetto et al. (1996) show that this mechanism predicts H+[N II] luminosities consistent with those observed in a large number of galaxies - the line luminosities of our sample would mostly lie at the faint end of their distribution. Of course, the source of X-ray emission, either hot coronal gas or discrete stellar sources, such as low-mass X-ray binaries and supernovae, needs to be determined for the galaxies under consideration. From their large catalog of pseudo-bolometric X-ray luminosities, O’Sullivan, Forbes, & Ponman (2001) suggest that the X-ray emission of early-type galaxies with is dominated by discrete sources, while the hot coronal halo dominates in the more luminous galaxies. Not suprisingly, in our sample, only NGC 404 satisfies the low-luminosity criterion, so thermal conduction may prove a viable mechanism in the remaining galaxies.
Post-Asymptotic Giant Branch (AGB) stars have also been invoked as a source of line excitation in early-type galaxies (Trinchieri & di Serego Alighieri 1991; Binette et al. 1994). These stars can produce enough Lyman photons to account for the observed H luminosities. Indeed, in their large sample of galaxies, Macchetto et al. (1996) find that the line luminosities correlate well with the blue luminosity inside the radius of the emitting regions, suggesting that the excitation mechanism is tied to the old stellar population. The model H luminosities are in good agreement with their observed values, making post-AGB ionization a plausible scenario. Unfortunately, in our small sample, only NGC 6338 possesses kiloparsec-scale ionized material that may be consistent with post-AGB excitation; in the other galaxies, the line-emitting gas is strongly concentrated in the galaxy core over scales of only a few hundred parsecs or is dominated by some other ionization mechanism, such as a starburst in NGC 404 and photoionization by an active nucleus in NGC 6166 and NGC 7720. Therefore, we can not explore this excitation mechanism in more detail.
5.2. Origin of the Gas and Dust
It is generally believed that the gas and dust in early-type galaxies is external in origin, resulting from the tidal capture a gas-rich dwarf companion. Evidence for this scenario comes from spectroscopic surveys which find that the gas and stellar kinematics are often decoupled, even counter rotating (e.g. Bertola, Buson, & Zeilinger 1988, 1992; Kim 1989; Caon, Macchetto, & Pastoriza 2000). Also, the dust and gas are usually found to be co-spatial, suggesting that both components have the same origin. Over timescales of years, the gas and dust will settle on some permitted plane of the galaxy. Thus, any sample of early-type galaxies will likely offer a snapshot of the dust and gas in different dynamical states, from compact, organized, nuclear disks to extended, unsettled filaments. The orientation of the dust structures is usually found to correlate with the main axes of the stellar distribution, as expected in such a scenario (for example, see van Dokkum & Franx (1995), de Koff et al. (2000), and Tran et al. (2001) for radio-quiet and loud samples). From Fig. 4, we find that even in our limited sample, the orientation of the H+[N II] gas correlates well with either the major or minor axis. Since the dust and gas are essentially co-aligned, these results also hold true for the dusty features. One of the exceptions is NGC 6166, whose extended line emission is best aligned with the radio axis, as observed in other powerful radio sources (Baum & Heckman 1989b). Our results are therefore consistent with past work.

6. Summary
Resolved dust and ionized H+[N II] gas are found in all nine galaxies of our sample. In some, the dust and gas are well organized in small compact nuclear disks while in others, they are chaotic, filamentary, and spread throughout the galaxy. The line emission is entirely contained within the nuclear disks of ESO 208-G021, NGC 3078, and NGC 7720. The three LINERs NGC 404, NGC 2768, and NGC 3226 possess compact line-emitting regions (radii pc) while in the galaxies NGC 6166 and NGC 6338, the nebulae extend to kpc scales. Different ionization mechanisms may play a role in each galaxy, from nuclear starbursts in NGC 404 to jet-induced shock ionization in NGC 6166. The orientation of the line-emitting gas is generally aligned with the minor or major axis of the galaxies. A detailed comparison of our new images with UV and X-ray images will help to better understand the interaction between the different components of the ISM in early-type galaxies.
References
- (1)
- (2) Allen, M.G., Sparks, W.B., Koekemoer, A., Martel, A.R., O’Dea, C.P., Baum, S.A., Chiaberge, M., Macchetto, F.D., & Miley, G.K. 2002, ApJS, 139, 411
- (3)
- (4) Baars, J.W.M. & Wendker, H.J. 1976, A&A, 48, 405
- (5)
- (6) Baum, S.A. & Heckman, T. 1989a, ApJ, 336, 681
- (7)
- (8) Baum, S.A. & Heckman, T. 1989b, ApJ, 336, 702
- (9)
- (10) Bennett, C.L., Halpern, M., Hinshaw, G., Jarosik, N., Kogut, A., Limon, M., Meyer, S.S., Page, L., Spergel, D.N., Tucker, G.S., Wollack, E., Wright, E.L., Barnes, C., Greason, M.R., Hill, R.S., Komatsu, E., Nolta, M.R., Odegard, N., Peiris, H.V., Verde, L., & Weiland, J.L. 2003, ApJS, 148, 1
- (11)
- (12) Bertola, F., Buson, L.M., Zeilinger, W.W. 1988, Nature, 335, 705
- (13)
- (14) Bertola, F., Buson, L.M., Zeilinger, W.W. 1992, ApJL, 401, 79
- (15)
- (16) Binette, L., Magris, C.G., Stasinska, G., & Bruzual, A.G. 1994, A&A, 292, 13
- (17)
- (18) Biretta, J., Baggett, S., & Knoll, K. 1996, WFPC2 Instrument Science Report 96-06 (Baltimore : STScI)
- (19)
- (20) Blakeslee, J.P., Anderson, K.R., Meurer, G.R., Benítez, N., & Magee, D. 2003, ASP Conf. Series 295 : ADASS XII, 257
- (21)
- (22) Caon, N., Macchetto, D., & Pastoriza, M. 2000, ApJS, 127, 39
- (23)
- (24) Cardelli, J.A., Clayton, G.C., & Mathis, J.S. 1989, ApJ, 345, 245
- (25)
- (26) Cowie, L.L., Hu, E.M., Jenkins, E.B., & York, D.G. 1983, ApJ, 272, 29
- (27)
- (28) de Koff, S., Best, P., Baum, S.A., Sparks, W., Röttgering, H., Miley, G., Golombek, D., Macchetto, F., & Martel, A. 2000, ApJS, 129, 33
- (29)
- (30) de Robertis, M.M. & Yee, H.K.C. 1990, AJ, 100, 84
- (31)
- (32) de Vaucouleurs, G., de Vaucouleurs, A., Corwin, H.G., Buta, R.J., Paturel, G., & Fouqué, P. 1995, The Third Reference Catalogue of Bright Galaxies (RC3), VizieR On-line Data Catalog : VII/155
- (33)
- (34) Eracleous, M., Shields, J.C., Chartas, G., & Moran, E.C. 2002, ApJ, 565, 108
- (35)
- (36) Ferrarese, L. & Merritt, D. 2000, ApJ, 539, L9
- (37)
- (38) Ford, H., Clampin, M., Hartig, G., Illingworth, G., Sirianni, M., Martel, A., Meurer, G., McCann, Wm.J., Sullivan, P., Bartko, F., Benítez, N., Blakeslee, J., Bouwens, R., Broadhurst, T., Brown, R., Burrows, C., Campbell, D., Cheng, E., Feldman, P., Franx, M., Golimowski, D., Gronwall, C., Kimble, R., Krist, J., Lesser, M., Magee, D., Miley, G., Postman, M., Rafal, M., Rosati, P., Sparks, W., Tran, H., Tsvetanov, Z., Volmer, P., White, R., & Woodruff, R. 2002, in Future EUV/UV and Visible Space Astrophysics Missions and Instrumentation, eds. J.C. Blades & O.H.W. Siegmund, SPIE Vol. 4854, 81
- (39)
- (40) Ge, J. & Owen, F.N. 1994, AJ, 108, 1523
- (41)
- (42) Gebhardt, K., Bender, R., Bower, G., Dressler, A., Faber, S.M., Filippenko, A.V., Green, R., Grillmair, C., Ho, L.C., Kormendy, J., Lauer, T.R., Magorrian, J., Pinkney, J., Richstone, D., & Tremaine, S. 2000, ApJ, 539, L13
- (43)
- (44) Goudfrooij, P. & de Jong, T. 1995, A&A, 298, 784
- (45)
- (46) Goudfrooij, P., Hansen, L., Jørgensen, H.E., & Nørgaard-Nielsen, H.U. 1994, A&AS, 105, 341
- (47)
- (48) Ho, L.C., Filippenko, A.V., & Sargent, W.L.W. 1995, ApJS, 98, 477
- (49)
- (50) Ho, L.C., Filippenko, A.V., & Sargent, W.L.W. 1997, ApJS, 112, 315
- (51)
- (52) Jedrzejewski, R.I. 1987, MNRAS, 226, 747
- (53)
- (54) Jensen, J.B., Tonry, J.L., Barris, B.J., Thompson, R.I., Liu, M.C., Rieke, M.J., Ajhar, E.A., & Blakeslee, J.P. 2003, ApJ, 583, 712
- (55)
- (56) Kennicutt, Jr., R.C. 1998, ApJ, 498, 541
- (57)
- (58) Kim, D.-W. 1989, ApJ, 346, 653
- (59)
- (60) Knapp, G.R., Guhathakurta, P., Kim, D.-W., Jura, M.A. 1989, ApJS, 70, 329
- (61)
- (62) Kundu, A. & Whitmore, B.C. 2001, AJ, 122, 1251
- (63)
- (64) Kwan, J. & Xie, S. 1992, ApJ, 398, 105
- (65)
- (66) Lauberts, A. 1982, The ESO/Uppsala Survey of the ESO(B) Atlas (Munich : European Southern Observatory)
- (67)
- (68) Lauer, T.R., Ajhar, E.A., Byun, Y.-I., Dressler, A., Faber, S.M., Grillmair, C., Kormendy, J., Richstone, D., & Tremaine, S. 1995, AJ, 110, 2622
- (69)
- (70) Macchetto, F., Pastoriza, M., Caon, N., Sparks, W.B., Giavalisco, M., Bender, R., & Capaccioli, M. 1996, A&AS, 120, 463
- (71)
- (72) Maoz, D., Filippenko, A.V., Ho, L.C., Rix, H.-W., Bahcall, J.N., Schneider, D.P., & Macchetto, F.D. 1995, ApJ, 440, 91
- (73)
- (74) Maoz, D., Filippenko, A.V., Ho, L.C., Macchetto, F.D., Rix, H.-W., & Schneider, D.P. 1996, ApJS, 107, 215
- (75)
- (76) Martel, A.R., Baum, S.A., Sparks, W.B., Wyckoff, E., Biretta, J.A., Golombek, D., Macchetto, F.D., McCarthy, P.J., de Koff, S., & Miley, G.K. 1999, ApJS, 122, 81
- (77)
- (78) Martel, A.R., Turner, N.J., Sparks, W.B, & Baum, S.A. 2000, ApJS, 130, 267
- (79)
- (80) Martini, P., Regan, M.W., Mulchaey, J.S., & Pogge, R.W. 2003, ApJS, 146, 353
- (81)
- (82) Mathews, W.G. & Brighenti, F. 2003, ARA&A, 41, 191
- (83)
- (84) McElroy, D.B. 1995, ApJS, 100, 105
- (85)
- (86) Morganti, R., Ulrich, M.-H., & Tadhunter, C.N. 1992, MNRAS, 254, 546
- (87)
- (88) Mundell, C.G., Holloway, A.J., Pedlar, A., Meaburn, J., Kukula, M.J., & Axon, D.J. 1995, MNRAS, 275, 67
- (89)
- (90) Osterbrock, D.E. 1989, Astrophysics of Gaseous Nebulae and Active Galactic Nuclei (Mill Valley : University Science Books)
- (91)
- (92) O’Sullivan, E., Forbes, D.A., & Ponman, T.J. 2001, MNRAS, 328, 461
- (93)
- (94) Paturel, G., Andernach, H., Bottinelli, L., di Nella, H., Durand, N., Garnier, R., Gouguenheim, L., Lanoix, P., Marthinet, M.C., Petit, C., Rousseau, J., Theureau, G., & Vauglin, I. 1997, A&AS, 124, 109
- (95)
- (96) Phillips, M.M., Jenkins, C.R., Dopita, M.A., Sadler, E.M., & Binette, L. 1986, AJ, 91, 1062
- (97)
- (98) Pogge, R.W., Maoz, D., Ho, L.C., & Eracleous, M. 2000, ApJ, 532, 323
- (99)
- (100) Pogge, R.W. & Martini, P. 2002, ApJ, 569, 624
- (101)
- (102) Rest, A., van den Bosch, F.C., Jaffe, W., Tran, H., Tsvetanov, Z., Ford, H.C., Davies, J., & Schafer, J. 2001, AJ, 121, 2431
- (103)
- (104) Schlegel, D.J., Finkbeiner, D.P., & Davis, M. 1998, ApJ, 500, 525
- (105)
- (106) Schmitt, H.R. & Kinney, A.L. 1996, ApJ, 463, 498
- (107)
- (108) Scorza, C., Bender, R., Winkelmann, C., Capaccioli, M., & Macchetto, D.F. 1998, A&AS, 131, 265
- (109)
- (110) Seppo, L., van der Marel, R.P., Lauer, T.R., Postman, M., O’Dea, C.P., & Owen, F.N. 2003, AJ, 125, 478
- (111)
- (112) Shields, J.C. 1991, AJ, 102, 1314
- (113)
- (114) Silva, D.R. & Wise, M.W. 1996, ApJL, 457, 15
- (115)
- (116) Sirianni, M., Jee, M.J., Benítez, N., Blakeslee, J.P., Martel, A.R., Clampin, M., de Marchi, G., Ford, H.C., Gilliland, R., Hartig, G.F., Illingworth, G.D., Mack, J., McCann, J.W., & Meurer, G. 2004, PASP, submitted
- (117)
- (118) Sparks, W.B., Macchetto, F., & Golombek, D. 1989, ApJ, 345, 153
- (119)
- (120) Tikhonov, N.A., Galazutdinova, O.A., & Aparicio, A. 2003, A&A, 401, 863
- (121)
- (122) Tran, H.D., Tsvetanov, Z., Ford, H.C., Davies, J., Jaffe, W., van den Bosch, F.C., & Rest, A. 2001, AJ, 121, 2928
- (123)
- (124) Trinchieri, G. & di Serego Alighieri, S. 1991, AJ, 101, 1647
- (125)
- (126) van Dokkum, P.G. & Franx, M. 1995, AJ, 110, 2027
- (127)
- (128) Venturi, T., Castaldini, C., Cotton, W.D., Feretti, L., Giovannini, G., Lara, L., Marcaide, J.M., & Wehrle, A.E. 1995, ApJ, 454, 735
- (129)
- (130) Wiklind, T. & Henkel, C. 1990, A&A, 227, 394
- (131)