X-ray Line Emitting Objects in XMM-Newton observations: the tip of the iceberg.
Abstract
We present preliminary results from a novel search for X-ray Line Emitting Objects (XLEOs) in XMM-Newton images. Three sources have been detected in a test-run analysis of 13 XMM-Newton observations. The three objects found are most likely extremely absorbed AGN characterized by a column density cm-2. Their redshift has been directly determined from the X-ray data, by interpreting the detected emission line as the 6.4 keV Fe line. The measured equivalent width of the X-ray line is, in all three cases, several keV. This pilot study demonstrates the success of our search method and implies that a large sample of XLEOs can be obtained from the public XMM-Newton data archive.
1 Introduction
Both Active Galactic Nuclei (AGN) and clusters of galaxies are known to exhibit, under the right circumstances, a prominent emission line in their spectrum.
In the case of AGN the strongest line in the 2-10 keV range is the “neutral” Fe K line at 6.4 keV (Mushotzky, Done and Pounds, 1993). In “classical” optically Type 1 AGN, where both the continuum and the Fe-emitting region are viewed directly, the equivalent width (EW) of the Fe line is small and typically less than 200 eV (e.g. Nandra and Pounds, 1994). On the contrary, in the case of optically Type 2 AGN the Unification Scheme predicts that obscuring material (a molecular torus?) near the active nucleus blocks the direct view to the central engine. In these cases, if the “line emitting” material is exposed to a stronger continuum than the one detected by the observer, we should observe very large EW (Krolik and Kallman, 1987). For example, according to the modeling presented in Levenson et al. (2002), EW up to 10 keV are expected in the case of the most extreme Compton-thick ( cm-2) deeply buried AGN.
Furthermore it is now clear and well established that the classification of galactic nuclei based only on their optical spectrum provides an incomplete description of their nature (e.g. Vignali et al., 1999; Della Ceca et al., 2002; Maiolino et al., 2003) and that X-ray data are fundamental for the recognition and classification of galactic nuclei (see, among others, Severgnini et al., 2003 and references therein). For example, studies of active objects at IR and X-ray wavelengths indicate a concomitant AGN and starburst activity (Fadda et al., 2002) which seems to happen in a high-density medium ( cm-2) characterized by high dust extinction of the UV optical flux and strong photoelectric absorption of the soft X-rays. For these objects a detailed investigation around the iron line at 6.4 keV seems to be at the moment the only way to find evidence of the presence of an AGN (see e.g. Della Ceca et al., 2002). The existence (and the census) of such optically elusive AGN may have profound implications on the Cosmic X-ray Background (CXB) synthesis models as well as on our understanding of the accretion history vs. the stellar history of the Universe. As already discussed and emphasized by Levenson et al. (2002), the prominent Fe K line, which seems to be a very common feature of very obscured AGN, “can be exploited to find more of them”.
The second class of extragalactic objects known to exhibit a prominent iron line (the “ionized” Fe K line at 6.7 keV) in their X-ray spectrum are clusters of galaxies. X-ray selected cluster surveys in the ROSAT era, based on the source extent, (e.g. the RDCS survey: Rosati et al., 1995; 1998) have led to routine identification of clusters out to z = 0.85, with only a few examples at higher redshift (see Rosati, Borgani and Norman, 2002 and references therein). The search proposed here has the potential for finding clusters of galaxies up to a redshift of 1.6, thanks to their 6.7 keV ionized Fe K line. Indeed this line is clearly detected in the X-ray spectra of RDCS1252.9-2927 (Rosati et al., 2004), a massive cluster at z = 1.24. We are aware, however, that since the EW of the Fe line is smaller in cluster of galaxies than in absorbed AGN, the search for clusters of galaxies through their emission lines could be more difficult and/or less efficient than the search for heavily absorbed AGN.
The unprecedented combination of high throughput (600 cm2 effective area in the 2.35.0 keV energy band) and high energy and spatial resolution (100 eV FWHM at 3 keV and 15′′ respectively) offered by the ESA XMM-Newton X-ray telescope (just the one mirror module with the Epic-pn detector), has convinced us of the possibility of searching the sky in a novel way, to discover weak X-ray sources whose emission is mainly concentrated in line flux. Without a dedicated detection technique these sources, X-ray Line Emitting Objects (XLEOs), would be hard or impossible to find because their line emission is usually diluted within the typical broad energy interval of the X-ray images (a few keV). Even when detected also by “standard” techniques, as is the case of the three sources presented in this letter (the X-ray brightest candidates among those found from the test run analysis of 13 XMM-Newton images), these sources would remain indistinguishable (unless very bright) from the other thousands of serendipitous sources because of their very limited number of photons. None of the usual diagnostic diagrams (hardness ratios, Fx/Fopt, etc.) have the capability of clearly separating these sources from the multitude of generic serendipitous sources. Even an automated standard X-ray spectral analysis of a huge number of serendipitous sources will probably fail to identify them since the paucity of counts will force a rather large binning over the energy axis.
2 The method of analysis
The idea is based on the extension to the energy axis of the usual source detection techniques that are typically restricted to the spatial coordinates. The selected energy range (2.35.2 keV) implies that the sources discovered will have a redshift in the interval 0.31.7, when we consider that the most prominent X-ray line is typically the iron line. The energy range chosen minimizes variations in the effective area (there is a sharp change below 2 keV, due to the Au M edge). As a consequence no strong or sudden variations are expected in the background (cosmic + instrumental + source continuum) across the energy range considered. It will be interesting at some point to extend the line search to the largest possible range so as to sample from “local” to z objects.
A detailed discussion of the detection algorithm and of its performance will be given in Braito et al. (2005, in preparation). In the interest of clarity we briefly summarize here the basic properties of our search. Each XMM-Newton image (data cube), has been raster-scanned with a 3-D detection cell of eV. The step of the scan is half a cell width, in both the spatial axis and in the energy axis. At each X,Y position, counts in the energy range 2.15.4 keV are considered and binned in 200 eV bins. This range is one bin larger, on each side, than the range of interest for the line detection. The background level along the energy axis is then determined, after an iterative process to remove the possible presence of an excess due to a line, with a quadratic fit to the data. For the purpose of line detection, the source continuum, if present, is treated as background. Candidates XLEOs are then flagged if a particular energy bin in the range 2.35.2 keV contains a number of counts such that their probability of being a fluctuation of the estimated background level is smaller than .
3 Results from the test-run
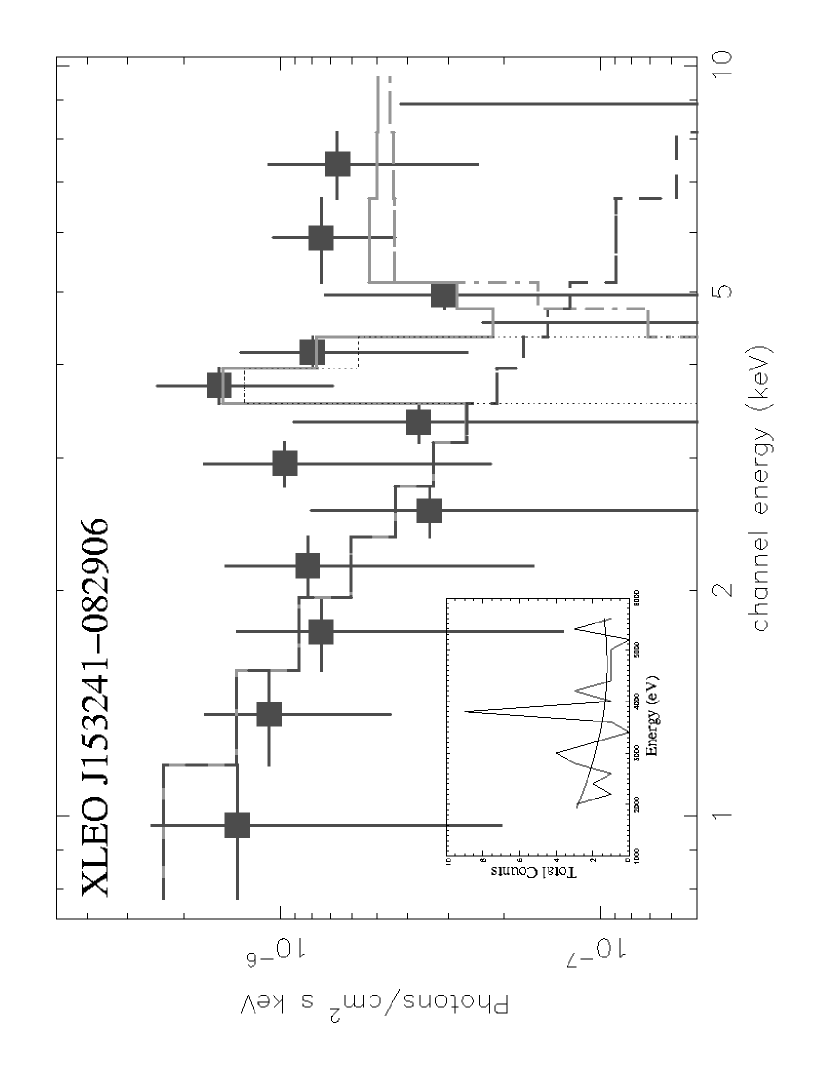
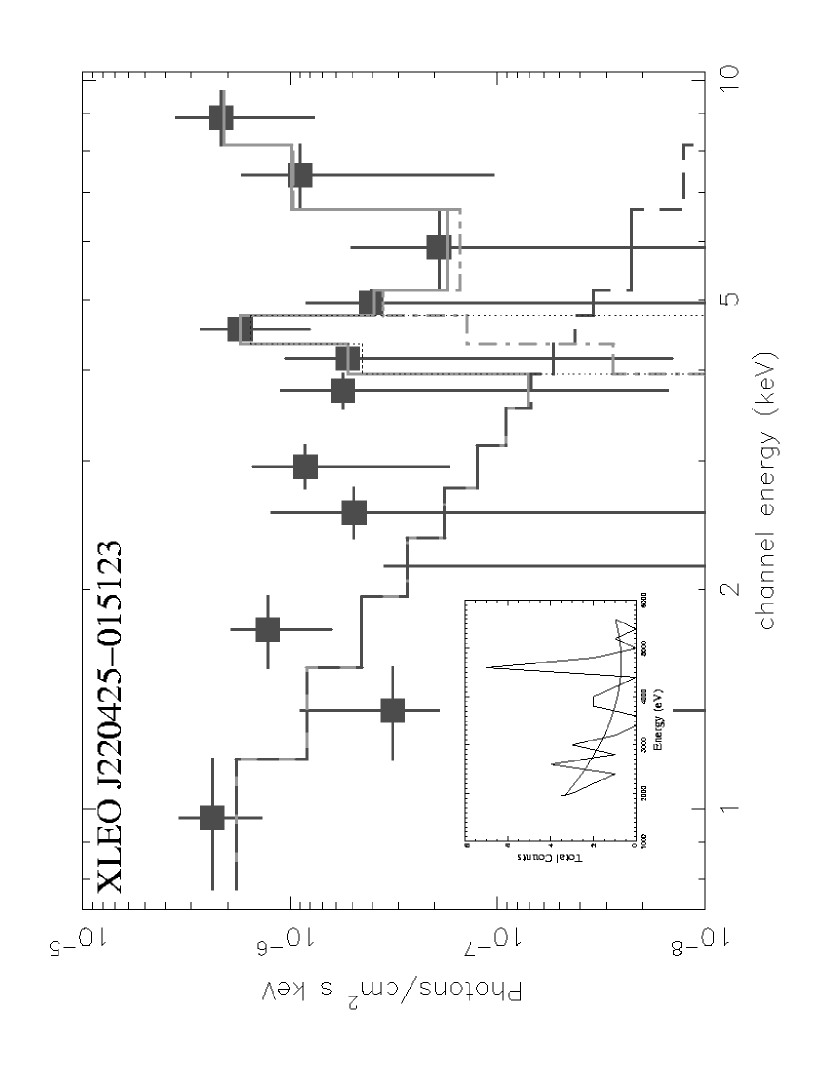
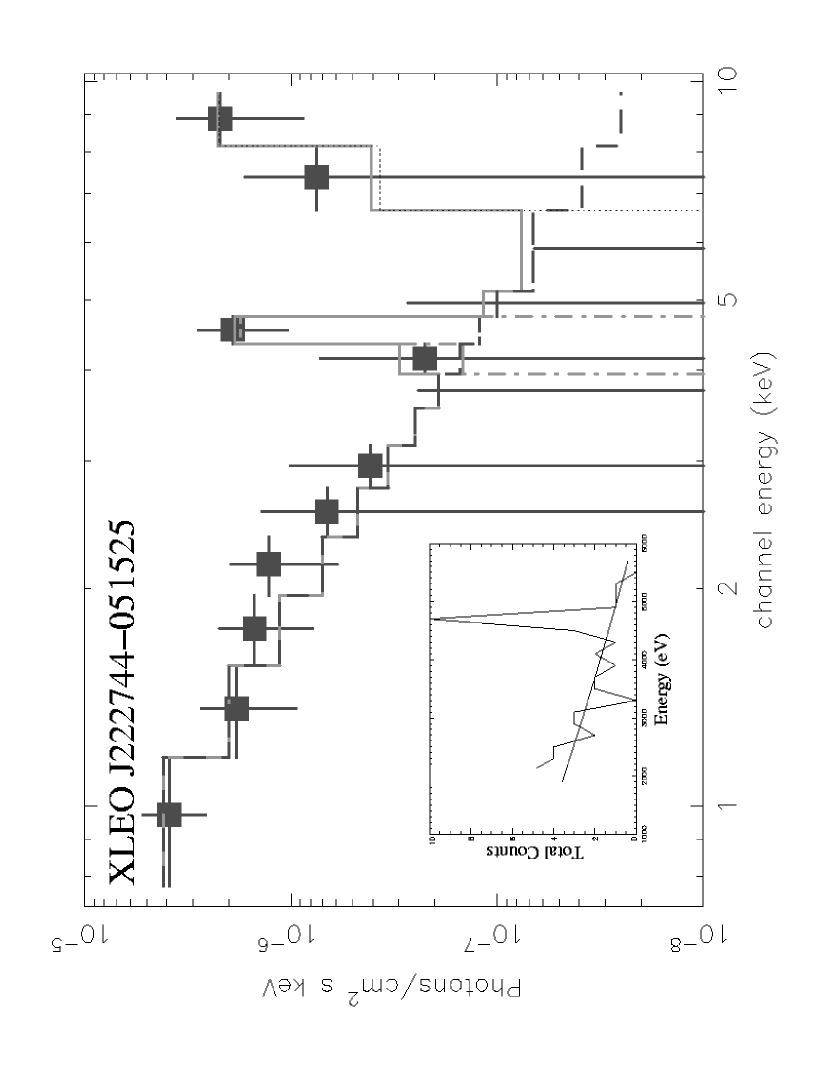
We have test-run the above algorithm on a small number of data sets, thirteen, in order to assess its success rate and to fine-tune the various critical parameters (e.g. cell size in both spatial and energy dimensions, background determination, threshold for XLEO candidate flagging, etc.). Only the Epic-pn data have been used. We have chosen the XMM-Newton test observations among those at high galactic latitude, with an exposure time in the range from s to s. Of the candidates found during the test-run, we present here the three most significant ones, which are also characterized by the highest continuum. The three candidates were flagged because of the detection of 9 counts in the energy bin 3.73.9 keV (1.4 counts expected), 7 counts in the bin 4.54.7 keV (0.7 counts expected) and 10 counts in the bin 4.64.8 keV (1.2 counts expected) respectively (see inset in Figure 1ac).
With respect to the statistical significance of the lines, we would like to stress the following. In the energy bin where the line is detected, the probability that the excess seen is a random noise fluctuation is , and for the three sources respectively. This is computed as the probability of observing 9, 7 and 10 counts (or more) when 1.4, 0.7, and 1.2 counts are expected. However, one should also consider the number of energy bins (14) and of the spatial cells searched. Although we have raster-scanned the whole image (but have ignored cells affected by gaps and edges), in analyzing the preliminary results of our search we have conservatively considered here only those XLEO candidates coincident with an X-ray source, unambiguously detected by other means (i.e. standard XMM Science Analysis System). Indeed these three sources were independently found by the standard detection algorithm used to produce the 1XMM source catalog (XMM-Newton SSC, 2003)111http://xmmssc-www.star.le.ac.uk/newpages/xcat_public.html and are listed there. Thus, given that there are sources in the set of images used at the brightness level considered, the number of trials is and the resulting total number of false detections expected is . Furthermore, we can adopt the X-ray positions reported in the 1XMM catalog since they are significantly better than those produced by our algorithm.
For all three sources, we did go back to the XMM-Newton data to extract the broad band spectrum, estimating the background from a nearby, source-free region. Apertures of 20′′ , 20′′ and 25′′ radius were used to extract the source counts, and of 23′′ (because of the closeness to an intra-chip gap), 40′′ and 50′′ radius for the background counts. When possible, (XLEOJ153241082906 and XLEOJ220425015123) data from the MOS detectors were also used in order to maximize the available statistics and have contributed to the determination of the values given in Table 1. In the interest of clarity, however, the MOS data have not been plotted in Figure 1.
Inspection of the distribution of the resulting net counts reveals a rather weak continuum, the possible emission line that prompted the detection, and an excess of counts at high energies. All three sources seem to be characterized by an X-ray spectrum consisting of a two component model: a “leaky absorbed” power law continuum plus an emission line. This is typical of absorbed AGN and thus suggests that these three sources are indeed AGN. Although this is not the first time that an AGN is recognized as such and classified directly from the X-ray data (e.g. AXJ2254+1146, Della Ceca et al., 2000), to our knowledge, it is the first time that this happens beyond the local universe.
In Figure 1 (a through c) we report the X-ray spectrum of the three sources and the distribution of the total counts (inset) in the 3-D cells, which has led to the line detection. From the position of the emission line, and assuming that it is due to cold Fe at 6.4 keV, it is possible to derive, directly from the X-ray data, the redshift of the sources. The values are reported in Table 1 where the basic X-ray properties of these three sources are summarized. We stress that the values derived should be considered as indicative given the very low statistics involved (the three sources have of the order of 50 net counts each in the Epic-pn detector). In the fitting procedure, we did not apply Occam’s razor, rather we have assumed a reasonable model (see above), and determined a set of values that well describe the data. This is why no formal errors are quoted on the derived quantities.
Inspection of deep optical material reveals the presence of 12 candidates consistent (on positional ground) with being the optical counterparts of the X-ray sources. Their magnitudes are in the range 22.023.5. Considering, for each X-ray source, the brightest candidate, the resulting log() are in the range . These values are typical of absorbed AGN (see, among others, Fiore et al. 2003 and Della Ceca et al. 2004) and thus further support our proposed identifications. Optical spectroscopy is of course needed to validate these results and has been proposed, together with follow up XMM-Newton observations.
4 Discussion
The results presented here are very preliminary. We have no doubts about the reality of the sources and we are confident on the presence of the X-ray emission line in the source spectra. Three objects are too few to derive “general properties”. Also, we still have to determine the complex visibility function of our novel algorithm, the volume investigated for a given line luminosity/EW, the sensitivity of our search as a function of the spectral characteristics of the sources (continuum slope, intrinsic NH, iron density etc.) and of their redshift. Once this is obtained and a larger sample is assembled, it will be possible to derive volume densities, population properties and more general conclusions.
This said, and with the caveat of the low statistics and un-quantified selection effects, we would like to note a few things:
1) all three objects found are most likely AGN in, or close to, the Compton thick regime. They have resulted from the analysis of 13 XMM-Newton observations. This initial success rate is very encouraging since quite a large sample can be readily assembled using the hundreds of suitable XMM-Newton observations already available from the ESA archive. If follow up studies confirm that the three objects found are indeed AGN absorbed by a column density of cm-2 and more, then we have a formidable tool to find and study these AGN, beyond the local universe and up to redshifts of cosmological relevance;
2) for the brightest XLEOs, characterized by a detectable continuum, it will be often possible to recognize the nature of the object and to determine its redshift directly from the X-ray data, especially in cases like the ones reported here of absorbed AGN;
3) the redshifts of the three objects found (0.64, 0.45, 0.42) are in the middle to low part of our window (0.3 ). To understand whether this is primarily due to selection effects or whether it reflects an intrinsic distribution, requires a detailed mapping of the visibility function of our algorithm;
4) no cluster has been found in this test run. It is not clear at this point whether this result is meaningful. A space density of clusters per sq. deg. (with z 0.3) and with an X-ray flux erg cm-2 s-1 (0.54.0 keV) has been reported (Andreon, 2004, private communication). It is not obvious, however, how this limiting flux compares with our detection threshold based on a line contrast, neither is known the fraction of clusters with a prominent (detectable) emission line. To attack this issue we plan to run our algorithm on a number of XMM-Newton observations known to contain high redshift clusters of galaxies.
To conclude, prompted by the power of the XMM-Newton mirror module plus Epic-pn detector we have developed a novel algorithm to search X-ray datacubes (X,Y,E) for X-ray Emission Line Objects. A test-run on a dozen XMM-Newton observations has proven this search extremely successful, yielding the discovery of three sources, most likely highly absorbed AGN ( cm-2), and allowing a crude, but direct, determination of their redshift from the detected X-ray line. If these findings are confirmed by a more extensive analysis and by follow up studies of the candidate objects, we have unlocked the doors to the long sought large sample of highly absorbed, Compton thick AGN, a key to the Cosmic X-Ray Background synthesis models. Also, it is possible that other rarer objects will be detected, as the volume searched increases.
References
- Della Ceca et al. (2004) Della Ceca, R., et al. 2004, A&A, in press
- Della Ceca et al. (2003) Della Ceca, R., et al. 2003, A&A, 406, 555
- Della Ceca et al. (2002) Della Ceca, R., et al. 2002, ApJ, 581, L9
- Della Ceca, Maccacaro, Rosati, & Braito (2000) Della Ceca, R., Maccacaro, T., Rosati, P., & Braito, V. 2000, A&A, 355, 121
- Fadda et al. (2002) Fadda, D., Flores, H., Hasinger, G., Franceschini, A., Altieri, B., Cesarsky, C. J., Elbaz, D., & Ferrando, P. 2002, A&A, 383, 838
- Krolik and Kallman, (1987) Krolik, J.H., & Kallman, T.R., 1987, ApJ, 320, L5
- Fiore et al. (2003) Fiore, F., et al. 2003, A&A, 409, 79
- Levenson et al. (2002) Levenson, N. A., Krolik, J. H., Życki, P. T., Heckman, T. M., Weaver, K. A., Awaki, H., & Terashima, Y. 2002, ApJ, 573, L81
- Maiolino et al. (2003) Maiolino, R., et al. 2003, MNRAS, 344, L59
- Mushotzky, Done, & Pounds (1993) Mushotzky, R. F., Done, C., & Pounds, K. A. 1993, ARA&A, 31, 717
- Nandra & Pounds (1994) Nandra, K. & Pounds, K. A. 1994, MNRAS, 268, 405
- Rosati et al. (1995) Rosati, P., Della Ceca, R., Burg, R., Norman, C., & Giacconi, R. 1995, ApJ, 445, L11
- Rosati, Della Ceca, Norman, & Giacconi (1998) Rosati, P., Della Ceca, R., Norman, C., & Giacconi, R. 1998, ApJ, 492, L21
- Rosati, Borgani, & Norman (2002) Rosati, P., Borgani, S., & Norman, C. 2002, ARA&A, 40, 539
- Rosati et al. (2004) Rosati, P., et al. 2004, AJ, 127, 230
- Severgnini et al. (2003) Severgnini, P., et al. 2003, A&A, 406, 483
- Vignali et al. (1999) Vignali, C., Comastri, A., Cappi, M., Palumbo, G. G. C., Matsuoka, M., & Kubo, H. 1999, ApJ, 516, 582
| Source name | X-ray position | Eline | EW | Flux | zx | ||
|---|---|---|---|---|---|---|---|
| J2000.0 | keV | keV | cm-2 | 210 keV | |||
| (1) | (2) | (3) | (4) | (5) | (6) | (7) | (8) |
| XLEOJ153241082906 | 15 32 40.6 08 29 03 | 3.9 | 5 | 0.64 | 1.9 | ||
| XLEOJ220425015123 | 22 04 24.9 01 51 28 | 4.4 | 5 | 0.45 | 2.7 | ||
| XLEOJ222744051525 | 22 27 44.3 05 15 24 | 4.5 | 7 | 0.42 | 2.4 |
Column (1): Source name; column (2): X-ray source position; column (3) line energy position; column (4) observed line equivalent width, computed with respect to the absorbed component; column (5): intrinsic absorbing column density; column (6): observed flux in erg cm-2 s-1; column (7): redshift estimated from the X-ray line position; column (8): photon index of the power law component.