Q0957+561 revised: CO emission from a disk at = 1.4††thanks: Based on observations carried out with the IRAM Plateau de Bure Interferometer. IRAM is supported by INSU/CNRS (France), MPG (Germany) and IGN (Spain).
Based on additional interferometric observations, we reanalysed the CO(2-1) and 3mm continuum emission of Q0957+561, a lensed QSO at a redshift of . The emission in the CO(2-1) lines reveals a gas-rich host galaxy with a peculiar double-peaked profile at one of the two lensed images. Our new interferometric CO maps of the host galaxy agree well with HST images obtained by Keeton et al. (2000) and we thus argue that the two velocity components arise from molecular gas in the disk of the host galaxy. We also present new model calculations, all in excellent agreement with recent time delay measurements and simulations.
Key Words.:
gravitational lensing – galaxies: kinematics and dynamics – quasars:individual Q0957+561 – galaxies: high redshift – galaxies: disk1 Introduction
Since the discovery of Q0957+561, the first confirmed gravitationally lensed quasar (Walsh et al. wals (1979)) at a redshift of , several models have been developed to understand the lensing potential of the intervening galaxies: a giant elliptical galaxy (G1) at a redshift of with a surrounding cluster and probably another group of background galaxies at (Angonin-Willaime et al. ango (1994); Chartas et al. char (1998)). Besides flux amplification, gravitational lensing helps also to improve spatial resolution as detailed by Kneib et al. (knei (1998)). Differential lensing effects which are detectable through the comparison of lensed images at different wavelengths indeed provide a powerful tool to probe the structure of a galaxy at a much higher resolution than possible with current millimeter interferometers. Planesas et al. (plan (1999), in the following P99) have succeeded in detecting the CO(2–1) line in the host galaxy around Q0957+561, but lacked a detailed lensing model to investigate the source of molecular emission. Keeton et al. (2000) have recently detected also the stellar component of the host galaxy showing differences in its distribution with respect to those of the gas obtained by P99.
To confirm and substantiate the weak line profiles previously detected by P99 and to eliminate the previous inconsistencies to Keeton et al. (2000), we have carried out new observations with the IRAM interferometer. To further improve on P99’s interpretation, we have developed a numerical code which incorporates existing lensing models of Q0957+561111We adopt a flat cosmology with =0.3, =0.7 and a Hubble constant of 65 km s-1Mpc-1..
2 Observations
CO(2-1) and (5-4) observations of Q0957+561 were made simultaneously
in 1998 and again in 2003 with the IRAM interferometer. The first
observation run is discussed in P99. We only give additional details
on the refined reduction of this data set.
Data taken in 1998: The
observations were carried out in the B, C and D configurations. The
bandwidth of the cross-correlator was set up to cover 420 MHz at both
frequencies with a spectral resolution of 2.5 MHz, equivalent to
7.8 km s-1 at 95.5 GHz (redshifted CO(2-1)) and 3.1 km s-1 at
238.7 GHz (CO(5-4)). The bandpass was calibrated on 3C273, 3C345 or
0923+392 while phase and amplitude calibrations were performed on
0917+624. Unlike P99, we discarded data from an entire observing run
that were substantially reducing the quality of the maps. We have also
corrected for the velocity scale which was wrong by a factor of 1.5 in
P99 due to a data header error.
Data taken in 2003: The observations were carried out in the C
and D configurations. The bandwidth of the cross-correlator was set up
to cover 580 MHz with a spectral resolution of 1.25 MHz
corresponding to 3.9 km s-1 at 95.5 GHz and 1.6 km s-1 at
238.7 GHz. We resampled the two data sets to a spectral resolution of
7.8 km s-1 (2.5 MHz) over the 420 MHz band covered by the first
observations to ensure uniform noise in the merged velocity
channels. 3C273, 0851+202 and 0420-014 were used as bandpass
calibrators while 0804+499 and 1044+719 were taken as phase and
amplitude calibrators. Relative to P99, the sensitivity of the
combined data sets is now higher by a factor of 2.
| CO(21) | Continuum at 3.1 mmb | |||||
| Ablue | Ared | Bblue | A | B | C | |
| Rel. positions (′′) | (1.9,3.8) | (1.6,6.1) | (0.2,1.1) | (1.45,5.00) | (0.24,1.0) | (3.23,7.13) |
| Position errors (′′)a | (+0.2,+0.2) | (+0.3,+0.3) | (+0.2,+0.2) | (+0.06,+0.08) | (+0.08,+0.10) | (+0.07,+0.08) |
| Flux density (mJy) | ||||||
| Peak fluxc (mJy/beam) | 0.90.2 | 2.10.2 | 2.20.2 | 4.60.2 | 3.30.2 | 5.10.2 |
| (1.10.3) | (1.70.3) | (2.30.3) | (4.20.3) | (2.50.3) | (5.50.3) | |
| FWHM (km s-1) | 28060 | 16020 | 28050 | |||
| Vel. at line peakd (km s-1) | 14030 | 34015 | 14023 | |||
| Integr. line flux (Jy km s-1) | 0.250.06 | 0.340.06 | 0.610.06 | |||
3 The data
3.1 Continuum emission
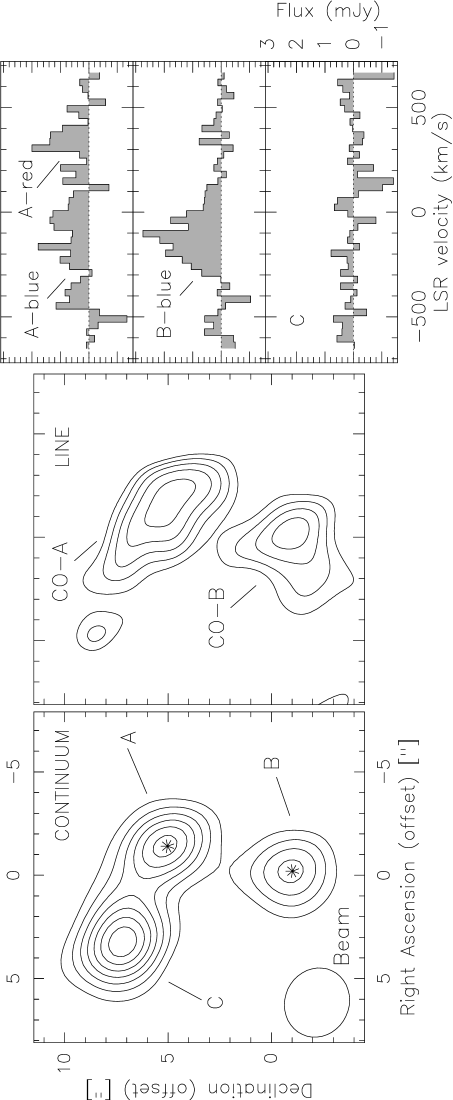
3.1 mm: The radio continuum was computed separately for the two data sets by averaging the line-free channels with a velo city lower than km s-1 and higher than km s-1. Two lensed images of the quasar, labeled A and B, and a radio jet C appear at this wavelength (Fig.1), in agreement with VLA observations (Harvanek et al. harv (1997)). The positions coincide with the optical ones within the errors (Tab. 1). Also in agreement with previous work, the A and B components are pointlike whereas the radio jet C component is slightly elongated (, PA 60∘) in the beam of the interferometer. Finally, there is no evidence for variability above 10% between May 1998 and April 2003 in all three components. This coincides with results obtained at 3.6cm with the VLA by Harvanek et al. (harv (1997)).
1.3 mm: A noise level of mJy was obtained in the 2003 data by averaging over the entire bandwidth available at 1.3mm. We find a 3.5 peak at the 3mm position of the A-continuum component, a 2 peak at the position of the B component and a peak at the position of C. The steep drop in flux density at 1.3 mm is consistent with the weakness of the synchrotron emission expected if we extrapolate to this short wavelength the spectral index of measured in the 20 mm (Harvanek et al 1997) to 3 mm (P99, and this paper) range. Any dust emission is either too weak or too extended (say ) to be detected at this frequency. Data from the 1998 run were not taken into consideration as they were much less sensitive.
3.2 Line emission
CO(2-1): To estimate flux densities in the CO(2-1) line (Tab. 1), the 3.1 mm continuum was first removed separately from each data set to account for possible low level continuum variability. Then, all data sets were combined to a single uv-table, and velocity channels in the km s-1 to km s-1 range was summed to produce an integrated line map (Fig.1). The resulting map shows two lensed images labeled COA and COB (P99). The emission centroids of the two images are separated by , about more than in the optical, radio and millimeter continuum (Tab. 1). The spectral profiles taken towards positions CO-A and CO-B are different. While a double-peaked profile is visible towards the northern image CO-A, a single blueshifted velocity component is detected towards CO-B. The shape of the blue components measured towards CO-A and CO-B is similar. The COF image reported by P99 could not be confirmed with the new observations.
CO(5-4): No significant line emission was detected at the position of COA and COB, the two line components detected at 3mm. A mJy () peak is only tentatively detected in the velocity integrated map ( km s-1 to km s-1) at the position of COB. The intensity of the COB component at 3mm over the same velocity range is estimated to be 1.8 mJy. Although uncertain because of the low signal to noise ratio of the (5-4) line, and possibly because of some residual continuum emission, we set an upper limit of on the velocity averaged intensity ratio CO(5-4)/CO(2-1) toward COB, the strongest of the two line components.
| SPLS e | SPEMD e | SPEMD+CL f | FGS e | FGSE e | FGSE+CL e | |
| Source Positions | ||||||
| (Source plane) | ||||||
| Radio continuum | ||||||
| (′′) a | (0.02,0.90) | (0.14,1.02) | (2.20,2.49) | (0.15,1.06) | (0.18,1.10) | (1.80,2.58) |
| Line emission | ||||||
| (′′) a | (0.23,0.95) | (0.32,1.00) | (1.93,2.39) | (0.38,1.05) | (0.40,1.05) | (1.54,2.47) |
| Lens properties | ||||||
| Galaxy: | ||||||
| (km s-1) | 400 | 400 | 360 | 300 | 340 | 320 |
| (′′) | 0.12 | 0.12 | 0.02 | 1.2 | 0.6 | 1.1 |
| 0.1 | 0.2 | 0.1 | 0.3 | |||
| (∘) b | 64 | 64 | 64 | 64 | ||
| 1.1 | 1.0 | 1.1 | ||||
| Cluster: | ||||||
| d | 0.3 | 0.2 | 0.4 | 0.3 | ||
| ( b | 60 | 60 | 60 | 60 | ||
| (km s-1) | 375 | 350 | ||||
| (′′) b | (13.7,6.9) | (13.7,6.9) | ||||
| Black hole: | ||||||
| () | 0.5 | 0.3 | 0.2 | |||
| [days] | 411 | 420 | 417 | 417 | 421 | 416 |
| [days] g | 421 | 450 | 412 | 423 | 454 | 414 |
| 5 | 4 | 4 | 3 | 3 | 3 | |
| 6 | 7 | 9 | 5 | 6 | 6 | |
| c | 3 | 2 | 2 | 3 | 2 | 2 |
| c | 3.0 (3.4) | 5.5 (40) | 1.5 (1.5) | 1.3 (1.2) | 5 (40) | 2.0 (2.5) |
4 Modelling Q0957+561
We developed a numerical code based on the standard gravitational lens equation (Schneider et al. schn (1992)) to explain the absence of the double-peaked line profile toward COB and to investigate the distribution and kinematics of the molecular gas around Q0957+561.
The code has been applied on 6 different models of Q0957+561 (Tab. 2), all based on previous work by Barkana et al. (bark (1999)) and Chae et al. (chae (1999)). The mass distributions of three models are based on King profiles, as proposed by Falco et al. (falc (1985) models: FGS, FGSE, FGSE+CL), the remaining three on a softened power-law distribution, as suggested by Grogin et al. (grog (1996)models: SPLS, SPEMD, SPEMD+CL). FGS and SPLS are spherical models where the effects of the surrounding cluster at are approximated by an external shear. FGSE and SPEMD models take into account the ellipticity in the lens galaxy, the remaining models use a single isothermal sphere (SIS) to model the lens properties of the cluster (SPEMD+CL, FGSE+CL). A point mass was added to the King profiles to account for a black hole in the center of the lens galaxy (Mediavilla et al. medi (2000); Barkana et al. bark (1999)), except for the softened power law models which implicitely cover this case. The group of background galaxies at has not been considered, however. The composite pseudo-Jaffe models by Keeton et al. (2000) have not been taken into account as they would not have provided further details for our analysis.
To find the set of parameters for each model reproducing our observations with the lowest , we first restricted the parameter space with simple assumptions based on the number of lensed images, separations among them etc. We then scanned the parameter space for each model to get the lowest and included the following constraints: relative positions of the A and B continuum components at 3.1mm with respect to the lens (4 constraints), relative positions of CO-A-blue and CO-B-blue (Tab.1), the continuum and line intensity ratios and the optical/radio time delay of 400-420 days from Kundic et al. (1997) and Haarsma et al. (1999). This results in a total of 11 constraints. For simplicity, compact fixed-size Gaussians were used to approximate the respective components. The so found best-fit models turned out to be in excellent agreement with simulations based on VLA and optical data (e.g. Barkana et al. bark (1999), Chae et al. chae (1999) and Keeton et al. 2000).
The SPEMD+CL, FGSE+CL and the FGS models reproduce the observed constraints with the lowest (; Tab. 2). Although the FGS model yields one of the best results, we do not favour spherical mass distributions because of the ellipticity of the lens (Bernstein et al. bern (1997)). The contribution of the cluster is also important: The models that best explain these observations all require an SIS cluster (FGSE+CL and SPEMD+CL, the latter has a lower )222For the following discussion, we will mainly use the best-fit FGSE+CL model since it provides the closest match to already published results, e.g. Keeton et al. (2000). However, both models are fully equivalent for argumentation purposes.. We note that the time delay derived from the same models are in rather good agreement with recent optical and radio measurements ( days; Kundic et al. 1997; Haarsma et al. 1999).
4.1 Line emission
In the following two subsections we discuss different approaches for modelling the blueshifted line emission based on the best-fit FGSE+CL potential and then explain the difference seen in the profiles toward COA and COB.


4.1.1 The blueshifted line
Let us first concentrate on the blueshifted line. We can propose two different scenarios for the origin of blueshifted line emission:
-
•
a compact or extended333Simulated by an elliptical Gaussian profile, i.e. a distribution which is symmetric with respect to its centroid. region centered on the nucleus,
-
•
a compact or extended region spatially not coincident with the nucleus.
The small line ratio A-blue/B-blue of already rules out a compact region centered on the nucleus, since it disagrees with the measured 3mm continuum ratio A/B of . Even if we account for a contribution of the jet in the A component and assume a lower ratio for the core emission at 3mm, we know from VLBI observations that the ratio A/B at the core is close to 1.3 (Garret et al. 1994). Thus, the continuum at 3mm and the blueshifted CO emission cannot originate from the same compact region (compare also Fig.2).
On the other hand, an extended line emitting region centered on the nucleus can indeed result in an A-blue/B-blue of 0.4. To constrain the size of the blueshifted region, we assumed an elliptical Gaussian profile and fitted the full widths at half maximum (FWHM) and the position angle (PA) depending on the continuum and line ratios between the lensed images. A best-fit (Fig.3) is obtained for a disk-like region, that is extended in the direction of the nuclear jet () and tiny in the direction perpendicular to the jet (, PA=20∘), with the south-western part of the disk crossing the inner tangential caustic of the lens. A priori, such a model produces multiple images (up to 5; compare also Keeton et al. 2000) that result in a stronger COB image.
Alternatively to the extended region centered on the nucleus, blueshifted emission from a rather compact region () close to the inner tangential caustic and slightly off ( to the south-west) the nuclear position is also consistent with a line ratio of (Fig.3). A symmetric extended region () at an off-nuclear position does not produce such a low A-blue/B-blue of 0.4.
Thus, an independent blueshifted emission must either originate in an extended region centered on the nucleus or in a compact region with a position close to the tangential caustic.
4.1.2 The redshifted line
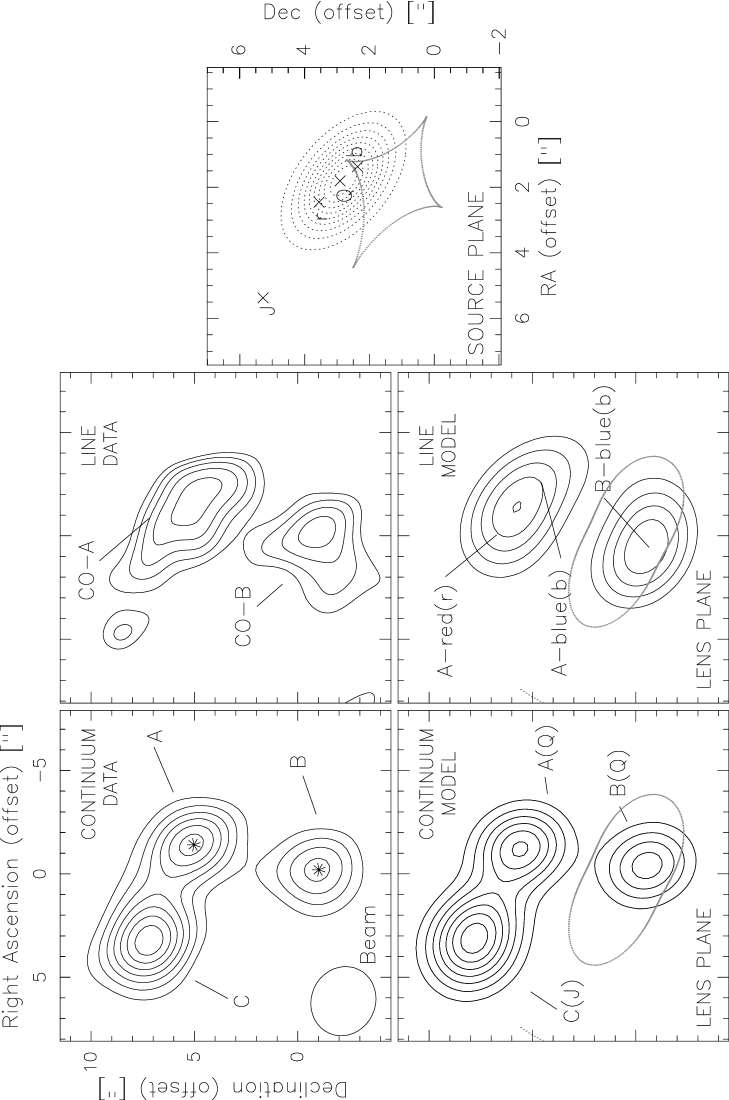
The difference in the line profiles observed toward COA and COB can be explained by the location of the redshifted gas component relative to the lens caustic. The best-fit simulation for the FGSE+CL model produces one tangential caustic (Fig.4). The radial caustic is at infinity. While the continuum and blueshifted line components remain close to the tangential caustic and are thus deflected into two distinct images, the redshifted component is already located too far off the caustic (to the north-east) to generate two lensed images. Thus, it appears that both blue- and redshifted gas become visible toward COA while blueshifted gas only can be detected toward COB. The unlensed separation between the centroids of the blue- and the redshifted components, corrected for magnification, are estimated to 1′′, or equivalently kpc at the distance of Q0957+561.
Likewise, an extended region centered on the nucleus where the north-eastern part corresponds to the redshifted component and the south-western part to the blueshifted one produces equivalent results (Fig.3). To obtain the derived line ratio (A-blue+A-red)/B-Blue , the size of the region has to be extended by about . This value seems to be independent of the lens potential even if we find that the SPEMD+CL model appears to favour slightly more elliptical profiles for the emission than the FGSE+CL model (cf. also Keeton et al. 2000). If we divide the lensed COA into a red- and blueshifted part and derive then the ratio between A-blue and B-blue, we again obtain a value of 444In contrast to Section 4.1.1, where we found that an extended blueshifted emission region would not result in an A-blue/B-blue ratio of 0.4 if symmetrically centered on a position closer to the tangential caustic, the extended emission region for the blueshifted part is not symmetric with respect to the position used there. This might explain why we nevertheless obtain such a low ratio for the blueshifted part alone..
The sensitivity is not sufficiently high to establish the absolute genuineness of the COA-blue component from the observations alone, but our best-fit FGSE+CL model of the host galaxy not only agrees with the Barkana model of Keeton et al. (2000), but a priori corroborates the detection of blueshifted CO gas in the direction of component A.
4.2 Radio continuum
The morphology and the intensity ratios of the radio continuum can easily be modelled. As already noted by Schneider et al. (schn (1992)), the radio jet J is lensed only once due to its location far off the caustic.

5 Discussion
The 3mm continuum observations of the redshifted double quasar Q0957+561 are in good agreement with observations at other wavelengths. While the 3mm continuum emission from the quasar is unresolved, emission from the radio lobes is extended along the direction of the jet. The CO(2-1) line, however, does not originate in the quasar. The difference in position, and therefore in the deflection, explains also the difference between the flux density ratios in the 3mm continuum (A/B i.e. like in the radio continuum) and in the line (COA/COB for the blue component), and accounts for different time delays for the CO(2-1) and the radio images. We note, however, that the time delay difference is only marginally significant (at most 520 light days, according to the models).
What can we conclude about the origin of the redshifted CO(2-1)
velocity component? P99 argued that it was either
originating from a companion galaxy, very close to Q0957+561 (see also
Papadopoulos et al. papa (2001)) or tracing the presence of molecular
gas in the rotating disk of the host galaxy. Our models discard the
first hypothesis. First, there has been no detection of such a
companion galaxy at other wavelengths, but the host galaxy, which has
already been revealed in HST observations by Keeton et
al. (keet (2000)), is oriented in the direction of the two line
components in COA and appears to be extended by
(Fig. 5). Furthermore, models for the gas emission in
the host galaxy that take the velocity profiles observed toward COA
and COB into account are similar in size and shape (see
Fig.4) to those invoked by Keeton et al. (2000). The
blue- and redshifted CO(2–1) emission appear to be very likely
connected to the stellar distribution of the host galaxy and thus
corroborate the results of Keeton et al. (2000), whereas models based
on a single blueshifted component favour a very thin, elongated disk
or a compact CO(2–1) emitting region slightly off the nuclear region,
and as such are rather in contrast with images of the host galaxy.
Moreover, the integrated line ratio (COA-red+COA-blue)/COB
is consistent with the ratio H-band-A/H-band-B1
derived by Keeton et al. (keet (2000)). This is what one would expect
if the profile of the gas distribution is very similar to the stellar
one. Also, the double-peaked line profile at COA which appears to
be symmetric and centered within the errors at is a
classical signature for rotation and therefore, provides further
support that the CO emission is associated with the host galaxy. By
the same arguments we are tempted to exclude also a recent galaxy
merger in Q0957+561, though this possibility cannot be ruled out
completely.
Based on these arguments, we favour P99’s second hypothesis: the presence of an important reservoir of molecular gas in the disk of the host galaxy surrounding Q0957+561.
According to the models the continuum is less magnified by a factor of 23 relative to the strongly lensed optical images () while the total magnification factor derived in the CO line varies between (FGSE+CL) and (SPEMD+CL). Based on the lower magnification, we have estimated an upper limit to the molecular gas mass for the integrated blue- and redshifted velocity profile in COA and COB. The FGSE+CL model corresponds to the higher COluminosity case and provides therefore a slightly higher molecular gas mass. Under the assumption that the brightness temperature of the (1-0) and (2-1) lines is the same, we adopt a CO to H2 conversion factor of (K km s-1pc based on a determination for the Milky Way (Solomon & Barrett solo91 (1991)). Clearly, the Milky Way and the Q0957+561 host galaxy are in different evolutionary stages and show different properties, so the adopted conversion factor is likely to be an overestimate (cf. Downes et al. 1993), and an upper limit for the molecular gas mass will be obtained. Based on the FGSE+CL magnification factor, we estimate Mgas=M(H2+He) for the blue profile and for the reddened profile ( for SPEMD+CL), giving an upper limit for the total gas mass of . We can also give a lower limit for the gas mass of MM⊙ assuming that the CO(1–0) line is optically thin (Solomon et al. solo97 (1997)). This relatively small difference of only a factor of 6 indicates that the standard conversion factor might nevertheless already give a reliable estimate of the gas mass in the host galaxy around Q0957+561. Assuming a radius of 10kpc and a velocity separation between both line profiles of km s-1, we find a dynamical mass of (not including inclination effects). This is about ten times higher than the derived gas mass consistent with what is found for other active galaxies (e.g. Evans et al. 2002, Sakamoto et al. 1999). The low upper limit on the velocity-averaged line intensity ratio, , favours the hypothesis of low excitation CO emitted mainly from the disk of the host galaxy. The agreement between molecular gas masses obtained with the integrated CO luminosities and individual magnification factors, each tracing line emission from half of the quasar host, is further support for the rotating disk hypothesis. If our assumptions are correct, the molecular gas in the disk cannot be very hot, but to our knowledge no sensitive observations in the ground and higher rotational CO transitions have been carried out yet to confirm this conclusion.
| COA-red | COA-blue | COB-blue | |
|---|---|---|---|
| a | |||
| (1010Kkm s-1pc2) | 0.80.3 | 0.80.2 | 1.80.2 |
| b | 1.5 | 1.7 | 4.3 |
| (1010 M⊙) | 2.71.0 | 2.40.6 | 2.30.6 |
| total gas mass | M⊙ | ||
6 Conclusions
Recent sensitive observations were combined with earlier data by Planesas et al (1999) to corroborate their original discovery of CO(2-1) line emission from Q0957+561. A numerical program was developed to analyse the properties of the lensed system, the results of which can be summarized as follows. While the region of blueshifted line emission is found to lie in between the two caustics, and is therefore deflected into two images, redshifted emission is found outside the caustics, and therefore results in a single lensed image. We further argue that both redshifted and blueshifted line emission originate from the same system: a disk with a molecular gas mass of M⊙ in the host galaxy in Q0957+561. Our results for the host galaxy are in excellent agreement with a previous optical work by Keeton et al. (2000). To our knowledge HR10 (Andreani et al. and (2000)) and Q0957+561 are the only systems at redshifts of in which CO emission was clearly detected, but in contrast to Q0957+561 where we have not yet been able to detect dust emission, HR10 is rich in dust and molecular gas. Although both systems are significantly different, they both independently give crucial insights into an epoch during which the bulk of stars of the present day Universe formed, and thus mark an important phase in galaxy evolution.
Acknowledgements.
We are grateful to the referee Jean-Paul Kneib for his valuable comments which have helped to improve the paper. We thank the PdB staff for help with the data reduction. MK acknowledges funding support by SFB grant 494. JMP has been partially supported by the Ministerio de Ciencia y Tecnologia under grant numbers ESP2002-01627 and AYA2002-10113-E. PP acknowledges partial support by the Spanish Ministerio de Ciencia y Tecnologia under grants ESP2002-01693, ESP2003-04957 and AYA2003-07584.References
- (1) Andreani, P., Cimatti, A., Loinard, L., 2000, A&A 354, L1
- (2) Angonin-Willaime, M.-C., Soucail, G., Vanderriest, C., 1994, A&A, 291, 411
- (3) Barkana, R., Lehár, J., Falco, E.E. et al., 1999, ApJ, 520, 479
- (4) Bernstein, G.M., Fischer, P., Tyson, J.A., Rhee G., 1997, AJ, 483, L79
- (5) Chae, K.-H., 1999, ApJ, 524, 582
- (6) Chartas, G., Chuss, D., Forman, W., Jones, C., Shapiro, I., 1998, ApJ, 504, 661
- (7) Downes, D., Solomon, P.M., 1998, ApJ 507, 615
- (8) Evans, S.A., Mazzarella, J.M., Surace, J.A. & Sanders, D.B. 2002, ApJ 580, 749
- (9) Falco, E.E., Gorenstein, M.V., Shapiro, I.I. 1985, ApJ, 289, L1 545, L113
- (10) Grogin, N.A., Narayan, R. 1996, ApJ, 464, 92
- (11) Harvanek, M., Stocke, J.T., Morse, J.A., Rhee, G., 1997, AJ, 114, 2240
- (12) Keeton, C.R., Falco, E.E., Impey, C.D., et al., 2000, ApJ 542, 74
- (13) Kneib, J-P., Alloin, D., Pelló, R., 1998, A&A, 339, L65
- (14) Kundic, T., Turner, E.L., Colley, E.N. et al., 1997, ApJ, 482, 75
- (15) Mediavilla, E., Serra-Ricart, M., Oscoz, A., et al., 2000, ApJ 531, 635
- (16) Papadopoulos, P., Ivison, R. et al., 2001, Nature 409, 58
- (17) Planesas, P., Martín-Pintado, J., Neri, R., Colina L., 1999, Science, 286, 2493 (P99)
- (18) Sakamoto, K., Okumura, S. K., Ishizuki, S., & Scoville, N.Z. 1999, ApJ 525, 691
- (19) Schneider, P., Ehlers, J., Falco, E.E., 1992,Gravitational lenses, New York, Springer
- (20) Solomon, P.M., Downes, D., Radford, S.J.E. & Barrett, J.W. 1997, ApJ 478, 144
- (21) Solomon, P. M. & Barrett, J. W. 1991, IAUS 146, 235
- (22) Walsh, D., Carswell, R.F., Weynman, R.J., 1979, Nature, 279, 381