11email: lara.baldacci,gisella.clementini@bo.astro.it 22institutetext: Dipartimento di Astronomia, Università di Bologna, via Ranzani 1, I-40127 Bologna, Italy 33institutetext: INAF - Osservatorio Astronomico di Padova, vicolo dell’Osservatorio 5, I-35122 Padova, Italy
33email: held@pd.astro.it 44institutetext: Institute for Astronomy, University of Hawaii, 2680 Woodlawn Drive, Honolulu, HI 96822, USA
44email: rizzi@ifa.hawaii.edu (present address)
Variable stars in the dwarf irregular galaxy NGC 6822 : the photometric catalogue††thanks: Based on data collected at the European Southern Observatory, proposal number 67.B-0557
Deep , time-series photometry obtained with the ESO Very Large Telescope has been used to identify variable stars in the dwarf irregular galaxy NGC 6822. We surveyed a 6.86.8 arcmin area of the galaxy and detected a total number of 390 candidate variables with the optimal image subtraction technique (Alard alard00 (2000)). Light curves on a magnitude scale were obtained for 262 of these variables. Differential flux light curves are available for the remaining sample. In this paper we present the photometric catalogue of calibrated light curves and time-series data, along with coordinates and classification of the candidate variables. A detailed description is provided of the procedures used to identify the variable stars and calibrate their differential flux light curves on a magnitude scale.
Key Words.:
Galaxies: individual (NGC 6822) – Galaxies: dwarf – Galaxies: irregular – Stars: variable – Local Group1 Introduction
The potential of variable stars in setting the astronomical distance scale and addressing the origin of stellar populations in galaxies is demonstrated by the increasing number of surveys devoted to this subject in several Local Group galaxies. In a previous paper (Clementini et al. gis03 (2003)) we reported the first discovery of RR Lyrae and other short-period variable stars in the dwarf irregular galaxy (dIrr) NGC 6822, based on deep time-series photometry obtained with the ESO Very Large Telescope (VLT). We derived a distance of =0.17 from the average luminosity of the RR Lyrae stars in NGC 6822 (Clementini et al. gis03 (2003)). This paper presents our reduction methods and provides coordinates and photometry of the candidate variable stars as well as the catalogue of available light curves. This study provides the first comprehensive account of the variable star content in NGC 6822, reaching the Horizontal Branch (HB) of the old population. Previous studies (Hubble Hu25 (1925), Kayser ka67 (1967), McAlary et al. McA83 (1983), Gallart et al. GAV96 (1996), Antonello et al. a02 (2002), Pietrzyński et al. Pie04 (2004)) only addressed brighter stars (Classical Cepheids, 22 mag), a few of which have been recovered in the present study. The properties of the variable stars and their implications for the stellar populations and star formation history of NGC 6822 will be analysed and discussed in a forthcoming paper (Held et al. ev04 (2004)).
In Sect. 2 and Sect. 3 we describe the acquisition, reduction, and absolute photometric calibration of the data. The procedures employed to detect variable star candidates with the optimal image subtraction method (ISIS 2.1, Alard alard00 (2000)) and to calibrate their differential flux light curves to a magnitude scale are described respectively in Sect. 4 and Sect. 5. In Sect. 6 we discuss the period search technique and the classification of the variables in types, and provide the photometric time-series data. In Sect. 7 we give a general description of the variable star characteristics and discuss their position on the Color Magnitude Diagram (CMD) of NGC 6822. The atlas of light curves for the different types of variable stars with good sampling of the light variation is presented in the Appendix.
2 Observations
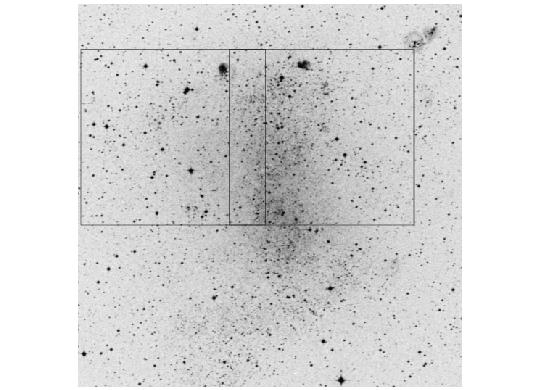
Observations of NGC 6822 were obtained in 3 half nights on Aug. 15, 16, and 20, 2001 using the focal reducer FORS1 on the ESO VLT/UT3 (Melipal) telescope at Cerro Paranal, Chile. All three nights were photometric and with good seeing conditions. The standard resolution collimator was used, yielding a arcmin field-of-view with a 2048 2048 pixel Textronix CCD having pixel scale 0.20 arcsec/pixel, read in 4-port mode without binning. Observations were obtained in the Johnson-Bessell ,, and filters (ESO Nos. 34, 35 and 37). We observed two fields covering a northern portion of the galaxy. Centers of the observed fields are , (field A) and , (field B), respectively. Field A is offset from regions of active star formation in NGC 6822, while Field B is located in a central region rich in young stars. Figure 1 shows a arcmin Digitized Sky Survey image of NGC 6822 with our two pointings outlined by rectangles. Standard star fields from Landolt (Landolt92 (1992)) were also observed in the three nights for photometric calibration.
In this paper we present the results for Field A, the only one for which , times-series data were obtained. These consist of 11 and 36 frames. Since the primary goal of our survey was the detection of the old stellar population in NGC 6822, if any, scheduling was devised so as to optimize the detection of variable stars of RR Lyrae type, and provide a good coverage of the light variation for their typical periodicities (i.e. periods between 0.2 and 0.8 days, with optimal efficiency for periods around 0.6 days). Exposure times of 900 s were adopted in both photometric bands, which represent the best compromise between signal-to-noise ratio and time resolution for RR Lyrae-like light curves. Table 1 provides the journal of observations along with a brief description of the observing conditions during the run.
| Observing date (UT) | HJD-2452100 | N.of Observations | Photom. cond. | Seeing | ||||||
|---|---|---|---|---|---|---|---|---|---|---|
| Field A | Field B | |||||||||
| arcsec | ||||||||||
| Aug. 15, 2001 | 37.494-37.673 | 4 | 11 | 1 | – | 1 | – | photometric | 0.5-0.8 | |
| Aug. 16, 2001 | 38.490-38.668 | 4 | 12 | – | 1 | – | 1 | photometric | 0.7-0.8 | |
| Aug. 20, 2001 | 42.496-42.680 | 3 | 13 | – | – | – | 1 | photometric | 0.6-1.0 | |
| Total | 11 | 36 | 1 | 1 | 1 | 2 | ||||
3 Reduction and photometric calibration
The FORS1 images were reduced in a standard way using the package XCCDRED in IRAF111IRAF is distributed by the National Optical Astronomical Observatories, which are operated by the Association of Universities for Research in Astronomy, Inc., under cooperative agreement with the National Science Foundation. The photometric reduction was carried out using the DAOPHOT and ALLFRAME packages (Stetson Stetson94 (1994)). A master object list was obtained from a stacked image by combining all the frames regardless of the filter. This was given as input to ALLFRAME for simultaneous PSF-fitting photometry of all the individual images.
Although our observing nights were photometric, an independent direct calibration could not be obtained because our standard stars were mostly saturated even with the shortest exposure times allowed by the instrument software. We therefore used the color terms and zero points provided by the FORS Web page to convert the instrumental ,, and magnitudes to the standard Johnson-Bessell system. The zero points were then refined using secondary standard stars in the target fields established with Wide Field Imager observations at the 2.2 m ESO/MPI telescope obtained on photometric nights and accurately calibrated onto the Landolt (Landolt92 (1992)) system.
The adopted calibration relations are:
| (1) |
| (2) |
The estimated uncertainty of the zero point calibration is 0.04 mag in both and .
4 Identification of the variable stars
Candidate variable stars were identified using the optimal image subtraction technique within the package ISIS 2.1 (Alard & Lupton alardlupton98 (1998), Alard alard00 (2000)). The package was run independently on the and time-series data. Images in each photometric band were aligned and re-mapped onto the same grid. and reference images were then constructed by stacking the 8 and the 4 frames with the best seeing. Each individual frame of the time series was subtracted from the corresponding reference image after convolution with a suitable kernel to match seeing variations and geometrical distortions on the individual images. The last step was photometry of the variable objects on the difference images, in terms of differential fluxes. The interested reader is referred to ISIS 2.1 tutorial (available at http://www2.iap.fr/users/alard/package.html) for a description of the relevant parameters and their meaning.
We excluded one of the frames from the ISIS 2.1 master list since it is affected by a bright ring produced by light of the guide star reflected by the telescope optics, which caused serious problems to ISIS 2.1 background fitting procedure. In conclusion, we have 11 and 35 points on the and light curves, respectively.
The output of ISIS 2.1 is a median image of all difference frames (known as “var.fits”), in which non-variable objects disappear and candidate variable stars stand out as bright peaks. Selection of the candidate variables on the “var.fits” frames was done by eye, excluding false detections due to CCD bad columns and hot pixels, satellite trails, and saturated objects. ISIS 2.1 automatically masks pixels with flux higher than a threshold defined by the parameter “saturation”. However, since ISIS 2.1 works on single pixels, only the very central pixels of the saturated stars are actually masked, while pixels around the saturated stellar core still appear on the “var.fits” image as a large number of false detections. Since defects of each image of the time series are reflected in the “var.fits” image, and because of the high percentage of saturated objects in our field, only about 10% of the detections turned out to be ”bona fide” candidate variables. After cleaning the preliminary output list, a search performed on the “var.fits” yielded a master list of 397 candidate variable stars. The same search on the “var.fits” yielded a master list of 286 objects, of which 236 are in common with the master list. The smaller number of candidate variables identified in the “var.fits” frame is probably due to (i) the fewer number of frames, (ii) the intrinsic faintness of the missing objects in the band, and (iii) the large reddening of NGC 6822 which affects the band more than the one. As a matter of fact, many of the candidate variables that were not counter-identified in the “var.fits” master list, have DAOPHOT/ALLFRAME measurements and turned out to be red stars at the tip of the red giant branch (RGB). There are also 50 candidate variables in the ISIS 2.1 master list that do not have counterpart in . Since the data-points in are insufficient by themselves to derive reliable light curves, these objects were not further analysed. The differential flux light curves were produced for each candidate variable star by running the ISIS 2.1 photometry task on the list of “bona fide” candidate variable stars. This provided differential flux light curves for 397 stars and light curves for 236 of them.
5 Calibration of light curves
As underlined in the previous section, ISIS 2.1 produces light curves on a differential flux scale. Yet, light curves on a magnitude scale, such as obtained by DAOPHOT/ALLFRAME, are needed to derive the amplitude of light variation, a defining parameter of pulsation.
On the other hand, the Image Subtraction Method implemented by ISIS 2.1 provides superior performances for detection of variable objects in crowded fields, and the differential flux measurements have usually lower internal error than PSF-fitting photometry. Combining the information coming from both of these powerful tools is of foremost importance.
Therefore, the candidate variable stars detected by ISIS 2.1 were counter-identified in the ALLFRAME , master catalogue to transform the differential flux light curves onto a magnitude scale and place the variables on the CMD of NGC 6822. The ISIS 2.1 coordinate system was matched to that of DAOPHOT/ALLFRAME to produce catalogues with unique identifying numbers and coordinates. At the end of the whole procedure we were able to match 302 of the objects flagged by ISIS 2.1 as variable sources in the “var.fits” frame, 204 of which have counterpart also on the “var.fits” frame.
The following step was to transform differential fluxes into (instrumental) magnitudes. According to the ISIS 2.1 tutorial, the differential fluxes can be transformed using the equation:
| (3) |
where the index runs on the time-series sequence; is the instrumental magnitude of the candidate variable star in each frame of the time-series; are the differential fluxes produced by ISIS 2.1; is the flux of the variable star in the reference image; and is a constant which depends on the photometric reduction package (in the case of DAOPHOT/ALLFRAME ). can be obtained from the following equation:
| (4) |
where is the instrumental magnitude of the star in the reference image scaled to the aperture used in ISIS 2.1 (the parameter “rad_aper” in the configuration file “phot.data”).
However, an application of Eqs. 3 and 4 to our data was not able to correctly reproduce the average magnitude and the amplitude of the DAOPHOT/ALLFRAME light curves for our candidate variables. Similar calibration inconsistencies were encountered by other users of the Image Subtraction Method (either ISIS 2.1 or revised versions of this package, as in Pigulski et al. pigulski03 (2003)).
Our procedure allows us to transform the differential fluxes into instrumental magnitudes by modelling each differential flux light curve onto that (in magnitudes) produced with fully calibrated ALLFRAME measurements. To properly reproduce both the average magnitude of the variable stars and the amplitude of their light curves, Eq. 3 has to be modified by adding two scaling parameters, and :
| (5) |
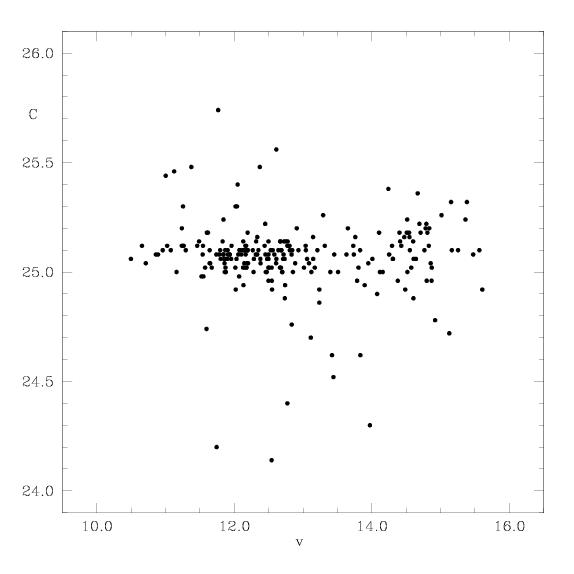
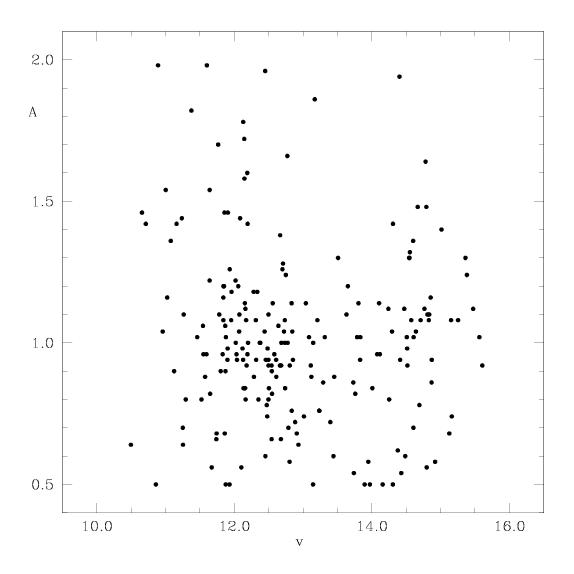
Note that the scale parameter affects the mean luminosity as well as the amplitude of the light curve. For and we re-obtain Eq. 3. Hereinafter . and are expected to have values close to 1 and 25, respectively. In our procedure we then make them vary in the range from to and from to by steps of 0.01. We then apply Eq. 5 to each data point on the ISIS 2.1 differential flux light curve and look for the and pair that, within the allowed range of values, minimizes the sum:
| (6) |
where the index runs on the time-series sequence (from 1 to 35 in and from 1 to 11 in ); are the ALLFRAME magnitudes of each variable star222Note that to account for variations in the photometric conditions and airmass of observation the ALLFRAME light curves of the variable stars are always differential with respect to a constant comparison star. The value in Eq. 6 are obtained from the differential values by adding the average ALLFRAME magnitude of the comparison star over the full time-series.; are the magnitudes calculated from the differential fluxes using Eq. 5; and is the number of acceptable points on the light curve (see below).
The possible presence of spurious data points in either or light curves may affect the minimization process. To remove bad data, an automatic cleaning procedure takes into account the photometric error of the ALLFRAME measurements and performs the rejection of all data points that do not satisfy the condition:
| (7) |
where the index runs on the time-series sequence, is the error associated to the ALLFRAME magnitude measurements ; and are the magnitudes calculated from the differential fluxes using Eq. 5. Since the number of points that satisfy Eq. 7 varies with the values of the and pairs, we only considered parameter pairs for which more than the 75% of light curve data points are retained. For the same reason the sum in Eq. 6 is also normalized to the number of acceptable points in the light curves, . The procedure was extensively tested on simulated time-series images of variable stars with characteristics similar to those detected in NGC 6822.
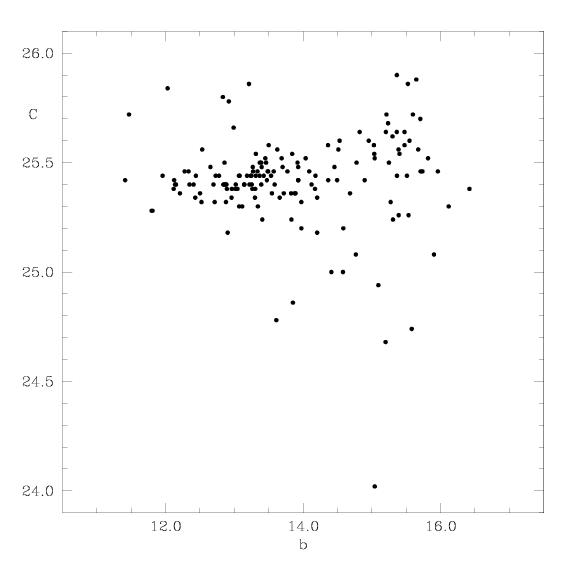
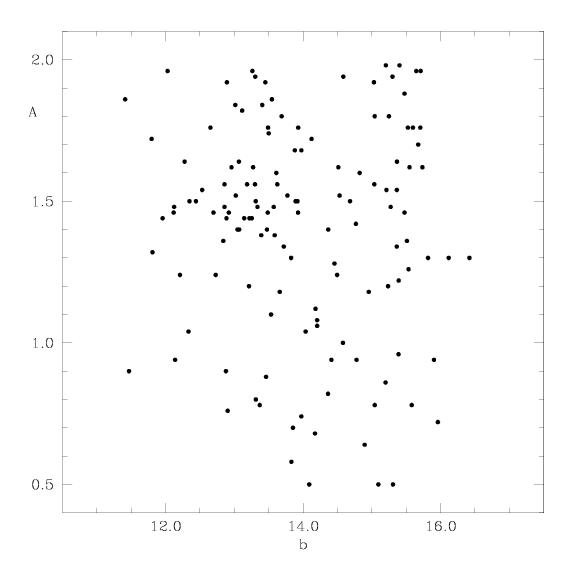
Figure 2 shows the run of the and values as a function of in the band (upper panels) and in the band (lower panels). The distribution of the parameter is quite sparse in both bands, while tends to be close to a mean value of about 25 in , the expected value, and generally higher in .
For candidate variables that were not measured on the reference images the differential fluxes were calibrated using as a reference the ALLFRAME average magnitudes, if available. For stars that were not identified on the “var.fits” master list produced by ISIS 2.1, we adopted the ALLFRAME light curves. At the end of the calibration process, out of the 397 candidate variable stars originally identified by ISIS 2.1 7 did not show significant variations and were discarded. Therefore the number of “bona-fide” variable star candidates is 390. Light curves on a magnitude scale were obtained in , for 262 objects, while only differential flux light curves were obtained for further 128 variables. The latter include candidate variable stars that were neither identified in the reference images nor recovered in the ALLFRAME master catalogue, along with objects for which we could not find a pair of and values satisfying Eq. 7 for the required minimum number of points on the light curve.
6 The “bona fide” variable stars
6.1 The catalogue
| IDr | ID | (2000) | (2000) | Type | Cross-id. | Notes | ||
| (mag) | (mag) | |||||||
| V1 | lc282 | 19:45:24.84 | -14:49:13.26 | 1 | ||||
| V2 | 1020 | 19:45:05.18 | -14:49:13.22 | 22.153 | 2.087 | RGBV | 3 | |
| V3 | 1140 | 19:45:18.23 | -14:49:12.95 | 21.402 | 2.092 | RGBV | 3 | |
| V4 | 1453 | 19:45:05.41 | -14:49:09.80 | 22.732 | 0.827 | CISV | ||
| V5 | lc208 | 19:45:25.38 | -14:49:09.10 | 1 | ||||
| V6 | 1753 | 19:45:02.95 | -14:49:07.48 | 22.694 | 2.485 | RGBV | 3 | |
| V7 | lc267 | 19:45:24.91 | -14:49:06.45 | 1 | ||||
| V8 | 2667 | 19:45:23.61 | -14:49:02.31 | 20.642 | 0.747 | CISV | cep047 | 6 |
| V9 | 2572 | 19:45:21.92 | -14:49:02.32 | 21.609 | 1.981 | RGBV | 3 | |
| V10 | 2739 | 19:45:12.23 | -14:49:01.81 | 22.230 | 2.252 | RGBV | 3 | |
| V11 | lc4682 | 19:45:02.74 | -14:48:59.95 | 1 | ||||
| V12 | lc4301 | 19:45:04.43 | -14:48:57.99 | 2 | ||||
| V13 | 3607 | 19:45:26.17 | -14:48:56.44 | 22.565 | 1.687 | RGBV | 3 | |
| V14 | 3766 | 19:45:19.55 | -14:48:56.51 | 21.547 | 1.855 | RGBV | 3 | |
| V16 | 3518 | 19:45:09.25 | -14:48:56.09 | 24.440 | 0.586 | CISV | 3 | |
| V17 | 4220 | 19:45:12.95 | -14:48:52.91 | 22.378 | 1.572 | RGBV | 3 | |
| V18 | lc1972 | 19:45:14.38 | -14:48:49.43 | 1 | ||||
| V19 | 4721 | 19:45:09.33 | -14:48:48.83 | 22.120 | 0.896 | CISV | ||
| V20 | lc1109 | 19:45:18.51 | -14:48:47.58 | 2-7 | ||||
| V21 | lc3116 | 19:45:09.78 | -14:48:47.52 | 2 | ||||
| V22 | 5365 | 19:45:09.89 | -14:48:45.64 | 22.311 | 0.145 | MSV | 6 | |
| V23 | lc1959 | 19:45:14.43 | -14:48:45.14 | 2 | ||||
| V24 | 5659 | 19:45:09.60 | -14:48:44.12 | 21.225 | 0.104 | MSV | ||
| V25 | 5780 | 19:45:15.04 | -14:48:43.72 | 21.730 | 1.015 | CISV | 3 | |
| V26 | 5921 | 19:45:11.73 | -14:48:42.49 | 21.596 | 2.011 | RGBV | 3 | |
| V27 | 6138 | 19:45:00.88 | -14:48:41.44 | 23.219 | 0.934 | CISV | ||
| V28 | 6555 | 19:45:06.47 | -14:48:39.12 | 23.968 | 0.762 | CISV | ||
| V29 | 6869 | 19:45:03.87 | -14:48:36.42 | 22.743 | 0.865 | CISV | ||
| V30 | lc1909 | 19:45:14.73 | -14:48:36.22 | 1 |
Table 2 is presented in its entirety in the electronic version of the Journal.
A portion is shown here for guidance regarding its form and content.
Notes.
1 - Differential flux light curve, only band available
2 - Differential flux light curves, both and bands available
3 - Not found on ISIS 2.1 “var.fits” frame, DAOPHOT/ALLFRAME light curve
4 - ISIS 2.1 light curves are very poor, we used the DAOPHOT/ALLFRAME light curves
5 - Not found on ISIS 2.1 “var.fits” frame, DAOPHOT/ALLFRAME light curve.
Not measured on the reference image, calibration performed using the DAOPHOT/ALLFRAME average magnitude.
6 - Not measured on the , reference images,
calibration performed using the DAOPHOT/ALLFRAME average magnitudes.
7 - Differential flux light curves calibrated according to the procedure described in Sect. 6.4
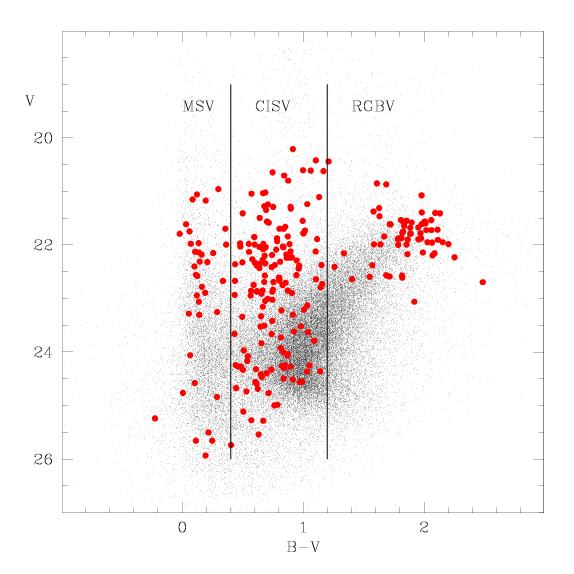
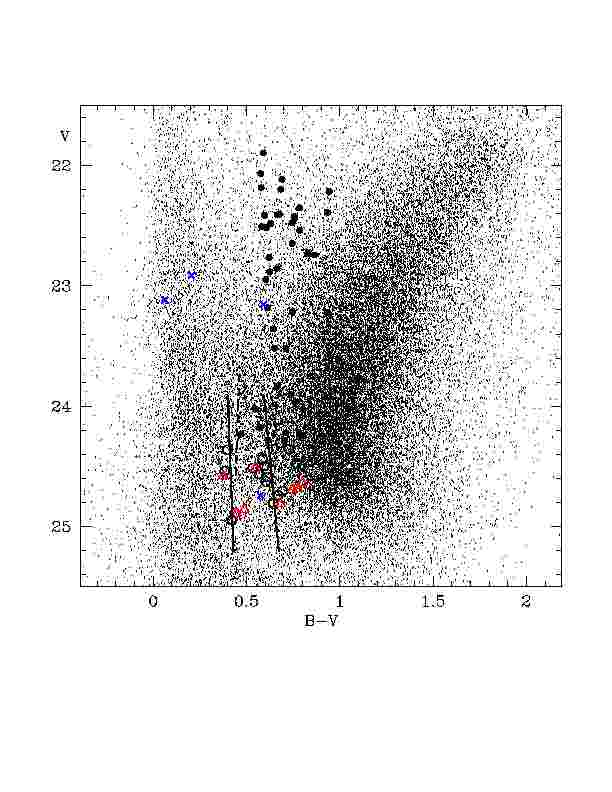
Coordinates for the “bona fide” variable stars (390 objects), are provided in Table 2, where in Col. 1 we give a running identifier (IDr) defined with the stars ordered by increasing declination; Col. 2 gives either the ISIS 2.1 “lc” number or the DAOPHOT/ALLFRAME ID depending on the available data; Col. 3 and 4 provide and coordinates (J2000.0); and Cols. 5 and 6 give the average magnitudes and colors for stars with calibrated light curves. For these stars, a coarse classification mainly based on the color and position on the color-magnitude Diagram is provided in Col. 7. We define Main Sequence Variables (MSV) all objects with , Classical Instability Strip Variables (CISV) stars with , and Red Giant Branch Variables (RGBV) objects with colors . These three groups contain 36, 160, and 66 variable stars, respectively. Finally, Col. 8 provides a cross-identification of the bright variables in common with Antonello et al. (a02 (2002)) and Pietrzyński et al. (Pie04 (2004)); and Col. 9 gives a flag indicating the type of available light curves, or the light curve calibration process (no flag indicates variables with light curves calibrated from ISIS 2.1 differential fluxes according to the general procedure described in Sect. 5). Figure 3 shows the location of the 262 variables with magnitude-calibrated light curves on the CMD of NGC 6822. The variables are plotted according to their average DAOPHOT/ALLFRAME magnitudes and are divided into the 3 above mentioned classes. The MSV sample is likely to contain: Cepheids, Scuti and SX Phoenicis stars and binary systems (see Sect. 7.2); RR Lyrae, Anomalous Cepheids (ACs), Population II Cepheids (W Virginis and BL Herculis stars) and Classical Cepheids ( Cepheids) would fall in the CISV sample (see Sect. 7.1); and the Miras, the Semiregular variables and the Small Amplitude Red Giants (SARGs) in the RGBV sample (see Sect. 7.3).
6.2 Period search and average properties
The light curves of the variable stars were studied using the program GRATIS (GRaphical Analyzer of TIme Series; see Clementini et al. gis00 (2000), and Di Fabrizio df99 (1999), for details). Using this program a first estimate of the period was obtained from the Lomb periodogram (Lomb lomb76 (1976), Scargle scargle82 (1982)); then we refined the period definition and determined the best fitting model of the star light variation using truncated Fourier series (Barning barning63 (1963)). Given the short time baseline of our observations (3 half nights spread over a total interval of 5 nights), good sampling of the light curves is achieved and periods can be reliably determined only for stars with periodicities shorter than 2-3 days. Moreover, although the study of period can be performed both for variables with light curves on magnitude scale and for stars with differential flux light curves, only for the former a full characterization of the light variation in terms of amplitude and average magnitude can be obtained, thus allowing us to locate the star on the CMD and classify it in type. For these reasons our efforts were mainly devoted to study the short-period variable stars with magnitude-calibrated light curves (see Sect. 6.3) and only for a few objects with promising time series differential fluxes an analysis of the differential flux light curves was attempted (Sect. 6.4).
6.3 Variable stars with light curves on a magnitude scale
Time series photometry on the magnitude scale is available for 262 of the variable stars detected in NGC 6822. The instrumental-magnitude light curves of each variable were calibrated to the standard , Johnson system by modelling the color variation along the star cycle with the GRATIS best-fitting Fourier algorithm and then using the calibration Eqs. 1, 2. The sampling of the data points, although sparser than that of the observations, was sufficient to constrain the color quite well. Individual , photometric measurements are provided in Table 3: for each star we give the running IDr, the DAOPHOT/ISIS 2.1 identification number, the variable type (when a classification was possible), the Heliocentric Julian Day (HJD) of the observations and the corresponding , magnitudes.
| Variable star 27 ID 6138 Cepheid | |||
| HJD | HJD | ||
| (2452100) | (mag) | (2452100) | (mag) |
| 37.5107 | 23.875 | 37.4995 | 23.060 |
| 37.5663 | 23.755 | 37.5218 | 23.019 |
| 37.6216 | 23.804 | 37.5441 | 22.994 |
| 37.6566 | 23.923 | 37.5552 | 22.936 |
| 38.5058 | 24.666 | 37.5774 | 22.899 |
| 38.5612 | 24.531 | 37.5884 | 22.857 |
| 38.6166 | 24.487 | 37.5995 | 22.853 |
| 38.6513 | 24.375 | 37.6105 | 22.851 |
| 42.5119 | 24.425 | 37.6345 | 23.038 |
| 42.5855 | 24.472 | 37.6455 | 23.044 |
| 42.6632 | 24.367 | 37.6678 | 23.043 |
A portion of Table 3 is shown here for guidance regarding its form and content. The entire catalogue of time series data is available upon request from the authors.
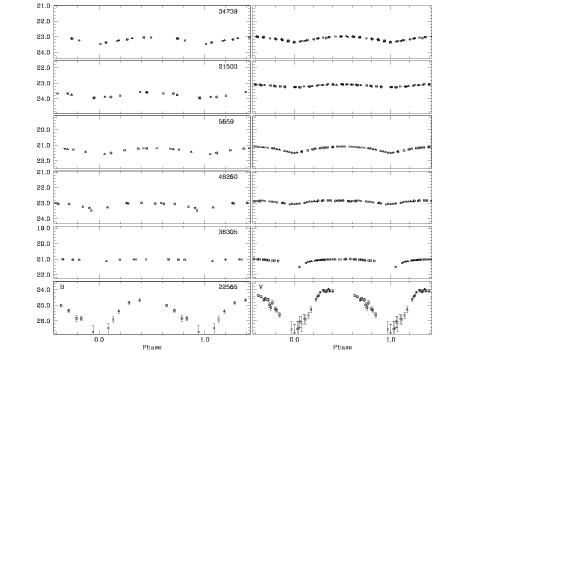
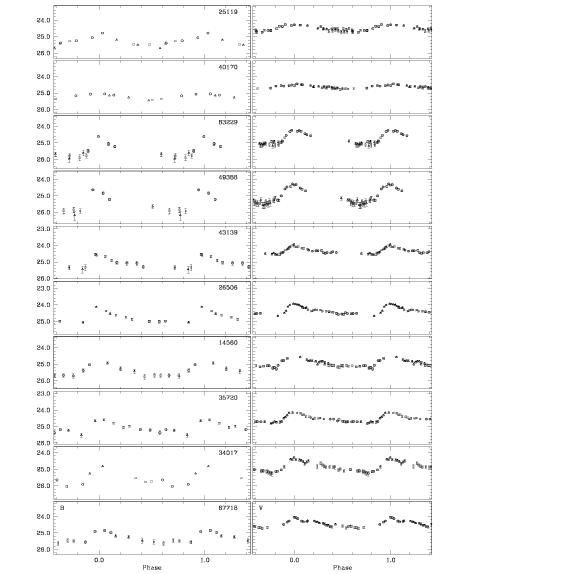
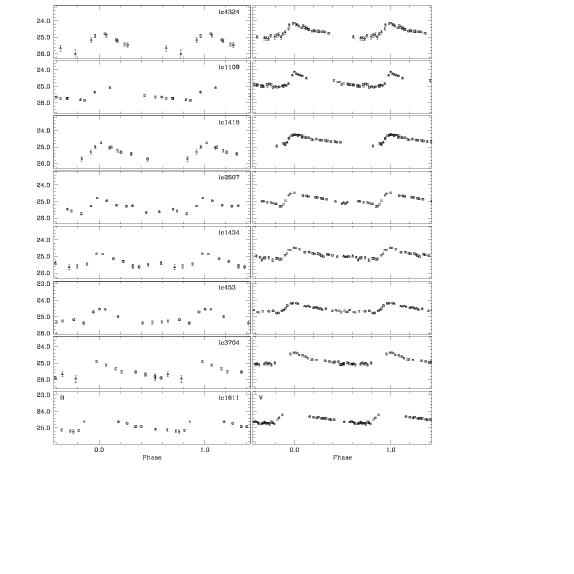
Evenly sampled light curves enabling a reliable estimate of the period are available for 69 of the variable stars in this sample. As expected from our observing strategy, they almost entirely belong to the CISV class and include: 18 RR Lyrae stars (16 , 2 type), 45 Cepheids and 6 Binaries. We add to this number further 8 RR Lyrae variable stars with differential flux light curves approximately calibrated onto a magnitude scale using the procedure outlined in Sect. 6.4. Best fitting models based on GRATIS truncated Fourier series algorithm were computed for all these variables with a number of harmonic varying from 1 to 5. Mean magnitudes computed as intensity-averaged means over the full variation cycle, and amplitudes of the light variation (computed as the difference between maximum and minimum of the best fitting model) were derived from the light curves. The results are provided in Tables 4, 5, 6, for RR Lyrae stars, Cepheids and eclipsing binaries, respectively. In these tables, Col. 1 is the running identifier (IDr), Col. 2 is the DAOPHOT/ALLFRAME or the ISIS 2.1 ID; Col. 3 gives the variable type, with ab and c for fundamental and first overtone RR Lyrae stars, respectively; C for Cepheids (including Anomalous, Low Luminosity and Classical Cepheids, see Sect. 7.1), and EB for the eclipsing binary systems. Columns 4 and 5 provide periods and epochs (corresponding to the HJD of maximum light for the pulsating variables, and to the deeper minimum light for the binaries). Column 6 gives the numbers of data-points available on the curves; Cols. 7 and 8 are the intensity-averaged mean magnitudes, Cols. 9 and 10 the corresponding amplitudes; Cols. 11 and 12 provide the residuals with respect to light curves obtained from GRATIS best fitting models, and finally remarks on individual objects are given in Col. 13. An atlas of light curves for this subsample of 69 variable stars is provided in the Appendix.
6.4 Variable stars with light curves in differential flux
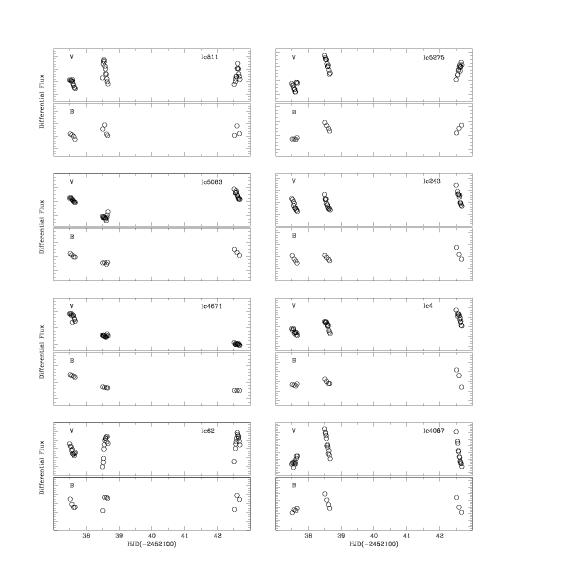
Among our sample of “bona fide” variable stars, 128 objects only have differential flux light curves, either because they lack reliable DAOPHOT/ALLFRAME time series photometry, or because we could not measure their magnitudes on the references images. These objects represent about 1/3 of our sample. Some of these variables are located near bright and/or saturated objects, or are close to the edges of the frames, hence they could not be reliably measured by DAOPHOT/ALLFRAME. However, their vast majority does not have reliable DAOPHOT/ALLFRAME magnitudes because of the severe crowding conditions in our field and possibly because they are very faint, hence close the detection limit of our photometry. Examples of light curves (in differential flux vs. HJD of observation) for some of these objects are shown in Fig. 4.
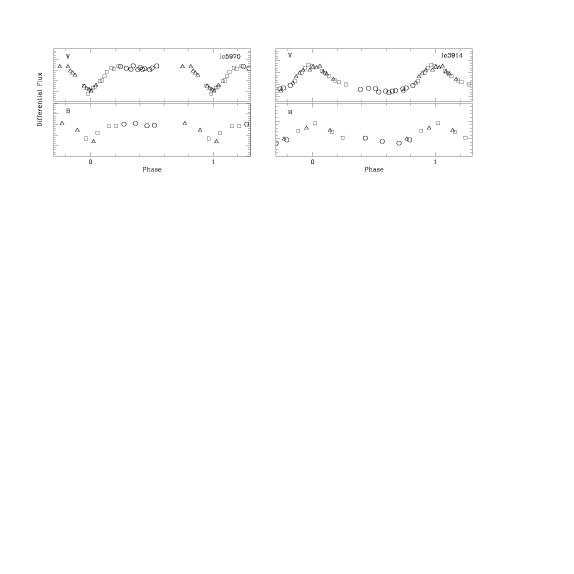
We ran GRATIS on the differential flux time series of some of these objects and were able to determine periods for 10 of them: star lc5970 was found to be a binary system with period =0.588 days (see Fig. 5, left panel). Other 9 objects have light curves and periods consistent with variables of RR Lyrae type (8 type RR Lyraes and 1 possible type RR Lyrae star, see right panel of Fig. 5).
Since the faintest variables measured in NGC 6822 with DAOPHOT/ALLFRAME are RR Lyrae stars, we have attempted a magnitude calibration of the differential flux light curves of these 9 objects under the assumption that they are indeed RR Lyrae stars. By assuming as their reference magnitude the mean magnitude of the RR Lyrae stars in NGC 6822, and using as template amplitudes those of the NGC 6822 RR Lyrae stars with similar periods, we were able to calibrate the light curves of 8 of these stars with acceptable pairs of and values. Instead, this procedure failed with the RRc-like variable, very likely because this is not an RR Lyrae star. The light curves obtained for these 8 candidate ab-type RR Lyrae stars from this approximate calibration to a magnitude scale are shown in Fig. 9, while their average quantities are listed in the bottom part of Table 4.
7 Classification of variable stars in NGC 6822
Along with the coarse classification in Sect. 6 and Fig. 3, as an aid to classify the confirmed variable stars in NGC 6822, we have plotted on the galaxy CMD the location of the subsample of 69 variables with calibrated light curves and good phase coverage (Fig. 6). Variable stars are plotted according to their intensity-averaged mean magnitudes and colors. For comparison, we also show in Fig. 6 the edges of the RR Lyrae instability strip of the globular cluster M 3 (Corwin & Carney cc01 (2001)), shifted to the reddening and distance modulus appropriate for NGC 6822 (solid lines; see also Clementini et al. gis03 (2003)). The short-dashed lines represent the boundaries of the theoretical pulsational instability strip for 1.5 models from Bono et al. (bo97 (1997)), transformed to the observational plane using the model atmospheres of Castelli, Gratton, & Kurucz (cgk97 (1997)). As already noted the variables shown in Fig. 6 almost entirely belong to the class of the classical instability strip pulsating variables (CISV).
7.1 The Classical Instability Strip Variables - CISV
The CISV sample includes a total of 160 variables. We have classified and determined periods for 65 of them (among which we found 2 binary systems), i.e. for about 60% of the variables fainter than mag (hence with shorter period) in this group. There are 18 confirmed plus 8 likely RR Lyrae stars in this sample. Basic information and average properties for these stars are summarized in Table 4, while their light curves are shown in Figs. 8 and 9 in the Appendix. Out of these 18 RR Lyrae stars, 10 fall within the edges of the instability strip of M 3. Their average magnitude is mag, where the error is the standard deviation of the data. The average period of the total sample of 24 ab-type RR Lyrae stars is days, and days if the 8 additional RRab’s are discarded. These revised values are consistent with those published in Clementini et al. (gis03 (2003)).
Eight of the RR Lyrae variables lie outside the edges of the M3 instability strip, two on the blue and six on the red side of the strip (see Fig. 6). All these stars have been flagged in Table 4. Stars #26506 and 62059 are marginally bluer than the blue edge, the former being also slightly overluminous. The rather blue color of #62059 is probably caused by the poor sampling of its light curves. Out of the six RR Lyraes redder than the red edge of the strip, two are also slightly overluminous in . The amplitudes of some of them are also too small compared to the amplitudes. A number of these variables could be blended with red giant stars unresolved in the band. In their study of RR Lyrae stars in the LMC, Di Fabrizio et al. (df04 (2004)) discuss in detail the effects of blending RR Lyrae variable stars with main sequence and red giant stars (Sect. 3.2 of that paper). The amplitudes of the light variation is reduced, and the variable star becomes redder/bluer depending on the color of the blending star, and overluminous by an amount depending again on the magnitude of the blending star. Crowding in our NGC 6822 field is very high, hence blending is a very plausible cause of the too red/blue colors of the RR Lyrae stars falling outside the instability strip. A further explanation of the red color of RR Lyrae stars is the existence of internal differential reddening in NGC 6822. For instance, the two faintest RR Lyrae stars lying slightly outside the strip (stars #42860 and #13845) can be easily brought inside the strip by assuming a moderate differential reddening, 0.02-0.03 mag. This amount of differential reddening is perfectly consistent with the variations in the internal extinction inferred from the 60m emission measured in NGC 6822 by the IRAS satellite (Rice ri93 (1993)).
The CMD in Fig. 6 shows an almost continuous distribution of variable stars with periods in the range from to days, filling the region of the diagram above the HB, beginning just about 0.3 mag up to 2.7 mag brighter than the average luminosity level of the RR Lyrae stars, and with increasingly redder mean colors. The basic properties of these stars are summarized in Table 5, while their light curves are shown in Fig. 10. Clementini et al. (gis03 (2003)) indicated the 20 variables with mean magnitude in the range 23.024.3 as Low Luminosity Cepheids (LL-Cepheids). These stars, flagged as LL-C in Table 5, are characterized by small amplitudes (0.1 0.8 mag), short periods overlapping with the period distribution of the RR Lyrae stars, and luminosities from only a few tenths to about 1.6 mag brighter than the average magnitude of the RR Lyraes. The properties of the LL-Cepheids are discussed more in detail in Held et al. (ev04 (2004)) – we only note here that their characteristics are consistent with the theoretical predictions for Anomalous Cepheids by Bono et al. (bo97 (1997)) and with the more recent theoretical pulsation models by Marconi, Fiorentino, & Caputo (mfc04 (2004)).
Brighter than the LL-Cepheids ( 23 mag) we find the vast majority of longer period Cepheids (25 stars). The average magnitudes and colors of these variables are in good agreement with the theoretical strip found for the SMC short-period Cepheids with and masses in the range (M. Marconi 2004, private communication), once shifted to the average reddening and distance modulus adopted for NGC 6822.
Among the LL Cepheids there are 3 objects (labelled with a double “r” in Table 5) with very red colors ( mag), that fall largely outside the theoretical instability strip for Anomalous Cepheids. They all lie either in very crowded areas near the centre of NGC 6822 or close to active star formation zones. Other 11 variables among the LL and Classical Cepheids are found slightly outside the red edges of their respective instability strips (they are flagged with a single “r” in Table 5). As for the RR Lyrae stars, several of them lie in regions of NGC 6822 probably affected by differential reddening, in a few other cases they could be unresolved blends, as indicated by the high value of the shape parameter SHARP in DAOPHOT/ALLFRAME/ photometry.
Finally, we note that two of our brighter candidate variables with only partial coverage of the light curves, namely stars #16070 and 22796, correspond to the Classical Cepheids V3186 and V3736 in Antonello et al. (a02 (2002)) and to cep061 and cep025 in Pietrzyński et al. (Pie04 (2004)), for which both authors find periods of and days, respectively. We have further 11 bright variables in common with Pietrzyński et al. (Pie04 (2004)) all classified Classical Cepheids by these authors, 9 classified Classical Cepheids, one MSV (V78) and one RGBV (V150) for us. The cross-identification of V150 with cep052 in Pietrzyński et al. list is doubtful; also uncertain is that of their cep036 (see column 8 of Table2).
7.2 The Main Sequence Variables - MSV
The MSV sample contains 36 variable stars. In this region of the CMD we expect to find binary systems, Cepheids, Be stars, slowly-pulsating B variables (SPB), Scuti and SX Phoenicis variables (see Sterken & Jaschek sj96 (1996) for a description of the characteristics of these different types of variables). The Scuti and SX Phoenicis stars are generally found below the Horizontal Branch from luminositites 3.0 mag to 0.5 mag (Breger bre00 (2000)), corresponding to 24.5 mag in NGC 6822. Hence, they are generally below our detection limit. Indeed, we only have a few MS candidate variables fainter than 24 mag, some of which have large amplitudes, but also have very large errors.
Cepheids, Be stars and SPB variables share approximately the same area on the main sequence, at luminositites from 1.5 mag to 4.5 mag (Pigulski & Kolaczkowski pk02 (2002)), roughly corresponding to mag in NGC 6822. This is the region where many of our MS variables have been found. No such variable stars were known in external galaxies until the recent discovery of many candidate Cepheids in the Large Magellanic Cloud (LMC, Pigulski & Kolaczkowski pk02 (2002), Kolaczkowski & Pigulski kp04 (2004)). Their typical periods are 0.3 days. Their amplitudes are very small: 0.1 mag, and often of the order of a few hundredths of magnitudes (Pigulski & Kolaczkowski pk02 (2002)). The Be stars have longer periods in the range days and amplitudes mag. Finally, the SPB variables have days, and mag. Among these types of variables, only those with longer period and/or larger amplitude can be detected at the distance of NGC 6822. However, if they are present in our MSV sample, the short time interval covered by our observations makes their identification very difficult. Indeed, the vast majority of our MS variables have light curves recalling those of eclipsing binary systems. However, the phase coverage is too small and our period definition for these stars is strongly limited by alias problems. Light curves for the few (4) MS eclipsing binaries for which we were able to determine reliable periods are shown in Fig. 11.
7.3 The Red Giant Branch Variables - RGBV
ISIS 2.1 detected 66 candidate variables lying around the tip of the RGB of NGC 6822 (see Fig. 3). These stars are likely Miras, Semiregular variables, and Small Amplitude Red Giants (SARGs) as those recently discovered in large numbers in the Galactic Bulge (Wray, Eyer & Paczyński wep04 (2004)) and in the Magellanic Clouds (Wood et al. w99 (1999), Soszyński et al. sosz04 (2004)).
We were not able to determine periodicities for any of these variables, since the time interval spanned by our observations is too short to monitor their long term variations. In fact, expected periods are , , and days, for the Miras, the Semiregular and the SARG variables, respectively. However, thanks to the capability of the image subtraction technique we were able to detect the irregular, small amplitude ( mag), short time scale variations of these objects, in particular of some SARG variables. Some examples of time series data for the RGB variables are shown in Fig. 7.

| IDr | ID | Type | Epoch | Notes | ||||||||
|---|---|---|---|---|---|---|---|---|---|---|---|---|
| (days) | (2452000) | (,) | (mag) | (mag) | (mag) | (mag) | (mag) | (mag) | ||||
| V141 | 25119 | c | 0.369 | 137.6455 | 11,34 | 25.245 | 24.476 | 0.639 | 0.399 | 0.098 | 0.065 | r |
| V228 | 40170 | c | 0.406 | 137.6000 | 9,31 | 25.228 | 24.625 | 0.364 | 0.228 | 0.037 | ||
| V367 | 63229 | ab | 0.575 | 136.9956 | 10,30 | 25.398 | 24.705 | 1.228 | 0.875 | 0.064 | ||
| V283 | 49388 | ab | 0.577 | 136.4454 | 8,34 | 25.367 | 24.945 | 1.509 | 1.152 | 0.098 | ||
| V241 | 43139 | ab | 0.585 | 136.8274 | 11,33 | 25.082 | 24.355 | 1.013 | 0.529 | 0.033 | 0.034 | r,o |
| V152 | 26506 | ab | 0.591 | 136.6950 | 10,35 | 24.759 | 24.362 | 1.213 | 0.771 | 0.033 | b,o | |
| V77 | 14560 | ab | 0.594 | 136.5229 | 10,35 | 25.327 | 24.889 | 0.998 | 0.776 | 0.058 | ||
| V210 | 35720 | ab | 0.601 | 136.6751 | 11,35 | 25.046 | 24.512 | 1.012 | 0.667 | 0.042 | 0.036 | |
| V200 | 34017 | ab | 0.602 | 136.5471 | 8,32 | 25.452 | 24.809 | 1.477 | 0.860 | 0.054 | ||
| V394 | 67718 | ab | 0.603 | 136.3825 | 11,30 | 25.290 | 24.462 | 0.889 | 0.662 | 0.022 | 0.044 | r |
| V332 | 57462 | ab | 0.605 | 136.0641 | 10,30 | 25.198 | 24.587 | 1.151 | 0.812 | 0.039 | ||
| V373 | 64629 | ab | 0.606 | 137.3141 | 9,29 | 25.092 | 24.496 | 0.723 | 0.569 | 0.025 | ||
| V239 | 42860 | ab | 0.608 | 136.7378 | 10,34 | 25.406 | 24.738 | 0.728 | 0.721 | 0.040 | r | |
| V244 | 43785 | ab | 0.618 | 136.6791 | 11,33 | 24.988 | 24.306 | 0.956 | 0.777 | 0.054 | 0.038 | r,o |
| V71 | 13845 | ab | 0.619 | 136.9440 | 11,35 | 25.442 | 24.799 | 1.135 | 0.691 | 0.016 | 0.050 | r |
| V16 | 3518 | ab | 0.660 | 136.5867 | 9,32 | 25.026: | 24.440: | 0.942 | 0.552 | 0.043 | ||
| V368 | 63851 | ab | 0.661 | 137.3691 | 10,34 | 25.133 | 24.566 | 0.814 | 0.706 | 0.052 | ||
| V363 | 62059 | ab | 0.669 | 136.7334 | 11,33 | 24.924: | 24.541: | 0.854 | 0.690 | 0.046 | 0.058 | b |
| V252 | lc4324 | ab | 0.522 | 138.5254 | 10,35 | 25.438 | 24.693 | 1.247 | 0.901 | 0.061 | u | |
| V20 | lc1109 | ab | 0.542 | 142.6077 | 10,35 | 25.462 | 24.687 | 0.900 | 0.871 | 0.039 | u | |
| V273 | lc1418 | ab | 0.579 | 138.5501 | 10,33 | 25.436 | 24.637 | 1.261 | 0.762 | 0.040 | u | |
| V291 | lc2607 | ab | 0.597 | 138.6625 | 11,27 | 25.345 | 24.857 | 1.000 | 0.854 | 0.034 | u | |
| V236 | lc1434 | ab | 0.600 | 136.8293 | 11,34 | 25.338 | 24.891 | 0.887 | 0.702 | 0.043 | u | |
| V173 | lc453 | ab | 0.603 | 137.6550 | 10,35 | 25.063 | 24.517 | 0.905 | 0.601 | 0.032 | u | |
| V118 | lc3704 | ab | 0.611 | 138.5208 | 11,33 | 25.492 | 24.809 | 1.039 | 0.667 | 0.038 | 0.038 | u |
| V251 | lc1611 | ab | 0.680 | 136.7060 | 10,35 | 24.956: | 24.581: | 0.601 | 0.584 | 0.042 | u |
r = outside the red edge of the RR Lyrae instability strip
b = outside the blue edge of the RR Lyrae instability strip
o = overluminous
u = uncertain. These 8 ab-type RR Lyrae stars have been approximately
scaled following the procedure described in Sect. 6.4.
| IDr | ID | Type | Epoch | Notes | ||||||||
|---|---|---|---|---|---|---|---|---|---|---|---|---|
| (days) | (2452000) | (mag) | (mag) | (mag) | (mag) | (mag) | (mag) | |||||
| V28 | 6555 | LL-C | 0.364 | 136.8996 | 10,30 | 24.730 | 23.968 | 0.568 | 0.256 | 0.029 | r | |
| V195 | 33491 | LL-C | 0.427 | 136.5877 | 10,32 | 23.960 | 23.214 | 0.256 | 0.168 | 0.012 | ||
| V287 | 49919 | C | 0.444 | 137.3166 | 11,34 | 23.011 | 22.414 | 0.293 | 0.326 | 0.021 | 0.013 | |
| V352 | 60392 | LL-C | 0.485 | 137.1243 | 11,34 | 24.983 | 24.280 | 1.170 | 0.619 | 0.172 | 0.030 | r |
| V289 | 50637 | C | 0.582 | 136.7562 | 10,30 | 23.324: | 22.390: | 0.356 | 0.184 | 0.007 | r | |
| V321 | 54941 | LL-C | 0.589 | 136.7459 | 11,35 | 24.831 | 24.028 | 0.718 | 0.473 | 0.055 | 0.026 | r |
| V298 | 51755 | C | 0.593 | 136.3162 | 11,34 | 23.158 | 22.215 | 0.181 | 0.139 | 0.008 | 0.004 | r |
| V36 | 7820 | LL-C | 0.594 | 136.5410 | 10,34 | 25.021 | 24.237 | 0.618 | 0.480 | 0.033 | r | |
| V343 | 59491 | LL-C | 0.594 | 136.0593 | 9,31 | 24.861 | 23.762 | 0.569 | 0.245 | 0.022 | rr | |
| V70 | 14051 | LL-C | 0.596 | 136.7500 | 11,34 | 25.039 | 24.239 | 0.665 | 0.325 | 0.042 | 0.017 | r |
| V27 | 6138 | LL-C | 0.598 | 136.3832 | 11,33 | 24.153 | 23.219 | 0.900 | 0.495 | 0.074 | 0.043 | rr |
| V63 | 12626 | LL-C | 0.599 | 136.5500 | 10,32 | 24.932 | 24.220 | 0.606 | 0.253 | 0.012 | r | |
| V382 | 66108 | LL-C | 0.603 | 136.7785 | 11,34 | 24.593 | 23.601 | 0.594 | 0.290 | 0.082 | 0.014 | rr |
| V149 | 26386 | LL-C | 0.604 | 142.6521 | 11,34 | 24.702 | 24.234 | 0.890 | 0.415 | 0.040 | 0.030 | |
| V202 | 34124 | LL-C | 0.606 | 136.5086 | 11,33 | 24.643 | 23.903 | 0.529 | 0.381 | 0.048 | 0.012 | r |
| V265 | 46406 | LL-C | 0.607 | 136.6344 | 11,34 | 24.003 | 23.358 | 0.613 | 0.354 | 0.049 | 0.019 | |
| V260 | 45910 | C | 0.607 | 137.2264 | 11,35 | 23.507 | 22.882 | 0.839 | 0.654 | 0.007 | 0.013 | |
| V229 | 40366 | LL-C | 0.612 | 136.9319 | 10,29 | 24.232 | 23.520 | 0.322 | 0.138 | 0.006 | ||
| V79 | 15029 | LL-C | 0.621 | 136.9059 | 10,30 | 24.500 | 23.836 | 0.245 | 0.132 | 0.011 | ||
| V83 | 15435 | C | 0.625 | 135.4346 | 11,35 | 23.387: | 22.766: | 0.607 | 0.460 | 0.008 | 0.014 | |
| V388 | 67385 | LL-C | 0.629 | 138.5180 | 11,30 | 24.899: | 24.282: | 0.726 | 0.604 | 0.048 | 0.046 | |
| V108 | 19458 | C | 0.654 | 136.5122 | 11,34 | 23.550 | 22.947 | 0.418 | 0.271 | 0.023 | 0.011 | |
| V269 | 46990 | LL-C | 0.660 | 136.7447 | 11,33 | 24.747 | 24.175 | 0.604 | 0.546 | 0.079 | 0.054 | |
| V286 | 49740 | LL-C | 0.670 | 136.4926 | 10,34 | 24.565 | 24.021 | 0.627 | 0.273 | 0.024 | ||
| V4 | 1453 | C | 0.706 | 142.6949 | 11,34 | 23.559 | 22.732 | 0.461 | 0.357 | 0.034 | 0.013 | r |
| V290 | 50545 | LL-C | 0.708 | 136.6677 | 11,33 | 24.167: | 23.517: | 0.181 | 0.169 | 0.006 | 0.012 | |
| V181 | 31770 | C | 0.741 | 136.7826 | 11,34 | 23.516 | 22.853 | 0.476 | 0.371 | 0.008 | 0.011 | |
| V58 | 11820 | LL-C | 0.768 | 136.8652 | 11,35 | 23.792 | 23.180 | 1.111 | 0.839 | 0.014 | 0.017 | |
| V390 | 67313 | C | 0.946 | 136.8249 | 11,34 | 23.088 | 22.507 | 0.746 | 0.415 | 0.016 | 0.017 | |
| V315 | 53467 | C | 0.953 | 135.9134 | 11,34 | 23.080 | 22.404 | 0.774 | 0.601 | 0.009 | 0.015 | |
| V278 | 48991 | C | 1.075 | 136.5400 | 11,34 | 22.804 | 22.114 | 0.311 | 0.309 | 0.007 | 0.009 | |
| V358 | 61412 | C | 1.152 | 136.1990 | 11,32 | 23.114: | 22.484: | 0.733 | 0.618 | 0.009 | 0.022 | |
| V364 | 62140 | C | 1.232 | 136.9550 | 11,35 | 22.644: | 22.068: | 0.387 | 0.295 | 0.011 | 0.012 | |
| V369 | 64244 | C | 1.401 | 138.5944 | 11,34 | 23.323 | 22.538 | 1.583 | 0.984 | 0.061 | 0.035 | |
| V183 | 31835 | C | 1.404 | 137.4288 | 11,35 | 22.485 | 21.895 | 0.719 | 0.492 | 0.007 | 0.007 | |
| V386 | 66653 | C | 1.413 | 127.6621 | 11,33 | 23.394 | 22.649 | 0.955 | 0.672 | 0.032 | 0.023 | |
| V276 | 48184 | C | 1.606 | 138.3337 | 11,35 | 23.074: | 22.409: | 1.250 | 0.943 | 0.011 | 0.011 | |
| V105 | 18672 | C | 1.653 | 136.6989 | 11,32 | 22.762: | 22.184: | 0.383 | 0.363 | 0.006 | 0.004 | |
| V140 | 25240 | C | 1.661 | 136.8237 | 11,35 | 23.121: | 22.516: | 1.326 | 0.856 | 0.011 | 0.009 | |
| V29 | 6869 | C | 1.674 | 136.5700 | 11,35 | 23.608: | 22.743: | 0.545 | 0.375 | 0.014 | 0.017 | r |
| V255 | 45136 | C | 1.695 | 134.7770 | 11,35 | 23.220: | 22.475: | 0.846 | 0.525 | 0.025 | 0.008 | |
| V340 | 58803 | C | 1.696 | 136.5150 | 11,35 | 23.198: | 22.442: | 0.824 | 0.626 | 0.023 | 0.016 | |
| V380 | 66001 | C | 1.868 | 142.6077 | 11,33 | 23.138 | 22.353 | 0.517 | 0.555 | 0.040 | 0.015 | |
| V40 | 8364 | C | 1.952 | 136.2943 | 11,32 | 23.184: | 22.426: | 0.821 | 0.643 | 0.005 | 0.008 | |
| V370 | 64036 | C | 2.006 | 136.2700 | 11,31 | 22.881: | 22.197: | 0.699 | 0.838 | 0.010 | 0.017 |
r = outside the red edge of the instability strip
rr= too red colors (stars in crowded regions close to the center
of NGC 6822 or near to regions of active star formation)
| IDr | ID | Type | Epoch | Notes | ||||||||
|---|---|---|---|---|---|---|---|---|---|---|---|---|
| (days) | (2452000) | (mag) | (mag) | (mag) | (mag) | (mag) | (mag) | |||||
| V205 | 34739 | EB | 0.173 | 137.6105 | 11,35 | 23.179 | 23.117 | 0.432 | 0.326 | 0.016 | 0.022 | |
| V115 | 21503 | EB | 0.221 | 138.5170 | 11,35 | 23.743 | 23.153 | 0.370 | 0.174 | 0.028 | 0.016 | |
| V24 | 5659 | EB | 0.431 | 142.6410 | 11,33 | 21.329 | 21.225 | 0.402 | 0.402 | 0.007 | 0.008 | |
| V274 | 48260 | EB | 0.432 | 142.5515 | 11,35 | 23.116 | 22.911 | 0.469 | 0.237 | 0.032 | 0.017 | |
| V216 | 36305 | EB | 0.588 | 142.4700 | 8,35 | 21.050 | 21.135 | 0.138 | 0.591 | 0.009 | ||
| V121 | 22565 | EB | 0.764 | 138.5501 | 10,33 | 25.318 | 24.742 | 2.134 | 2.539 | 0.116 |
Acknowledgements.
We warmly thank Marcella Marconi for providing in advance of publication the theoretical boundaries for the instability strip of RR Lyrae stars, Anomalous and Classical Cepheids calculated from the latest version of her pulsation models. We thank the anonymous referee for useful comments.References
- (1) Alard, C. 2000, A&AS, 144, 363
- (2) Alard, C., & Lupton, R.H. 1998, AJ, 503, 325
- (3) Antonello, E., Fugazza, D., Mantegazza, L., Stefanon, M., & Covino, S. 2002, A&A, 386, 860
- (4) Barning, F. J. M. 1963, Bull. Astron. Inst. Netherlands, 17, 22
- (5) Bono, G., Caputo, F., Santolamazza, P., Cassisi, S., & Piersimoni, A. 1997, AJ, 113, 2209
- (6) Breger, M. 2000, in Scuti and Related Stars, ASP Conference Series, Vol. 210, ed. M. Breger and M. H. Montgomery, (San Francisco: ASP)
- (7) Castelli, F., Gratton, R. G, & Kurucz, R. L. 1997, A&A, 318, 841
- (8) Clementini, G., Di Tommaso, S., Di Fabrizio, L, et al. 2000, AJ, 120, 2054
- (9) Clementini, G., Held, E.V., Baldacci, L., & Rizzi, L. 2003, ApJ, 588, 85
- (10) Corwin, T.M., & Carney, B.W. 2001, AJ, 122, 3183
- (11) Di Fabrizio, L. 1999, Laurea Degree Thesis, University of Bologna
- (12) Di Fabrizio, L., Clementini, G., Maio, M., et al. 2004, A&A, submitted
- (13) Gallart, C., Aparicio, A., & Vilchez, J. M. 1996, AJ, 112, 1928
- (14) Held, E. V., et al. 2004, A&A, in preparation
- (15) Hubble, E. 1925, ApJ, 62, 409
- (16) Kayser, S. 1967, AJ, 72,134
- (17) Kolaczkowski Z., & Pigulski, A., 2004, in Variable Stars in the Local Group, ASP Conference Series, Vol. 310, ed. D.W. Kurtz, and K. Pollard (San Francisco: ASP)
- (18) Landolt, A. U. 1992, AJ, 104, 340
- (19) Lomb, N. R. 1976, Ap&SS, 39, 447
- (20) Marconi, M., Fiorentino, G., & Caputo, F. 2004, A&A, 417, 1101
- (21) McAlary, C. W., Madore, B. F., McGonegal, R., McLaren, R.A., & Welch, D. L. 1983, ApJ, 273, 539
- (22) Pietrzyński, G., Gieren, W., Udalski, A., et al. 2004, AJ, in press (astro-ph/0408572)
- (23) Pigulski A., & Kolaczkowski Z. 2002, A&A, 388, 88
- (24) Pigulski, A., Kolaczkowski, Z., & Kopacki, G. 2003, Acta Astron., 53, 27
- (25) Rice, W. 1993, AJ, 105, 67
- (26) Scargle, J. D. 1982, ApJ, 263, 835
- (27) Schechter, P. L., Mateo, M., & Saha, A. 1993, PASP, 105, 1342
- (28) Soszyýnski, I., Udalski, A., Kubiak, M., et al. 2004, Acta Astron., 54, 129 (astro-ph/0407057)
- (29) Sterken, C., & Jaschek, C. 1996, Light Curves of Variable Stars, Cambridge University Press, Cambridge, UK
- (30) Stetson, P. B. 1994, PASP, 106, 250
- (31) Wray, J. J., Eyer, L., & Paczyński, B. 2004, MNRAS, 349, 1059
- (32) Wood, P. R., Alcock, C., Allsman, R. A., et al. (MACHO team) 1999, in IAU Symp. 191, Asymptotic Giant Branch Stars, ed. T. Le Bertre, A. Lébre, and C. Waelkens (San Francisco: ASP), p.151
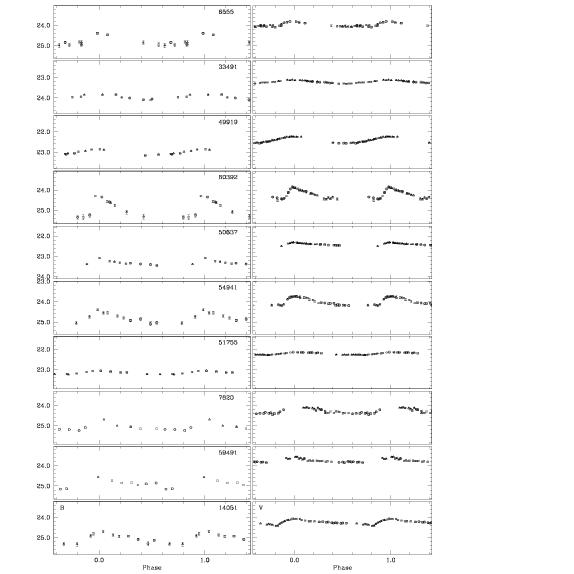
Appendix A Atlas of light curves
We present here an atlas of light curves for the variables stars in NGC 6822 with light curves on a magnitude scale and good sampling of the light variation. The photometric data are folded according to the ephemerides given in Tables 4, 5, 6. Variable stars are grouped by type: RR Lyrae stars (ab-, c-type separately), Cepheids, and eclipsing binaries. Within each group the variables are ordered by increasing period.
![[Uncaptioned image]](/html/astro-ph/0411137/assets/baldacci.figA1b.jpg)
Fig. 8 – continued –
![[Uncaptioned image]](/html/astro-ph/0411137/assets/baldacci.figA3b.jpg)
Fig. 10 – continued –
![[Uncaptioned image]](/html/astro-ph/0411137/assets/baldacci.figA3c.jpg)
Fig. 10 – continued –
![[Uncaptioned image]](/html/astro-ph/0411137/assets/baldacci.figA3d.jpg)
Fig. 10 – continued –
![[Uncaptioned image]](/html/astro-ph/0411137/assets/baldacci.figA3e.jpg)
Fig. 10. – continued –