11email: capetti@to.astro.it 22institutetext: INAF - Osservatorio Astrofisico di Arcetri Largo E. Fermi 5, I-50125 Firenze, Italy
22email: marconi@arcetri.astro.it 33institutetext: Space Telescope Science Institute 3700 San Martin Drive, Baltimore, MD 21218, USA 44institutetext: Affiliated with ESA’s Space Telescope Division
44email: macchetto@stsci.edu 55institutetext: Department of Physics, Rochester Institute of Technology, 85 Lomb Memorial Drive, Rochester, NY 14623, USA
55email: djasps@rit.edu
The supermassive black hole in the Seyfert 2 galaxy NGC 5252 ††thanks: Based on observations obtained at the Space Telescope Science Institute, which is operated by the Association of Universities for Research in Astronomy, Incorporated, under NASA contract NAS 5-26555.
We present results from HST/STIS long-slit spectroscopy of the gas motions in the nuclear region of the Seyfert 2 galaxy NGC 5252. The observed velocity field is consistent with gas in regular rotation with superposed localized patches of disturbed gas. The dynamics of the circumnuclear gas can be accurately reproduced by adding to the stellar mass component a compact dark mass of M☉, very likely a supermassive black hole (BH). Contrarily to results obtained in similar studies rotational broadening is sufficient to reproduce also the behaviour of line widths. The BH mass estimated for NGC 5252 is in good agreement with the correlation between and bulge mass. The comparison with the vs relationship is less stringent (mostly due to the relatively large error in ); NGC 5252 is located above the best fit line by between 0.3 and 1.2 dex, i.e. 1 - 4 times the dispersion of the correlation. Both the galaxy’s and BH mass of NGC 5252 are substantially larger than those usually estimated for Seyfert galaxies but, on the other hand, they are typical of radio-quiet quasars. Combining the determined BH mass with the hard X-ray luminosity, we estimate that NGC 5252 is emitting at a fraction 0.005 of LEdd. In this sense, this active nucleus appears to be a quasar relic, now probably accreting at a low rate, rather than a low black hole mass counterpart of a QSO.
Key Words.:
black hole physics, galaxies: active, galaxies: bulges, galaxies: nuclei, galaxies: Seyfert1 Introduction
It is widely accepted that Active Galactic Nuclei (AGN) are powered by accretion of matter onto massive black holes. AGN activity peaked at and the high (L☉) luminosities of quasi stellar objects (QSOs) are explained by accretion onto super massive ( M☉) black holes at or close to the Eddington limit. The observed evolution of the space density of AGN (e.g. Sołtan 1982, Marconi et al. 2004, Yu & Tremaine 2002) implies that a significant fraction of luminous galaxies must host black holes, relics of past activity. Indeed, it is now clear that a large fraction of hot spheroids contain a massive BH (Kormendy & Gebhardt 2001, Merritt & Ferrarese 2001) and it appears that the BH mass is proportional to both the mass/luminosity of the host spheroid (Magorrian et al. 1998, Marconi & Hunt 2003) and its velocity dispersion (Ferrarese & Merritt 2000, Gebhardt et al. 2000, Tremaine et al. 2002).
Several radio-galaxies, all associated with giant elliptical galaxies, like M87 (Macchetto et al. 1997), M84 (Bower et al. 1998), NGC 7052 (van der Marel & van den Bosch 1998) and Centaurus A (Marconi et al. 2001), are now known to host supermassive ( M☉) BHs in their nuclei. The luminosity of their optical nuclei indicates that they are accreting at a low rate and/or low accretion efficiency (Chiaberge, Capetti & Celotti 1999), with the exception of Cygnus A (Tadhunter et al. 2003). They presumably sustained quasar activity in the past but at the present epoch are emitting much below their Eddington limits (L / L.)
For the radio-quiet AGN, there are two viable explanations for the low luminosity of Seyfert galaxies compared to QSO. Firstly, they may represent a population of less massive BH’s accreting at a level close to their Eddington limit. Support for this interpretation comes from the estimated BH mass derived from reverberation mapping which are found to be in the range between M☉ and M☉ (Wandel, Peterson & Malkan 1999, Kaspi et al. 2000, Peterson 2003). However the data are far from extensive and it is still possible that in some Seyfert nuclei there are much more massive BH, currently in a dormant phase in which the accretion rate is much reduced from their hay-day as QSO’s, i.e. they are relics of past QSO activity of the sort described above. In practice a hybrid population is likely to exist in galaxies as a whole as a consequence of the regulation of BH growth by fluctuations in accretion rate with time. The study of the Seyfert BH mass distribution then provides a statistical method of investigating the interplay between accretion rate and BH growth. In order to achieve this it is necessary to directly measure (bound) the BH masses in Seyfert galaxies and to compare their Eddington and Bolometric luminosities using the hard X-ray luminosities.
Clearly, measurements of BH masses in Seyfert galaxies would provide us not only with very important insights concerning their connection with the past quasars activity, but represent also a crucial test for their unified scheme, as e.g. systematic differences between the BH measured in the two spectroscopic types will argue against the general validity of the unified model. Similarly important will be the comparison between the BH masses found in Seyfert galaxies with those of non active galaxies. Several ongoing HST/STIS program aimed at measuring BH masses in spiral and disk galaxies should constrain the mass function and space density of BHs, and their connection with host galaxy properties (e.g., Hubble type, bulge and disk mass, central velocity dispersion, etc). A comparison of the BH masses in Seyfert and those derived from these programs will allow us to define differences between quiescent and active galaxies. In particular it will be possible to test whether the current level of activity is accompanied by significant growth of the BH mass in active galaxies.
To date, the handful of measurements of BH masses in Seyferts have been obtained using essentially the reverberation mapping technique (Wandel, Peterson & Malkan 1999, Kaspi et al. 2000, Wandel 2002). Despite lingering worries about the limitation of this technique (e.g. Krolik 2001) the good agreement between these estimates and the predictions of the - MBH and - MBH correlations supports the idea that they are indeed reliable estimates of MBH (e.g. Wandel 2002 , Peterson 2003). However, this method is limited to Seyfert 1 only as the broad line region in Seyfert 2 is hidden from our view. Estimates of MBH using H2O masers have not provided similarly compelling evidence or accurate measurements in Seyfert 2 galaxies (Greenhill et al. 1996, 1997a, 1997b, 2003) as in the classic case of NGC4258 (Miyoshi et al. 1995).
Leaving aside the reverberation mapping technique, to detect and measure the masses of massive BHs requires spectral information at the highest possible angular resolution – the ”sphere of influence” of massive BHs is typically 1″ in radius even in the closest galaxies. Nuclear absorption line spectra can be used to demonstrate the presence of a BH, but the interpretation of the data is complex because it involves stellar-dynamical models that have many degrees of freedom (e.g. Valluri, Merritt, & Emsellem 2003). In Seyfert galaxies the problems are compounded by the copious light from the AGN. Studies at HST resolution of ordinary optical emission lines from gas disks in principle provide a more widely applicable and readily interpreted way of detecting BHs (cf. Macchetto et al. 1997, Barth et al. 2001) provided that the gas velocity field are not dominated by non gravitational motions. When dealing with luminous AGN, this is a particularly important issue, as the active nucleus might substantially affect the nuclear gas dynamics. In general, black hole mass estimates based on gas dynamics have large uncertainties if the inclination of the gas disk cannot be constrained at the low inclination end. A significant advantage of studying Seyfert 2 galaxies is that the unified scheme requires the innermost regions to be seen at a sufficiently large inclination to allow the circumnuclear torus to obscure its nucleus and Broad Line Region, effectively eliminating this problem.
Following this chain of reasoning, we obtained STIS observations of NGC 5252, an early type (S0) Seyfert 2 galaxy at a redshift z = 0.023 in order to study its nuclear kinematics and to determine the mass of its central black hole. Adopting Ho = 75 Km s-1 Mpc-1, at the distance of NGC 5252 (92 Mpc), 1″corresponds to 450 pc.
Line emission in this galaxy shows a remarkable biconical morphology (Tadhunter & Tsvetanov 1989) extending out to 20 kpc from the nucleus along PA -15∘. On a sub-arcsec scale (Tsvetanov et al. 1996), three emission line knots form a linear structure oriented at PA , close to the bulge major axis. Ground based measurements of the large scale velocity field of the gas were obtained by Morse et al. (1998) with a resolution of 1.4. They found that, while at radii larger than 40 the gas rotates in the plane of the stellar disk, at smaller radii there is evidence for two superposed dynamical components: a gaseous disk significantly inclined (by ) with respect to the galaxy’s plane and traced by a the dusty spiral structure identified by Tsvetanov et al. (1996); a counterrotating ring coplanar with the stellar disk.
The paper is organized as follows: in Sec. 2 we present the observations and the data reduction that lead to the results described in Sec. 3. In Sec. 4 we model the observed rotation curves taking into account the star distribution. We will show that the dynamics of the circumnuclear gas can be accurately reproduced by circular motions in a thin disk. Our results are discussed in Sec. 5.
2 Observations and data reduction
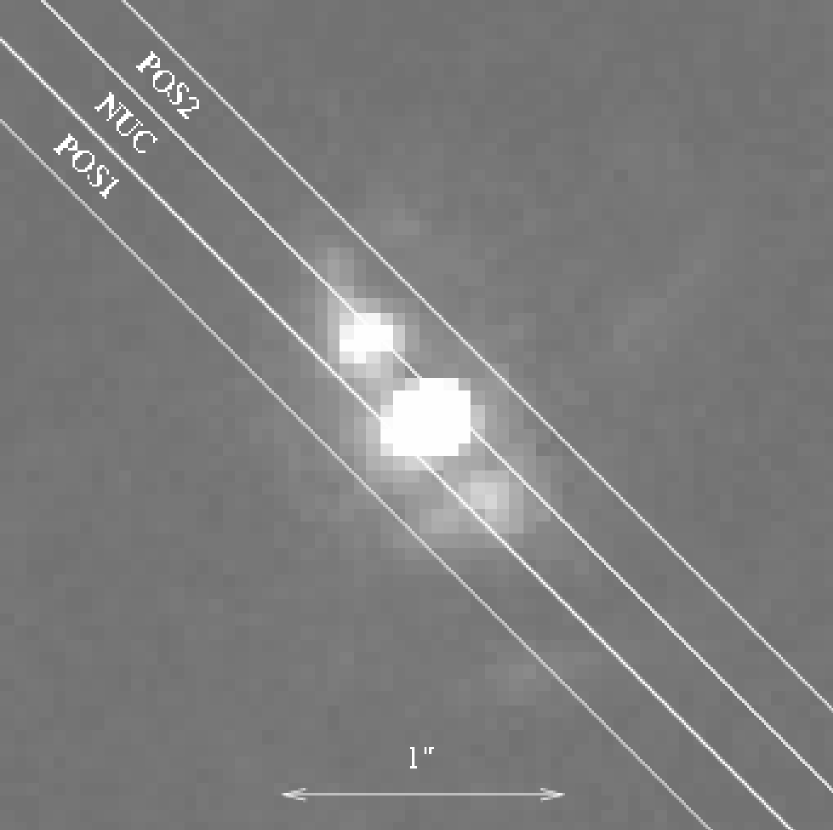
STIS observations were obtained on Jan 29th, 1999. The nucleus of NGC 5252 was acquired with the ACQ mode with two 60 s exposures through the F28X50LP optical long-pass filter. The 50″x 02 slit was then positioned at 3 different locations: on the continuum peak (position NUC) and at two off-nuclear positions (OFF1 and OFF2) offset by 02. The orientation of the slit was -135∘ from North, approximately aligned with the galaxy’s major axis and the triple inner structure of line emission. Fig. 1 shows the slit locations superposed onto the WFPC2 H image.
At each position, we used the medium dispersion grating G750M, which provides a scale of 0.56 Å pixel-1 and, in combination with the 02 slit, a resolution of , centered on the redshifted H line and covering the rest frame wavelength range 6160-6700 Å. The pixel size in the spatial direction is 00507. The exposure time was set at 1000 s for OFF1 and OFF2 and at 1400 s on the nucleus.
The data were calibrated using the CALSTIS pipeline to perform the steps of bias subtraction, dark subtraction, applying the flat field, and combining the two subexposures to reject cosmic-ray events. To reject hot pixels from the data, we employed dark frames obtained immediately before our observations. The data were then wavelength-calibrated and rectified by tracing the wavelenght calibration lamps and then applying these solutions for the geometric distortions to the data.
We then selected the spectral regions containing the lines of interest and subtracted the continuum by a polynomial/spline fit pixel by pixel along the dispersion direction. The continuum subtracted lines were fitted, row by row, along the dispersion direction with Gaussian functions using the task SPECFIT in STSDAS/IRAF. All emission lines present in the spectra (H, [N II]6548,6584 and [O I]6300,6363) were fitted simultaneously with the same velocity and width.
In three regions a single Gaussian does not produce an accurate fit to the line profile: on the nucleus, where there is a strong blue wing, and in the range 02 r 04 on both sides of the nucleus in the NUC slit (at the inner edges of the off-nuclear knots) where the line profile shows a broad base offset from the narrow line core (see Fig. 2). Two Gaussians fit were performed in these regions. We preferred to model the blue wing in the nuclear spectrum with a high velocity component rather than with a broad line as this line asymmetry is also seen in the [O I] and [S II] lines. This contrasts the classification of NGC 5252 as a Sy 1.9 by Osterbrock & Martel (1993).
Where the SNR was insufficient the fitting was improved by co-adding two or more pixels along the slit direction.


3 Results
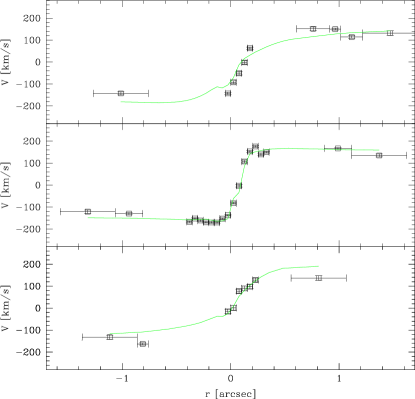
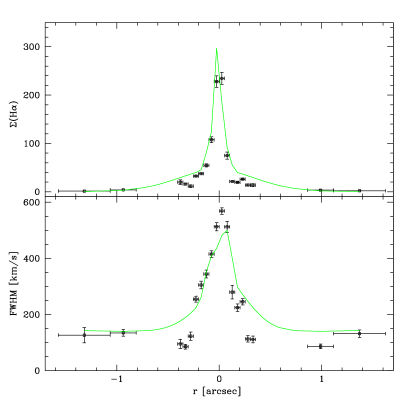
The results obtained from the fitting procedure at the three slit positions are shown in Fig. 3 through Fig. 5 where we show the line central velocity, flux and FWHM at each location along the slits. Emission is detected out to a radius of 16 corresponding to 720 pc.
On the central slit, the line emission (Fig. 4, central panel) is strongly concentrated showing a bright compact knot cospatial with the continuum peak. Two secondary emission line maxima are also present at 0.35″ from the main peak. They represent the intersection of the slit with emission line blobs seen in Fig. 1.


The velocity curve has a full amplitude of 400 and it shows a general reflection symmetry. Starting from the center of symmetry (at 01 and 6950 ) the velocity rapidly rises on both sides by 200 reaching a peak a 02. In this central region both the line flux and the line width rapidly decrease (from the maximum value of 600 to 100 ).
In correspondence with the off-nuclear knots ( 03 - 06) the situation is more complex as in these regions two velocity components are present. The narrower component (FWHM ) has a lower (and decreasing) velocity offset. Its width and flux also decrease with radius, following the trend seen at smaller radii. The second component, marked with an asterisk in Fig. 4, is considerably broader (FWHM ) and shows higher velocity offset with respect to the center of symmetry. At radii larger than 04 the intensity of the narrow component falls below our detection threshold and only the broader component is visible. Lines remain broad out to 08 from the nucleus. At even larger distances the velocity field flattens.
It therefore appears that two different gas systems are present in the nuclear regions of NGC 5252: the first shows a symmetric velocity field, with decreasing line width and can be interpreted as being produced by gas in rotation around the nucleus, counter-rotating with respect to the large scale stellar and gas disk. The second component, showing significant non circular motions, is found to be associated exclusively with the off-nuclear blobs.
The velocity fields in the off-nuclear positions are quite similar to the one seen on the nucleus, but here the signal-to-noise is insufficient to provide detailed information on the line profiles. The presence of the high-velocity gas is nonetheless clearly revealed looking at the behaviour of the line width in correspondence of the line knots, but the broad and narrow components cannot be separated.
4 Modeling the rotation curves
Our modeling code, described in detail in Marconi et al. (2003), was used to fit the observed rotation curves. Very briefly the code computes the rotation curves of the gas assuming that the gas is rotating in circular orbits within a thin disk in the galaxy potential. The gravitational potential has two components: the stellar potential (determined in the next section), characterized by its mass-to-light ratio and a dark mass concentration (the black hole), spatially unresolved at HST+STIS resolution and characterized by its total mass MBH. In computing the rotation curves we take into account the finite spatial resolution of HST+STIS, the line surface brightness and we integrate over the slit and pixel area. The is minimized to determine the free parameters using the downhill simplex algorithm by Press et al. (1992).
4.1 The stellar mass distribution
In order to account for the contribution of the stars to the gravitational potential in the nuclear region, the stellar luminosity density is derived from the observed surface brightness distribution.
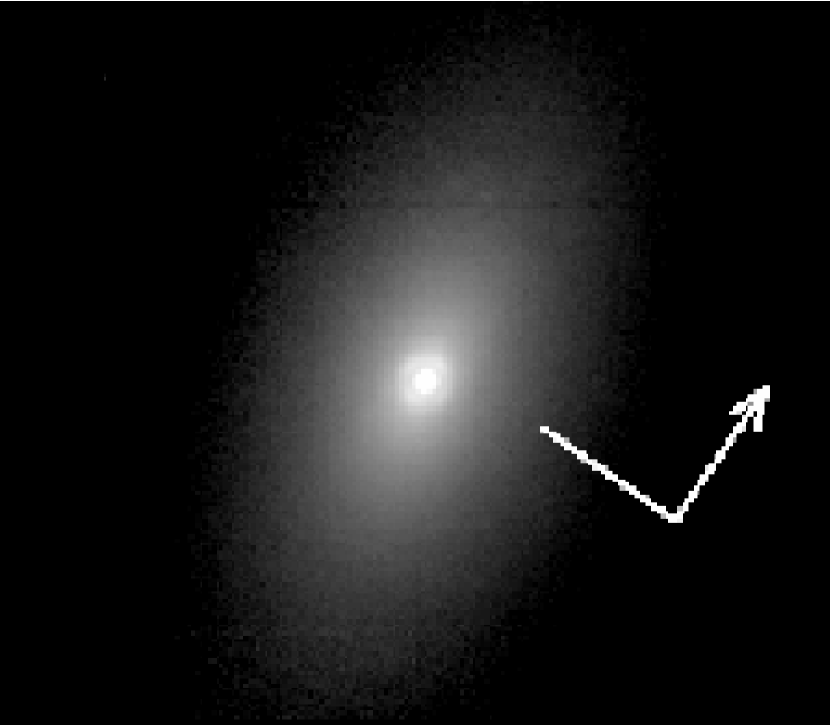
We reconstructed the galaxy light profile using two NICMOS F160W (H band) images obtained with the NIC1 and NIC2 cameras whose pixel size are 0043 and 0075 respectively. The first image, with smaller pixel size (shown in Fig. 6), was used for the central regions (r 1″) while for the more extended emission we took advantage of the larger field of view of camera NIC2. We used the IRAF/STSDAS program ELLIPSE to fit elliptical isophotes to the galaxy that is particularly well behaved (see Fig. 7). Excluding the nuclear regions that are dominated by a central unresolved source, the ellipticity is essentially constant at a value of 0.45 out to a radius of 6″where it slowly increases to a value of 0.55. Also the position angle does not show significant variations being approximately constant at PA = 15∘. All isophotes are concentric within half a NIC1 pixel, i.e. 002.


The inversion procedure to derive the stars distribution from the surface brightness is not unique if the gravitational potential does not have a spherical symmetry as in the case in NGC 5252 where the isophotes are not circular. Assuming that the gravitational potential is an oblate spheroid, the inversion depends on the knowledge of the potential axial ratio , and the inclination of its principal plane with respect to the line of sight. As these two quantities are related by the observed isophote ellipticity, we are left with the freedom of assuming different galaxy inclinations to the line of sight. The measured ellipticity implies a minimum inclination for the galaxy of 53∘. We therefore performed the deprojection for three representative values of the galaxy inclination, namely 55∘, 70∘ and 85∘. Following van der Marel & van den Bosch (1998), we assumed an oblate spheroid density distribution parameterized as:
is given by where is a reference system with the plane corresponding to the principal plane of the potential and is the intrinsic axial ratio. A detailed description of the relevant formulas and of the inversion and fit procedure is presented in the Marconi et al. (2003). The best fit obtained for an inclination of 70∘ is shown in Fig. 8 with = 2.0, =3.1 and =17.5″. The presence of an unresolved nuclear point source, and its associated Airy ring, are clearly visible in Fig. 6. Indeed a point source with flux (7.3 0.1) 10-17 erg s-1 cm-2 Å-1 had to be added to the extended luminosity distribution to provide a good fit to the brightness profile. It has been shown by Quillen et al. (2001) that unresolved infrared sources are found in the great majority of HST images of Seyfert galaxies and that their luminosities strongly correlate with both the hard X-ray and the [O III] line luminosity. This result suggests a dominant AGN contribution to the IR emission. This seems to be the case also for the nuclear source of NGC 5252 (that is part of the Quillen et al. sample) as its luminosities in the IR (1.2 erg s-1) and hard X-ray ( erg s-1, Cappi et al. 1996) make its representative point to lie on the IR - X-ray correlation defined by Seyfert nuclei.
4.2 Fitting the gas kinematics
Our modeling code was used to fit the nuclear rotation curve. Clearly data points associated to the high velocity components in the region 02 08 on both sides of the nucleus, must be excluded from the fitting procedure, but there is some level of arbitrariness in the decision of exactly which portion of the rotation curve to use for the dynamical modeling. As we showed in Sec. 3, based on the behaviour of gas velocity, line width and flux, it appears that it is possible to isolate the component extending the regular nuclear velocity field from the perturbed high velocity patches, at least within 02 04 from the nucleus. Nonetheless, we prefer to always examine the robustness of our results against the more conservative choice of excluding altogether this critical spatial region. For the off-nuclear slits the high velocity component associated to the off-nuclear knots is clearly also present (see e.g. the local velocity minima at r=-03 and -06, corresponding to maxima of flux in Fig. 5) but here the signal to noise is insufficient to deblend it from the narrow component. We conservatively used only the 5 five central points of OFF1 and OFF2 and those at radii larger than 08. The fit was also constrained using the values of the line width over the same regions.
The observed emission line surface brightness was modeled with a composition of two Gaussians, the first reproducing the central emission peak while the second accounts for the brightness behaviour at large radii. This brightness distribution was used to build the synthetic kinematic models.
Having fixed the line brightness distribution, the free parameters of the fit are
-
•
the systemic velocity, ,
-
•
the impact parameter (i.e. the distance between the nuclear slit center and the center of rotation) ,
-
•
the position of the galaxy center along the nuclear slit ,
-
•
the angle between the slits and the line of nodes, ,
-
•
the disk inclination ,
-
•
the mass to light ratio, ,
-
•
the black hole mass .
Concerning the disk inclination, in a oblate spheroid, the stable orbits of the gas are coplanar with the principal plane of the potential and it is possible to directly associate the galaxy inclination and line of nodes with those of the circumnuclear gas. However, the potential shape is not sufficiently well determined by the isophotal fitting down to the innermost regions of the galaxy and it is quite possible that a change of principal plane might occur at the smallest radii, in particular in the presence of a supermassive black hole. We then preferred to leave the disk inclination as a free parameter of the fit.
We then performed a minimization allowing all parameters to vary freely. We also tested that the effects of assuming different galaxy inclinations for the deprojection of the stars surface brightness have a negligible impact on the final values of the free parameters.
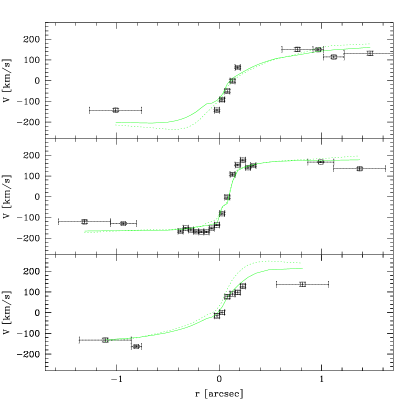
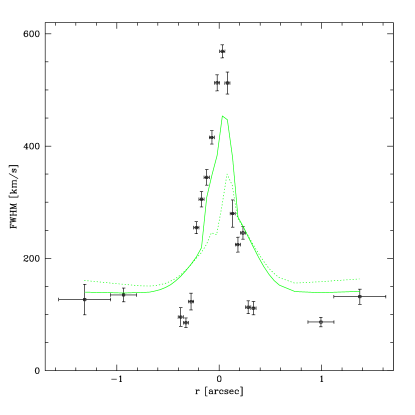
The best fit to our data is shown in Fig. 9 and is obtained for the set of parameters reported in Table 1. The residuals between the fit and the data (see Fig. 13, upper panel) show the good agreement between the model and the observed velocity points and line width indicating that the kinematics of gas in the circumnuclear regions of NGC 5252 can be successfully accounted for by circular motions in a thin disk. We also note that, contrarily to results obtained in similar studies (Barth et al. 2001, Verdoes Kleijn et al. 2000, 2002), no additional source of internal gas speed is needed, in addition to rotational or instrumental broadening, to reproduce the behaviour of line width.
| M (M☉) | |||||||
|---|---|---|---|---|---|---|---|
| 77 | -0.03 | 0.01 | 193 | 6950 | 0.46 | 0.95 | 16.5 |
To estimate the uncertainty associated to the black hole mass estimate we explored its variation with respect to the other free parameters, and in particular with those that are more strongly coupled to it, the gas inclination and the mass-to-light ratio .
For the gas inclination, in the case of NGC 5252 the orientation of the galaxy is constrained to be larger than 53∘. On the other hand, even if a change of orientation occurs at small radii, since NGC 5252 is classified as a Seyfert 2, invoking the unified scheme imposes, as we described in the Introduction, a tight lower bound on the inclination of (very conservative). We then selected two representative values, 45∘ and 70∘, for our analysis.
At these fixed values of we derived the best fit for each pair of BH mass and values leaving all other parameters free to vary. We then build a grid at varying and BH mass.
The values of minimum are far larger than the values indicative of a good fit and this is in contrast with the fact that the curves shown in the figures seem to trace the data points well. The reason for this discrepancy is that is not properly normalized (e.g. because not all points are independent or as they do not include the uncertainties in the relative wavelength calibration for the three slits) and/or imply the presence of small deviations from pure rotation. Following Barth et al. (2001) we then rescaled the error bars by adding in quadrature a constant error such that best fitting model provides /dof 1. This is a quite conservative approach as it has the effect of increasing the final uncertainty on . The additional error are found to be 23 km s-1 for the velocity and 80 km s-1 for the velocity width. We rescaled all values of with this procedure.
The result of this analysis is presented in Fig. 10 where we plot the confidence levels. The overall 1 range of the BH mass is M☉.

At this stage we tested how the exclusion of the velocity points in the region 02 04 affects this estimate re-running the modeling code. The difference from the above estimate is marginal as we found a BH mass only 10 % larger ( M☉) with an uncertainty increased by 15 %.
We also estimated the allowed range for the remaining free parameters looking at their range of values restricting to the region of the vs BH mass plane within the 1 confidence level. All parameters are remarkably stable.
-
•
The mass to light ratio in the H band ranges from 0.27 to 0.93, values characteristic of a stellar population with an age of a few Gyr (see Maraston 1998). Only the lower end of this range corresponds to ages which are uncomfortably low for an S0 galaxy; however, given the relatively weak correlation between and , at least within the 1 confidence region, excluding a posteriori low values of mass to light ratios would not significantly affect our estimates of the black hole mass.
-
•
The angle between the slit and the disk line of nodes is 15∘ 10∘, corresponding to a position angle of the disk major axis of 30 10∘ to be compared with host galaxy’s major axis at 15∘. This is consistent with the idea that, although counterrotating with respect to the stars, the nuclear gas is coplanar with the galaxy disk as expected for settled orbits in the galaxy’s potential, As already mentioned in the Introduction, ground based studies evidenced the presence of two gaseous structure in the central regions of NGC 5252. The velocity field seen by HST appears to be extension at the smallest scale of the counterrotating ring.
-
•
The systemic velocity found from our fit is 6950 10 km s-1 (with an additional uncertainty of 12 km s-1 associated to the absolute wavelength calibration) and it is consistent within the errors with the value of 6916 42 NGC 5252 reported by Falco et al. (1999).
5 Discussion
Our model fitting of the nuclear rotation curve of NGC 5252 indicates that the kinematics of gas in its innermost regions can be successfully accounted for by circular motions in a thin disk when a point-like dark mass (presumably a supermassive black hole) of M☉ is added to the galaxy potential.
Let us firstly explore how this mass determination is connected with the properties of the host galaxy.
Concerning the connection between black hole and bulge mass, Marconi & Hunt (2003) report a bulge mass for NGC 5252 of 2.4 M. The value expected for MBH in NGC 5252 from their correlation between MBH and Mbul is 5.7 M☉ in close agreement with our estimate.
Conversely, adopting the central velocity dispersion of NGC 5252 reported by Nelson & Whittle (1995) of 190 27 , the correlation between velocity dispersion and black hole mass (in their different forms as presented by Ferrarese & Merritt, 2000; Gebhardt et al. 2000; Tremaine et al. 2002; Marconi & Hunt 2003) predicts a mass of M☉, where the error is dominated by the uncertainty in . Taken at face value, our estimate for the black hole mass of NGC 5252 is larger by a factor 7 - 10 (depending on which best fit is used) than the value expected from this correlation (see Fig. 11). However, combining the relatively large uncertainty on with the error on the allowed range of upward scatter for NGC 5252 is 0.3 - 1.2 dex, i.e. 1 - 4 times the dispersion of the MBH - correlation.


Nonetheless, this suggests a more critical analysis of our result. The most convincing evidence in favour of the reality of the observed upward scatter comes from the best fit to the rotation curves derived fixing the BH mass to the value predicted by the correlation (i.e. M☉), shown in Fig. 12. This model is unsatisfactory for several reasons: the rotation curve is monotonic (it does not show the observed fall off towards large radii) and, in order to fit the large nuclear gradient, it overpredicts the amplitude of the large scale velocity field; secondly, it does not produce a sufficiently large line width in the central regions. Both effects are clearly indicative of the fact that, adopting this BH mass, the resulting nuclear potential well is not sufficiently deep to account for the observed gas motions. The residuals shown in Fig. 13 (central panel) confirm the shortcoming of this model as they present a relatively large amplitude (up to 50 ) and, even more importantly, systematic departures on both sides of the nucleus. The reduced for this model is 1.46. We conclude that a mass larger than predicted by the correlation between velocity dispersion and black hole mass is needed in the case of NGC 5252. As a comparison, in the same Fig. 12, we also show the best fit obtained without a central black hole. The drawbacks of this model (for which = 2.83) are similar to those discussed for M☉ but quantitatively more prominent.

There are several possibilities to account for the upward scatter in MBH - plane. For example, the measurement of can be affected by the presence of the AGN emission lines. The most likely contaminants are the [Fe VI]5158 and [Fe VII]5177 lines. As they lie on the wings of the Mg absorption lines, this would cause a decrease in the measured . Similarly, correction for a possible rotational contribution to , not unexpected since NGC 5252 is a S0 galaxy, would also enhance the observed scatter. An alternative interpretation comes from inspection of Fig. 1 of Marconi & Hunt (here reproduced as the right panel of Fig. 11): this figure shows that the residuals of the MBH - relation correlate with the galaxy’s effective radius . The brightness profile of NGC 5252 is well described with a de Vaucouleurs law (its Sersic index is 3.92 in the J band) with = 9.7 kpc (Marconi & Hunt 2003), among the largest values for galaxies with measured MBH. In this sense the scatter from the MBH - correlation is not unexpected, strengthening the possible role of this structural parameter in driving the correlations between bulge and black hole properties.
It is also important to compare the properties of NGC 5252 with those of other active galaxies, in particular with Seyfert galaxies and quasars for which estimates of black hole masses are available, derived combining the widths of the broad lines with measurements of the BLR radius, RBLR; BLR radii are derived in part directly from the reverberation mapping technique and in part from the correlation between RBLR and the optical nuclear luminosity (Kaspi et al. 2000, McLure & Dunlop 2001). At least for a sub-sample of Seyfert galaxies it has been possible to show that adopting these estimate they follow both the - MBH and - MBH correlations defined by dynamical estimates of BH masses (e.g. Wandel 2002, Peterson 2003) supporting the reliability of these estimates. In Fig. 14 we present the data for Seyfert and QSO discussed by McLure and Dunlop (2001) including the new determination of BH mass for NGC 5252. Clearly NGC 5252 is an outlier with respect to Seyfert galaxies, as it harbours a black hole larger than typical for these objects, but its host galaxy is also substantially brighter than average. On the other hand, both the black hole and the bulge’s mass are typical of the range estimated for radio-quiet quasars.

The estimate of the black hole mass in NGC 5252 allows us to explore the nature of accretion at work in this source. The luminosity of NGC 5252 in the hard X-ray band 2 - 10 keV is erg s-1 (Cappi et al. 1996). For a standard quasars spectrum the luminosity in this band is 1/30 of the total bolometric luminosity (Elvis et al. 1994). As the Eddington luminosity for a 0.95 109 M☉ black hole is LEdd = 1.3 erg s-1, we estimate that NGC 5252 is emitting at a fraction 0.005 of LEdd. Note that, while on the one hand, this value is substantially lower than expected for a standard QSO (0.1 - 0.5, e.g. McLure & Dunlop 2001), on the other it is significantly higher than what is derived for the low luminosity radio-galaxies discussed in the Introduction. A possible difference in the accretion process in NGC 5252 with respect to other Seyfert galaxies is also supported by its spectrum: contrarily to the extended emission line region where the optical line ratios are typical of Seyfert galaxies, in its central component they are typical of LINERs (Goncalves et al. 1998) and its X-ray spectrum is unusually flat (, Cappi et al. 1996).
We conclude that NGC 5252 appears to be the relic of a luminous quasar, harbouring a large mass black hole, that is now probably accreting at a low rate, rather than a low black hole mass QSO counterpart.
6 Summary and conclusions
We presented results from HST/STIS long-slit spectroscopy of the Seyfert 2 galaxy NGC 5252 at a redshift z = 0.023. The nuclear velocity field shows a general reflection symmetry and it is consistent with the presence of gas in regular rotation; however there are superposed patches of disturbed gas, localized on two off-nuclear emission-line blobs. We separated these two components on the basis of the behaviour of line width and flux, discarding the regions where the disturbed gas appears to dominate. The dynamics of the rotating gas can then be accurately reproduced by motions in a thin disk when a compact dark mass of M☉, very likely a supermassive black hole, is added to the stellar mass component; the estimate of is quite stable against different choices of the spatial regions modeled. This result provides a posteriori support for our interpretation of a gravitational origin for the observed gas motion, also considering the internal consistency of our modeling, e.g. the value of the galaxy mass-to-light ratio, the reduced velocity gradient in the off-nuclear slits with respect to what is measured on the nucleus. Nonetheless, we cannot rule out alternative explanations only on the basis of the data presented in this paper.
The MBH value thus estimated is in good agreement with the correlation between bulge and BH mass, while it is larger that predicted by the correlation proposed between BH mass vs velocity dispersion (), with an upward scatter between 0.3 and 1.2 dex, i.e. 1 - 4 times the dispersion of the correlation. We show that adopting it is impossible to obtain a satisfactory fit to the data. A possible interpretation of this scatter comes from the presence of a correlation between the residuals of the MBH - relation with the galaxy’s effective radius . In fact NGC 5252 has one of the largest values of for galaxies with measured MBH, suggesting a possible role of this parameter in the connection between bulge and black hole properties.
Concerning the properties of its active nucleus, NGC 5252 is an outlier when compared to the available data for Seyfert galaxies, not only as it harbours a black hole larger than typical for these objects, but also as its host galaxy is substantially brighter than average for Seyfert galaxies. On the other hand, both the black hole and the bulge’s mass are typical of the range for radio-quiet quasars. Combining the determined BH mass with the hard X-ray luminosity, we estimate that NGC 5252 is emitting at a fraction 0.005 of LEdd. This active nucleus thus appears to be a quasar relic, now probably accreting at a relatively low rate, rather than a low black hole mass counterpart of QSOs.
References
- (1) Barth, A. J., Sarzi, M., Rix, H., Ho, L. C., Filippenko, A. V., & Sargent, W. L. W. 2001, ApJ, 555, 685
- (2) Bower, G. A. et al. 1998, ApJ, 492, L111
- (3) Cappi, M., Mihara, T., Matsuoka, M., Brinkmann, W., Prieto, M. A., & Palumbo, G. G. C. 1996, ApJ, 456, 141
- (4) Chiaberge, M., Capetti, A., & Celotti, A. 1999, A&A, 349, 77
- (5) Elvis, M. et al. 1994, ApJS, 95, 1
- (6) Falco, E. E. et al. 1999, PASP, 111, 438
- (7) Ferrarese, L. & Merritt, D. 2000, ApJ, 539, L9
- (8) Gebhardt, K. et al. 2000, ApJ, 539, L13
- (9) Goncalves, A. C., Veron, P. and Veron-Cetty, M. -. 1998, A&A, 333, 877
- (10) Greenhill, L. J., Gwinn, C. R., Antonucci, R., & Barvainis, R. 1996, ApJ, 472, L21
- (11) Greenhill, L. J., Moran, J. M., & Herrnstein, J. R. 1997a, ApJ, 481, L23
- (12) Greenhill, L. J., Ellingsen, S. P., Norris, R. P., Gough, R. G., Sinclair, M. W., Moran, J. M., & Mushotzky, R. 1997b, ApJ, 474, L103
- (13) Greenhill, L. J. et al. 2003, ApJ, 590, 162
- (14) Kaspi, S., Smith, P. S., Netzer, H., Maoz, D., Jannuzi, B. T., & Giveon, U. 2000, ApJ, 533, 631
- (15) Kormendy, J., & Gebhardt, K. 2001, in 20th Texas Symposium on Relativistic Astrophysics, eds. J. C. Wheeler and H. Martel (Melville, NY: AIP), 363
- (16) Krolik, J. H. 2001, ApJ, 551, 72
- (17) Macchetto, F., Marconi, A., Axon, D. J., Capetti, A., Sparks, W., & Crane, P. 1997, ApJ, 489, 579
- (18) Magorrian, J. et al. 1998, AJ, 115, 2285
- (19) Maraston, C. 1998, MNRAS, 300, 872
- (20) Marconi, A., Capetti, A., Axon, D. J., Koekemoer, A., Macchetto, D., & Schreier, E. J. 2001, ApJ, 549, 915
- (21) Marconi A., et al. 2003, ApJ, 586, 868
- (22) Marconi, A. & Hunt, L. K. 2003, ApJ, 589, L21
- (23) A. Marconi, G. Risaliti, R. Gilli, L. K. Hunt, R. Maiolino, & M. Salvati Marconi, A., & Salvati M., N. 2004, MNRAS in press, astro-ph/0311619
- (24) McLure, R. J. & Dunlop, J. S. 2001, MNRAS, 327, 199
- (25) Merritt, D. & Ferrarese, L. 2001, in The Central Kiloparsec of Starbursts and AGN, eds. J. H. Knapen et al. (San Francisco: ASP), 335
- (26) Miyoshi, M., Moran, J., Herrnstein, J., Greenhill, L., Nakai, N., Diamond, P., & Inoue, M. 1995, Nature, 373, 127
- (27) Morse, J. A., Cecil, G., Wilson, A. S. and Tsvetanov, Z. I. 1998, ApJ, 505, 159
- (28) Nelson, C. H. & Whittle, M. 1995, ApJS, 99, 67.
- (29) Osterbrock, D. E. & Martel, A. 1993, ApJ, 414, 552
- (30) Peterson, B. M. 2003, ASP Conf. Ser. 290: Active Galactic Nuclei: From Central Engine to Host Galaxy, 43
- (31) Press, W. H., Teukolsky, S. A., Vetterling, W. T., & Flannery, B. P. 1992, Cambridge: University Press
- (32) Quillen, A. C., McDonald, C., Alonso-Herrero, A., Lee, A., Shaked, S., Rieke, M. J., & Rieke, G. H. 2001, ApJ, 547, 129
- (33) Sołtan, A. 1982, MNRAS, 200, 115
- (34) Tadhunter, C. & Tsvetanov, Z. 1989, Nature, 341, 422
- (35) Tadhunter, C., Marconi, A., Axon, D., Wills, K., Robinson, T. G., & Jackson, N. 2003, MNRAS, 342, 861
- (36) Tremaine, S. et al. 2002, ApJ, 574, 740
- (37) Tsvetanov, Z. I., Morse, J. A., Wilson, A. S. and Cecil, G. 1996, ApJ, 458, 172
- (38) Valluri, M., Merritt, D., & Emsellem, E. 2004, ApJ, 602, 66
- (39) van der Marel, R. P. & van den Bosch, F. C. 1998, AJ, 116, 2220.
- (40) Verdoes Kleijn, G. A., van der Marel, R. P., de Zeeuw, P. T., Noel-Storr, J., & Baum, S. A. 2002, AJ, 124, 2524
- (41) Verdoes Kleijn, G. A., van der Marel, R. P., Carollo, C. M., & de Zeeuw, P. T. 2000, AJ, 120, 1221
- (42) Wandel, A., Peterson, B. M., & Malkan, M. A. 1999, ApJ, 526, 579
- (43) Wandel, A. 2002, ApJ565, 762
- (44) Yu, Q. & Tremaine, S. 2002, MNRAS, 335, 965