Sub-millimeter images of a dusty Kuiper belt around Corvi
Abstract
We present sub-millimeter and mid-infrared images of the circumstellar disk around the nearby F2V star Corvi. The disk is resolved at 850 m with a size of AU. At 450 m the emission is found to be extended at all position angles, with significant elongation along a position angle of ; at the highest resolution () this emission is resolved into two peaks which are to within the uncertainties offset symmetrically from the star at 100 AU projected separation. Modeling the appearance of emission from a narrow ring in the sub-mm images shows the observed structure cannot be caused by an edge-on or face-on axisymmetric ring; the observations are consistent with a ring of radius AU seen at inclination. More face-on orientations are possible if the dust distribution includes two clumps similar to Vega; we show how such a clumpy structure could arise from the migration over 25 Myr of a Neptune mass planet from 80-105 AU. The inner 100 AU of the system appears relatively empty of sub-mm emitting dust, indicating that this region may have been cleared by the formation of planets, but the disk emission spectrum shows that IRAS detected an additional hot component with a characteristic temperature of K (implying a distance of 1-2 AU). At 11.9 m we found the emission to be unresolved with no background sources which could be contaminating the fluxes measured by IRAS. The age of this star is estimated to be Gyr. It is very unusual for such an old main sequence star to exhibit significant mid-IR emission. The proximity of this source makes it a perfect candidate for further study from optical to mm wavelengths to determine the distribution of its dust.
1 Introduction
The infrared satellite IRAS found that some 15% of nearby main sequence stars exhibit infrared emission in excess of that expected from the stellar photosphere alone (e.g., Aumann et al. 1984; Backman & Paresce 1993). This excess emission is thought to come from dust which is heated by the star and its temperature ( K) implies that for the majority of stars this dust is in regions analogous to the Kuiper belt in the Solar System ( AU; Wyatt et al. 2004). This analogy is reinforced by detailed analysis of these systems which show that the dust must be continually replenished from a reservoir of larger (km-sized) planetesimals (Wyatt & Dent 2002). Very few stars have been seen to exhibit warm emission from dust at AU from the star; those that do tend to be young with age Myr (Laureijs et al. 2002), an observation which may indicate that these inner regions have been cleared by the formation of planets (e.g., Williams et al. 2004). Further indirect evidence for the presence of planets in these inner regions comes from the clumpy and asymmetric structures of the disks (Holland et al. 1998; Greaves et al. 1998); modeling has shown that these structures may be caused by the effect of an unseen planet’s gravity on the disk (Wyatt et al. 1999; Ozernoy et al. 2000; Wyatt 2003). Thus these debris disks play a fundamental role in increasing our understanding of the outcome of planet formation.
While several hundred stars are now known to exhibit infrared excesses, the next fundamental step is to image this emission. Such images are important for a number of reasons: Imaging confirms that the IRAS excess is associated with star, since the large IRAS beam size means that some excess sources are confused with background objects (Lisse et al. 2002; Jayawardhana et al. 2002; Sheret, Dent, & Wyatt 2004). It also gives a direct measure of the radial location of dust from which conclusions can be drawn about the size and emptiness of the inner regions, as well as about the size and composition of the dust (Wyatt & Dent 2002; Sheret et al. 2004). The detection of asymmetric structures in the images can also be used to set constraints on an unseen planetary system in the inner region (Wyatt 2003). Once this type of detailed information has been accumulated for a sufficient number of disks it will be possible to consider their evolutionary sequence and the diversity of possible outcomes of planet formation around different types of star.
Until recently only six disks had been imaged at wavelengths ranging from the optical (Clampin et al. 2003) through the mid-IR (Telesco et al. 2000), to the sub-mm (Holland et al. 1998; Greaves et al. 1998; Holland et al. 2003), and the mm (Koerner et al. 2001; Wilner et al. 2001). Not surprisingly these were also the six brightest candidates found by IRAS. Five of these disks are found around bright A stars, and one around the nearby K star Eri. The challenge with imaging of debris disks is that they are faint; sub-mm imaging of the brightest disks required several nights of telescope time. Given that fluxes and size scales have large uncertainties based on the IRAS fluxes it is prohibitive to study all IRAS excess sources in the same detail. Recent observational campaigns have had success at resolving disks by focussing on young stars (Williams et al. 2004; Kalas, Liu & Matthews 2004); the disks of stars younger than a few 100 Myr might be expected to be brighter than those of older stars, since there is evidence that disk mass decreases with age (Habing et al. 2001; Greaves & Wyatt 2003). However, a disk was recently resolved in sub-millimeter imaging around a star which is older than the Sun (Greaves et al. 2004). Since the three newly resolved disks are around G and M stars, these new images are filling in our understanding of how disk parameters are affected by spectral type and age.
Here we report on the discovery of a resolved disk around the nearby star Corvi (HD109085), located at pc from the Sun. The star is of spectral type F2V (Mora et al. 2001) and has an age of Gyr (see §5). Its disk is the first to be resolved around a main sequence F star. Previous surveys of the IRAS database found this star to exhibit an infrared excess (Stencel & Backman 1991; Mannings & Barlow 1998), and a recent sub-mm photometric survey concluded that this disk should be large enough to be resolved with sub-mm imaging (Sheret et al. 2004). Sheret et al. also noted that there is a large mid-IR excess in this system which is expected to be at a different radial location to the sub-mm emission.
The structure of this paper is as follows. Sub-mm imaging observations of this system are described in §2 and the results presented in §3. Mid-IR observations of this system are also described in §2 and §3. Modeling of the observations and of the disk’s spectral energy distribution are presented in §4 and a discussion of the implications for the nature of this disk are given in §5.
2 Observations
2.1 Sub-mm
The sub-mm observations of Corvi were made using the Submillimetre Common-User Bolometer Array, SCUBA at the James Clerk Maxwell telescope (JCMT). SCUBA images at wavelengths of 850 and 450 m simultaneously onto arrays containing 91 and 37 bolometers respectively covering a total field of view of diameter (Holland et al. 1999). Each bolometer has diffraction-limited resolution on the sky with beam sizes of and at 850 and 450 m respectively. We observed Corvi (, ) for a total of 13.5 hours over 10 nights (6.4 hours in 2003 January 5-9 and 7.1 hours in 2003 March 13-16 and 21) at an average airmass of 1.4. All nights had excellent weather conditions with zenith opacities in the range 0.5-0.9 at 450 m and 0.12-0.20 at 850 m. Since the arrays instantaneously undersample the sky, a fully sampled image was achieved using the standard technique of jiggle-mapping. In this method the final map is made up of a co-add of 2 second jiggle observations in which the arrays are pointed at different offsets from the star using the secondary mirror (Holland et al. 1999).
Given the small scale of the predicted structure, the pointing was checked thoroughly before and after each 20-40 minute observation on pointing sources 1213-179 or 3C279. The pointing accuracy was found to be , slightly better than the errors quoted for the JCMT. 111The accuracy quoted here is the difference in pointing offsets for the pointings before and after the observations. This was corrected in the reduction by setting the pointing midway between the two pointing observations (i.e., implying that pointing accuracy is ). In all analysis the tracking error due to the F2 correction (http://www.jach.hawaii.edu/JACpublic/JCMT/Facility_description/Pointing/tracking_fault.html) was completely removed in the data reduction; the maximum correction applied during any one observation was . The data for each night were calibrated using Mars when available, or one of the standard secondary JCMT calibrators. Calibration uncertainties were estimated from the night to night gain variation as at 850 m and at 450 m. Point source calibration observations were modeled to show that the PSF of the SCUBA observations could be well fit by Gaussians with FWHM of and at 850 and 450 m respectively.
The first part of the data reduction was accomplished using the SURF package (Jenness & Lightfoot 1998). The data were corrected for atmospheric extinction using 850 and 450 m sky opacities derived from the CSO’s 225GHz (January) and 350 m (March) dipper measurements (Weferling 2004). The CSO dip measurements were taken at 10 minute intervals and their relation to sub-mm opacities is well understood (Archibald et al. 2002). Each 20-40 minute observation was reduced assuming an opacity derived from a polynomial fit to the long term trend of the opacity variation on each night. The accuracy of this method was confirmed using observations of the 850 m opacity measured less frequently at the JCMT using the skydip method (Archibald et al. 2002).
The standard observational technique of sky chopping (at Hz) was used to remove the dominant sky background during each observation; the chop throw employed was in January and in March. The telescope primary was nodded (every 16 seconds) to place the source alternately in both chop beams and thus cancel slower varying sky gradients. Short timescale spatial and temporal variations in sky emissivity (”sky-noise”) were further removed using the SURF routine REMSKY which subtracts the mean level of bolometers not on source during each 2 second jiggle observation. However, even employing these sky subtraction methods a low-level residual background signal remained in each 20-40 minute observation at a level of and mJy/beam at 850 and 450 m respectively. This DC-offset is believed to be caused by residual beam imbalance (not cancelled by nodding) due to a time-dependent spillover signal, most likely from beyond the edge of the primary as the secondary chops and jiggles during a 20-40 minute observation. This residual sky level was removed by subtracting the mean surface brightness from the star from each observation. Since the DC level is constant across the array the subtraction does not result in higher resolution structure being introduced into the final map.
The final part of the reduction was accomplished using custom routines. The data for observations on all nights were rebinned, with the measurements from different bolometers (on different nights) weighted according to their noise; this noise level was estimated from the standard deviation of flux measurements made by each bolometer in an observation. 222While the jiggle pattern may mean that a bolometer moves on and off source during an observation, this does not affect the noise estimate since the source signal is at least ten times fainter the noise in a single 2 second exposure. Bolometers with above average noise on any given night were not included in the final map, and anomalous signals were clipped above the 3 level. The resulting maps do not differ significantly to those produced using SURF’s rebin, however the routines also return a map of the uncertainty in the flux measurements in the map.
2.2 Mid-IR
The mid-IR observations were performed using the Thermal Infrared MultiMode Instrument TIMMI2 at the ESO 3.6m telescope at La Silla. We imaged Corvi for 840 seconds in 2003 November 19 at an airmass of 1.7. The observations used the instrument’s 11.9 m filter and a pixel scale was chosen giving a total field of view of 64″x 48″on the 320x240 pixel array. The sky background was removed by chopping North-South with amplitude and the telescope emission and sky residuals were subtracted by nodding East-West, again with amplitude. This observing strategy means that a straight co-add of the data results in an image which contains two positive and two negative images of any given source. The image was calibrated using observations of the standard star HD71701 taken immediately before the science observation at an airmass of 1.5; the flux of the calibrator in this waveband, 6312 mJy, was derived from the template for the emission spectrum of this star given in Cohen et al. (1999). A conservative estimate of the calibration accuracy was determined from the gain variation throughout the night to be %. The PSF of point sources on this night had FWHM of between and .
3 Results
3.1 Sub-mm
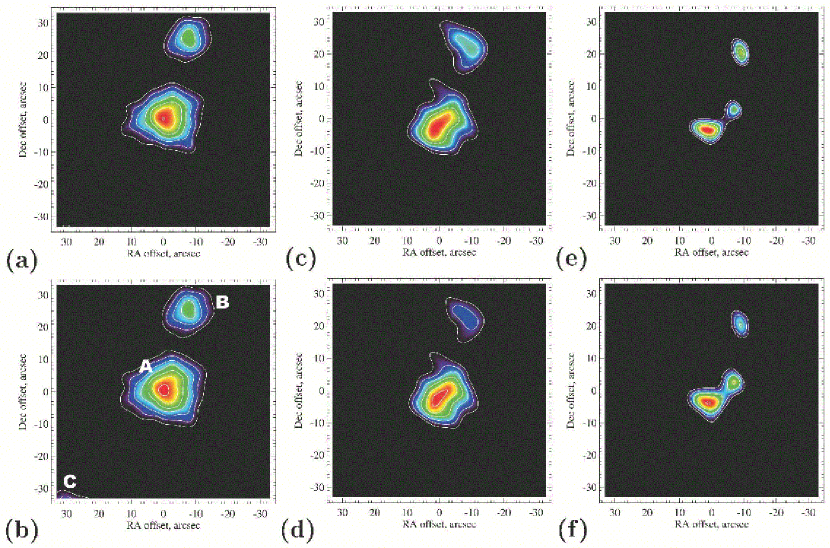
The rebinned 850 and 450 m images of a x region centered on Corvi are shown in Fig. 1. Each pixel in the images represents the weighted mean of all bolometer measurements falling (a) within at 850 m, (c) within at 450 m, and (e) within at 450 m. The error is not constant across the image because of the different noise levels in different bolometers, but its distribution in the region plotted can be approximated by Gaussians with (a) , (c) , and (e) Jy arcsec-2. This uncertainty is quantified in Figs. 1b, 1d, and 1f which show the corresponding signal to noise maps. The same rebin methods were applied to the calibration data which showed that point sources rebinned in this way are slightly smoothed and can be fitted by Gaussians of FWHM (a) 158, (c) 137, and (e) 95.
Extended emission was detected centered on the star (hereafter source A) at each wavelength with greater than confidence. Another source (hereafter source B) was also detected with confidence at both wavelengths at NNW of Corvi. The x field around the star was analyzed to determine the noise level. Structure at confidence is found randomly distributed across the field of view and has the same level and distribution as that expected from noise.333The expected noise distribution was determined by simulating an observation of a blank field: each bolometer was assumed to see noise with a Gaussian distribution with the same standard deviation as the observed scatter in the measurements for that bolometer (in that observation); these data were then rebinned in the same way as the observations in Fig. 1. Thus the zero levels in all maps were set to show only structure detected with confidence. The remaining field is blank on this scale apart from a source (hereafter source C) detected with confidence SW of Corvi at 850 m but not at 450 m; the edge of source C can just be seen in the bottom left corner of Figs. 1a and 1b. The fluxes, locations and morphologies of these sources are discussed in more detail below.
3.1.1 Source A: Circumstellar disk
The extended emission found centred on the star (source A) we attribute to a circumstellar disk detected by IRAS in the far-IR (e.g., Stencel & Backman 1991). Fitting a Gaussian to the rebinned 850 m data indicates that the 850 m emission has a FWHM of and is centered on the star to within . Subtracting the observed PSF (which has a FWHM of ) in quadrature from this measurement implies that the disk is significantly extended on a scale of , indicative of a disk of 100 AU radius. There is no evidence for any azimuthal asymmetry in the 850 m emission.
The structure of the disk is also evident in the 450 m observation at much higher resolution. The 450 m data are presented in two ways: Figs. 1c and 1d show the data rebinned to a resolution of , while Figs. 1e and 1f were rebinned to a resolution of . The former images are appropriate for studying the disk’s larger scale structure, while the latter images show its high resolution structure.
The highest contours in Figs. 1c and 1d show that the emission is elongated along a position angle of . The origin of this axis of symmetry is seen more clearly in the higher resolution image of Fig. 1e in which the emission is resolved into two peaks. These peaks are at an RA and Dec offset of , (at 0.15 mJy arcsec-2) and , (at 0.13 mJy arcsec-2). Given that the two peaks are detected at the and levels, the location of each peak is not known with better precision than (beam size divided by signal-to-noise), and the peaks are equally bright to within the uncertainties. 444The uncertainties in clump location and flux were confirmed by analyzing the effect of noise on models which, in the absence of noise, reproduce two equidistant peaks of equal brightness (§4.1). Thus the observed structure is entirely consistent with two equally bright peaks at 0.14 mJy arcsec-2 that are equidistant from the star at an offset of (100 AU) and a position angle of (counterclockwise from north). Since this is the simplest interpretation of the data, it is the one we adopt in the rest of the paper.
The total flux in a () aperture centered on the star is () mJy at 850 m and () mJy at 450 m. Adding the calibration error in quadrature gives the uncertainty of these measurements as (2.4) mJy at 850 m and (12.9) mJy at 450 m. These fluxes imply disk emission with a spectrum in the sub-mm, consistent with black body emission in the Rayleigh-Jeans regime. The 850 m flux is almost a factor of two higher than that presented by Sheret et al. (2004) who measured mJy for this source. However, the two datasets are consistent because their observations were performed in photometry mode which is insensitive to emission extended on scales larger than the beamsize; Sheret et al. noted that the fluxes they derived could underestimate the true flux by a factor of 2 if the source is extended.
3.1.2 Sources B and C
Source B is located W and N of Corvi at 850 m. Its measured FWHM of 14″at 850 m is not significantly different to that of a point source, and its total flux is mJy in an aperture of diameter555The width of this aperture was chosen to maximise the signal to noise of the detection while not losing the flux at large offsets from the center.. This source thus provides an independent measure of the PSF in the image for comparison with source A. At 450 m the emission peaks at W and N of Corvi and has a total flux of mJy in an aperture. Source C was discovered in the 850 m map at an offset of E, S of Corvi with a total flux of () mJy in an () aperture. No emission was detected from the location of source C in the 450 m image at the upper limit level of (21) mJy in an () aperture. This implies a spectrum of emission .
3.1.3 Background Confusion
Several background sources are expected in any given sub-mm image. Since this star is not in the Galactic plane (it is at a Galactic latitude of ) and is far from known regions of star formation, the density of background sources in this image would be expected to be the same as that measured in similar regions. Scott et al. (2002) estimate that there are about 620 sources per square degree above 5 mJy at 850 m, while there are as many as 2000 sources per square degree above 3 mJy at 850 m (Eales et al. 2000). Smail et al. (2002) estimate that there are some 2000 mJy sources at 450 m per square degree. Thus in the field of view analyzed in this paper, x, we would expect to find: 1.5 sources above 3 mJy in our 850 m image and 1.5 sources above 10 mJy in our 450 m image. These number counts are consistent with sources B and C being background objects and from now on we interpret them as such. The probability of two background sources (at either mJy or mJy at 850 and 450 m respectively) falling within of Corvi, and so providing confusion with source A, is less than 1:300; the chance of one such object falling within this distance is 1:16, so background objects should be considered as a potential source of uncertainty in the low level morphology of this source.
While source B is interpreted as a background object, we note that a 19 mJy source was observed at an offset of (660 AU projected separation) in 850 m images of Pictoris (Holland et al. 1998). Thus it is possible that offset sub-mm clumps may be more commonly associated with debris disks. The spectral slope of source B, emission , is similar to that of source A, meaning that it is not inconsistent with the sources being comprised of dust with similar properties. However, this spectral slope is also similar to that of other background sub-mm objects (, Smail et al. 2002) and further study is required to determine the true nature of this object. If associated with the star the projected separation of source B (480 AU) would make it a highly unusual object.
3.2 Mid-IR
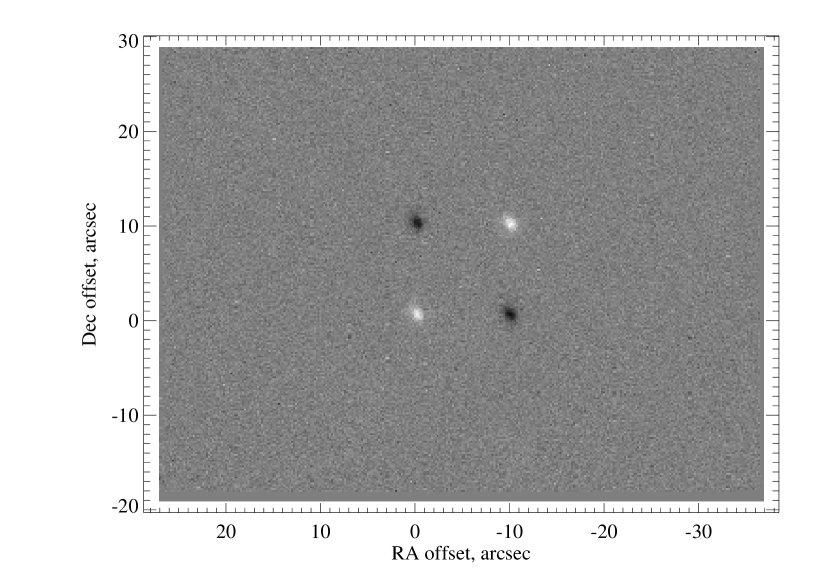
The image resulting from the 11.9 m observations of Corvi described in §2.2 is presented in Fig. 2. The pattern of positive and negative sources shown in this image is that expected from a single source centered on the star. Each of the peaks was detected with a statistical signal to noise of , and is consistent with point source emission (FWHM of ). The total measured flux was Jy (); the dominant uncertainty in this flux estimate is the calibration uncertainty. This is consistent, within the error bars of the measurement, with the Jy at 12 m measured by IRAS (Table 1). Further point-like sources within the field of view, including at the location of source B, were ruled out at mJy with certainty.
4 Modeling
4.1 Modeling the 450 m images
A disk structure characterized by two bright lobes equidistant from the star has previously been seen in the disks of Fomalhaut and HR4796A and interpreted as evidence of an edge-on dust ring (e.g., Holland et al. 1998; Telesco et al. 2000; Holland et al. 2003). However, two clumps straddling the star have also been observed and interpreted as azimuthal asymmetries in a face-on dust ring around Vega (Holland et al. 1998; Koerner et al. 2001; Wilner et al. 2002). Vega’s disk was assumed to be face-on due to the symmetric nature of the lower level contours (Holland et al. 1998). In this respect the Corvi disk bears more resemblance to Vega than to Fomalhaut: In Fig. 1c the source is significantly resolved at all position angles, and is only slightly elongated with a FWHM of along a position angle of and at . Subtracting these observed widths in quadrature from the FWHM of a point source (), we infer that this emission comes from a ring at moderate inclination ( from edge-on) to our line-of-sight.
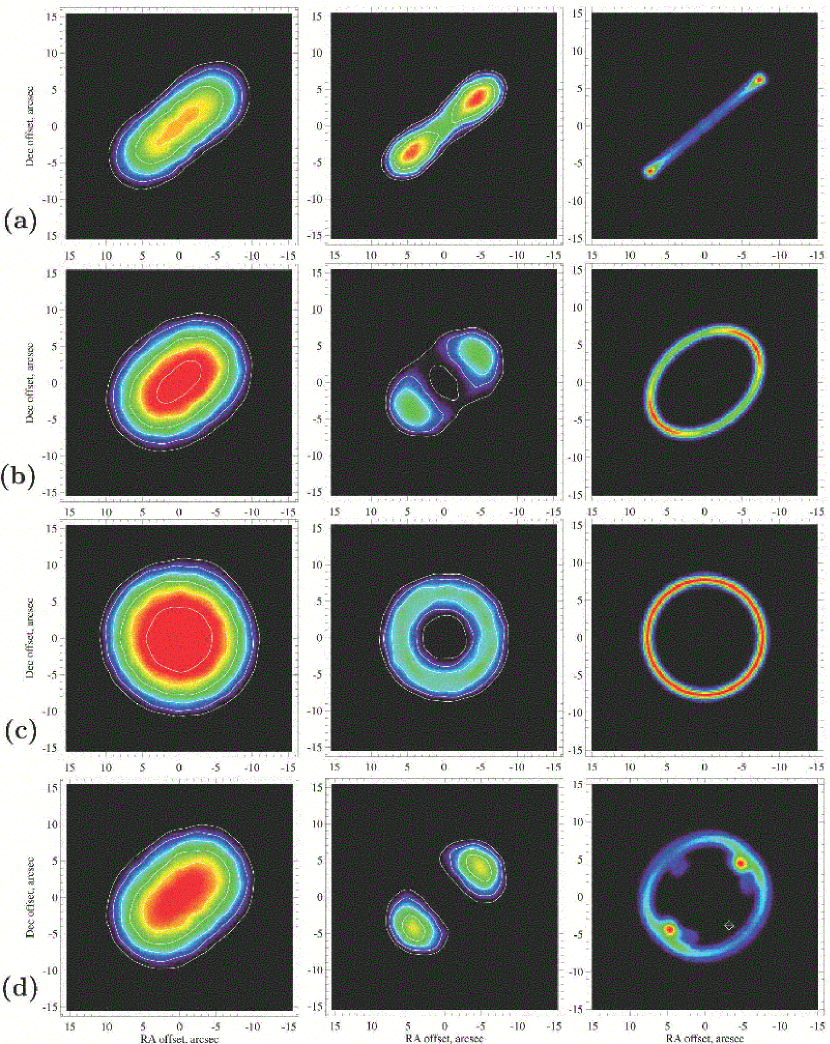
We simulated the 450 m image by making a model of the predicted emission distribution, smoothing it by the PSF ( Gaussian), then using the resulting image to determine the expected flux measured by each bolometer in each jiggle observation in the SCUBA data and rebinning the model in the same way as the observation (Fig. 1). A noisy model was also made by adding Gaussian noise at the same level as the deviation in the measurements for bolometers in individual observations to determine the extent to which noise affects the observed structure.
The simplest model which was considered was one in which the emission comes from an axisymmetric torus of width AU which is inclined to our line-of-sight. The radius and surface density of the ring were constrained by the FWHM and peak fluxes in the resulting images, leaving the inclination of the ring as the only free parameter. Simulated observations of models inclined by , , and from edge-on are shown in Figs. 3a, 3b, and 3c, respectively; the radii of the rings in these models were determined to be 140, 150, and 180 AU respectively, all with errors of AU. It is possible to rule out the edge-on model at the statistically significant level, because this model does not fit the run of flux vs distance from the peak along a position angle of (the model is unresolved, FWHM of , in the left panel of Fig. 3a). This means that while the peak fluxes in the images are well reproduced, the total flux within 15″from this model is just 37 mJy, more than below that observed. The face-on model is also ruled out at a statistically signficant level because it fails to reproduce an axis of symmetry. This symmetry can be shown to be significant, since the total flux measured by bolometers falling within 10″of the star and within of a position angle of is mJy, whereas the same measurements for position angles centered on and are and mJy respectively. We conclude that if this disk is axisymmetric, an inclination of to our line-of-sight is most likely, and its radius is AU. An inclination of from edge-on is consistent with the disk being aligned with the stellar equator given that the star Corvi has km s-1 (Mora et al. 2001) whereas the mean for F0V stars is 106 km s-1 (Abt & Morrell 1995).
An inclination of is still possible, however, if, like the Vega disk, the structure of the Corvi disk includes two clumps, one on either side of the star. Such an axis of symmetry is to be expected if the disk is being perturbed by planets. Under a wide variety of conditions two clumps approximately equidistant from the star are expected, either because P-R drag makes the dust migrate into the exterior mean motion resonances of a massive planet (Kuchner & Holman 2003) or because the parent planetesimals feeding the dust disk were trapped into the resonances of a planet when that planet migrated outward (Wyatt 2003). In Fig. 3d we show how the 450 m disk structure can be explained by a disk inclined by to our line-of-sight in which a Neptune mass planet () migrated out from 80 to 105 AU over a period of 25 Myr and so trapping planetesimals into its 3:2 and 4:3 resonances (Wyatt 2003). In this model the planet is at an offset of at a position angle of either 40 or . The planet’s mass (and the time it took to complete its migration) are poorly constrained in this model because a wide variety of parameters would cause two clumps (Wyatt 2003).
We have presented two possible models which fit the 450 m observations to within the uncertainty due to noise (Figs. 3b and 3d). Clearly further observations are required to determine the true morphology and orientation of the disk. High resolution observations, such as those provided by sub-mm or mm interferometry or optical coronography, would be able to distinguish between the two models presented here, or tell if an alternative model is required.
Regardless of the axisymmetry of the dust ring and its inclination, the 450 m images show there is a lack of sub-mm emitting dust inside 100 AU. To understand this, consider that the models presented in Figs. 3b and 3d fit the surface brightness distribution at both AU from the star and at the stellar location, even though there is no dust at AU in the models. The reason is that emission at the stellar location is seen from the 150 AU ring because of the resolution of the observation. We set a conservative constraint on the emission from an unresolved sub-mm component from the uncertainty in the surface brightness at the center of Figs. 1c and 1e; i.e., an additional unresolved component is ruled out at mJy at 450 m, or less than one third of the total disk flux.
4.2 Modeling the SED
The SED of Corvi from optical to sub-mm wavelengths is plotted in Fig. 4. The IRAS fluxes were determined from SCANPI (IRAS Scan Processing and Integration), available at the IRSA website (http://irsa.ipac.caltech.edu) and the new values (including a previously unpublished detection at 100 m) are given in Table 1. The stellar fluxes at mid-IR to sub-mm wavelengths were determined from a 7080 K Kurucz atmosphere scaled to the near-IR fluxes in Sylvester et al. (1996). Color corrected stellar fluxes were subtracted from the IRAS fluxes to give the excess fluxes (which were also color corrected). Excess emission is found at all wavelengths from 12-850 m. As noted by previous authors, the spectrum of this excess emission is such that it cannot all be accounted for by dust at a single temperature or distance from the star (Sheret et al. 2004).
Mid-IR spectroscopy presented in Sylvester & Mannings (2000) found that most of the 12 m excess emission must be centered on the star. It is also important that our 11.9 m observations did not detect any additional nearby sources which could be contributing to the 12 m flux measured by IRAS (which could originate anywhere within 30″of the star; Lisse et al. 2002); in particular source B does not have a significant counterpart at 12 m. Combining these findings implies that most of the IRAS emission is centered on a region around the star that is smaller than our measured FWHM, i.e., at AU. Thus we modeled the disk as a single temperature cool component (causing the excess at m) with an additional single temperature hot component (causing the excess at m). The fluxes from the individual components were modeled assuming a black body emission distribution modified by a ratio at (e.g., Dent et al. 2000).
The cool component is well fit by emission at K, and m. The fractional luminosity of this component is and the inferred dust mass assuming an opacity of m2 kg-1 (e.g., Wyatt, Dent & Greaves 2003 and references therein) is . The black body temperature at a distance of 150 AU is 34 K. Thus the dust is only slightly warmer than black body, implying that the dust is comprised of grains larger than a few 10s of m. This is consistent with the inferred which is comparable with that of debris disks of similar age (Dent et al. 2000). In a further study we performed a more detailed SED model using realistic grain properties (see, e.g., Wyatt & Dent 2002; Sheret et al. 2004) and found that this spectrum could be fitted with a dust ring at 150 AU with the same dust size distribution as that expected from a collisional cascade, but one with an additional imposed cut-off for grains smaller than m rather than at m as expected from radiation pressure blow-out (Wyatt et al. 1999). Grains in the size range of 4-30 m must be absent because they are too hot ( K) at this distance from the star to explain the shape of the SED, which would have stronger emission at 25 and 60 m if these grains were present. Possible reasons for the absence of small grains, also seen in the spectrum of Eridani, were discussed in Sheret et al. (2004). These include the possibility that the m grains in the outer disk of Corvi are destroyed in collisions with m grains which are in the process of being blown out of the inner regions by radiation pressure (Krivov et al. 2000). We also note that a dearth of small grains is expected in the model in which clumpy structure is formed by planet migration (Wyatt 2003).
The fit presented in Fig. 4 shows the hot component has a temperature of K (assumed to be black body, i.e., ) and has a fractional luminosity of . While this fractional luminosity is an order of magnitude higher than that of the cool component, the mass of the hot component is inferred to be at least two orders of magnitude less than that of the cold component (because of its higher temperature and lower inferred sub-mm flux). This temperature implies that the dust lies 1-2 AU from the star. While this is the interpretation discussed in the rest of this paper, we note that this distance should be regarded as suggestive rather than definitive, since the two temperature model used to fit the SED may be an oversimplification of the true dust distribution. It is also possible that the dust lies in a more extended distribution wherein the 12 m excess comes from dust which is hotter than 370 K (and so is unresolved), and the 25 m excess comes from cooler dust located between 1 and 150 AU. High resolution mid-IR observations are required to determine the location of the 25 m emission.
5 Discussion
The age of this star has been estimated in the literature to be 1.3 Gyr from its position relative to evolutionary tracks in the HR diagram (Mallik, Parthasarathy & Pati 2003). Such a high age is also consistent with the low X-ray luminosity of Corvi. Hünsch et al. (1999) found this star to have erg s-1, a value which is significantly below that of members of the Pleiades with similar (Micela et al. 1999), implying an age of Myr. On the other hand, this X-ray luminosity lies very close to the mean value of A-F stars in the Hyades cluster (Stern, Schmitt & Kahabka 1995) implying an age of 600-800 Myr. Here we adopt an age of 1 Gyr for Corvi.
Given such a large age, the dust in this system cannot be primordial, since this is much longer than the P-R drag lifetime of the dust: dust with would migrate from 150 AU to 0 AU (where it would evaporate) on timescales of 20 Myr (Burns et al. 1979). This is unlikely to be the ultimate fate of the dust originating at 150 AU, however, since the collisional lifetime of this dust is Myr, so it is more likely to be destroyed in mutual collisions (and then removed by radiation pressure) before it reaches the inner regions. In any case, the dust must be replenished, presumably by the collisional destruction of a population of planetesimals orbiting at 150 AU from Corvi. Using the same collisional modeling as that presented in Wyatt & Dent (2002), we infer from the age of 1 Gyr that the collisional cascade in this system starts with planetesimals a few km in size implying a total mass of in planetesimals in the ring at 150 AU. 666In this model, the collisional lifetimes of planetesimals of different sizes are computed using a model for the outcome of different collisions and assuming a size distribution appropriate for material in a collisional cascade scaled to the surface area of dust in that distribution through a fit to the SED of the disk emission. This is similar to the mass inferred for the collisional cascade of the disk around star Fomalhaut which has an age of 200 Myr (Wyatt & Dent 2002).
The relative lack of dust at AU indicates that there is a significant lack of colliding planetesimals in this region. This could be because planet formation has proceeded to such a stage that the planetesimals have grown into planets (e.g., Kenyon & Bromley 2002); the perturbations from the outermost planet of that system are potentially observable in the structure of the outer ring (§4.1). The dust at a few AU must also be replenished. Just like the zodiacal cloud in the solar system, this replenishment could come from either the collisional destruction of planetesimals in an asteroid belt at a few AU or in the sublimation of comets, possibly comets which originated in the cooler outer ring. Mid-IR spectroscopy may be able to shed light on the composition of this dust, and so be able to determine whether this dust formed in a hot region close to the star or if it formed in a cold region far from the star.
The age of 1 Gyr means that it is very surprising that this star has detectable hot emission. The only other stars with mid-IR excesses are young; e.g., Laureijs et al. (2002) found no stars older than 400 Myr with excess 25 m emission and Weinberger et al. (2004) found that even at 10 Myr, very few stars have significant mid-IR excess. While it is possible that this is a system which has always had an unusually massive hot dust population, another possibility is that the mid-IR excess is a transient phenomenon. An increase in mid-IR excess might be expected after the break-up of a massive asteroid in an asteroid belt at a few AU (Grogan, Dermott, & Durda 2001), or after an event which perturbed comets from the ring at 150 AU into the inner region. Such an event could have been the recent close passage of a nearby star (Larwood & Kalas 2001), or the recent scattering and subsequent migration of a Neptune-sized planet from its formation at a few 10s of AU out to AU (e.g., Thommes, Duncan & Levison 2002).
References
- Abt & Morrell (1995) Abt, H. A., & Morrell, N. I. 1995, ApJS, 99, 135
- Archibald et al. (2002) Archibald, E. N., et al. 2002, MNRAS, 336, 1
- Aumann et al. (1984) Aumann, H. H., et al. 1984, ApJ, 278, L23
- Backman & Paresce (1993) Backman, D. E., & Paresce, F. 1993, in Protostars and Planets III, ed. E. H. Levy & J. I. Lunine (Tucson: Univ. Arizona Press), 1253
- Burns et al. (1979) Burns, J. A., Lamy, P. L., & Soter, S. 1979, Icarus, 40, 1
- Clampin et al. (2003) Clampin, M., et al. 2003, AJ, 126, 385
- Cohen et al. (1999) Cohen, M., Walker, R. G., Carter, B., Hammersley, P., Kidger, M., & Noguchi, K. 1999, AJ, 117, 1864
- Dent et al. (2000) Dent, W. R. F., Walker, H. J., Holland, W. S., & Greaves, J. S. 2000, MNRAS, 314, 702
- Eales et al. (2000) Eales, S., Lilly, S., Webb, T., Dunne, L., Gear, W., Clements, D., & Yun, M. 2000, AJ, 120, 2244
- Greaves et al. (1998) Greaves, J. S., et al. 1998, ApJ, 506, L133
- Greaves & Wyatt (2003) Greaves, J. S., & Wyatt, M. C. 2003, MNRAS, 345, 1212
- Greaves et al. (2004) Greaves, J. S., Wyatt, M. C., Holland, W. S., & Dent, W. R. F. 2004, MNRAS, 351, L54
- Grogan et al. (2001) Grogan, K., Dermott, S. F., & Durda, D. D. 2001, Icarus, 152, 251
- Habing et al. (2001) Habing, H. J., et al. 2001, A&A, 365, 545
- Holland et al. (1998) Holland, W. S., et al. 1998, Nature, 392, 788
- Holland et al. (1999) Holland, W. S., et al. 1999, MNRAS, 303, 659
- Holland et al. (2003) Holland, W. S., et al. 2003, ApJ, 582, 1141
- Hünsch et al. (1999) Hünsch, M., Schmitt, J. H. M. M., Sterzik, M. F., & Voges, W. 1999, A&AS, 135, 319
- Jayawardhana et al. (2002) Jayawardhana, R., Holland, W. S., Kalas, P., Greaves, J. S., Dent, W. R. F., Wyatt, M. C., & Marcy, G. M. 2002, ApJ, 570, L93
- Jenness & Lightfoot (1998) Jenness T., Lightfoot J. F. 1998, in Astronomical Analysis Software and Systems VII, ASP Conf. Sed. 145, eds. R. Albrecht, R. N. Hook & H. A. Bushouse, (San Francisco: Astron. Soc. Pac.), 216
- Kalas et al. (2004) Kalas, P., Liu, M. C., & Matthews, B. C. 2004, Science, 303, 1990
- Kenyon & Bromley (2002) Kenyon, S. J., & Bromley, B. C. 2002, ApJ, 577, L35
- Koerner, Sargent & Ostroff (2001) Koerner, D. W., Sargent, A. I., & Ostroff, N. A. 2001, ApJ, 560, L181
- Krivov et al. (2000) Krivov, A. V., Mann, I., & Krivova, N. A. 2000, A&A, 362, 1127
- Kuchner & Holman (2003) Kuchner, M. J., & Holman, M. J., ApJ, 588, 1110
- Larwood & Kalas (2001) Larwood, J. D., & Kalas, P. G. 2001, MNRAS, 323, 402
- Laureijs et al. (2002) Laureijs, R. J., Jourdain de Muizon, M., Leech, K., Siebenmorgen, R., Dominik, C., Habing, H. J., Trams, N., & Kessler, M. F. 2002, A&A, 387, 285
- Lisse et al. (2002) Lisse, C., et al. 2002, ApJ, 570, 779
- Micela et al. (1999) Micela, G., et al. 1999, A&A, 341, 751
- Mallik et al. (2003) Mallik, S. V., Parthasarathy, M., & Pati, A. K. 2003, A&A, 409, 251
- Mannings & Barlow (1998) Mannings, V., & Barlow, M. J. 1998, ApJ, 497, 330
- Mora et al. (2001) Mora, A., et al. 2001, A&A, 378, 116
- Ozernoy et al. (2000) Ozernoy, L. M., Gorkavyi, N. N., Mather, J. C., & Taidakova, T. A. 2000, ApJ, 537, L147
- Scott et al. (2002) Scott, S. E., et al. 2002, MNRAS, 331, 817
- Sheret et al. (2004) Sheret, I., Dent, W. R. F., & Wyatt, M. C. 2004, MNRAS, 348, 1282
- Smail et al. (2002) Smail, I., Ivison, R. J., Blain, A. W., & Kneib, J.-P. 2002, MNRAS, 331, 495
- Stencel & Backman (1991) Stencel, R. E., & Backman, D. E. 1991, ApJS, 75, 905
- Stern, Schmitt & Kahabka (1995) Stern, R. A., Schmitt, J. H. M. M., & Kahabka, P. T. 1995, ApJ, 448, 683
- Sylvester & Mannings (2000) Sylvester, R. J., & Mannings, V. 2000, MNRAS, 313, 73
- Sylvester et al. (1996) Sylvester, R. J., Skinner, C. J., Barlow, M. J., & Mannings, V. 1996, MNRAS, 279, 915
- Telesco et al. (2000) Telesco, C. M., et al. 2000, ApJ, 530, 329
- Thommes et al. (2002) Thommes, E. W., Duncan, M. J., & Levison, H. F. 2002, AJ, 123, 2862
- Weferling (2004) Weferling, B. 2004, A&A, in press
- Weinberger et al. (2004) Weinberger, A., Becklin, E. E., Zuckerman, B., & Song, I. 2004, AJ, 127, 2246
- Williams et al. (2004) Williams, J. P., Najita, J., Liu, M. C., Bottinelli, S., Carpenter, J. M., Hillenbrand, L. A., Meyer, M. R., & Soderblom, D. R. 2004, ApJ, 604, 414
- Wilner et al. (2002) Wilner, D. J., Holman, M. J., Kuchner, M. J., & Ho, P. T. P. 2002, ApJ, 569, L115
- Wyatt (2003) Wyatt, M. C. 2003, ApJ, 598, 1321
- Wyatt & Dent (2002) Wyatt, M. C., & Dent, W. R. F. 2002, MNRAS, 334, 589
- Wyatt, Dent, & Greaves (2003) Wyatt, M. C., Dent, W. R. F., & Greaves, J. S. 2003, MNRAS, 342, 876
- Wyatt et al. (1999) Wyatt, M. C., Dermott, S. F., Telesco, C. M., Fisher, R. S., Grogan, K., Holmes, E. K., & Piña, R. K. 1999, ApJ, 527, 918
- Wyatt et al. (2004) Wyatt, M. C., Holland, W. S., Greaves, J. S., Dent, W. R. F. 2004, Earth Moon Planets, 92, 423
 |
 |
 |
 |
| 1039 | 243 | 42 | 15 | 0.7 | 0.2 |